Note on Accessibility: Persons using mobile devices may find some tables are not fully accessible. Note that you can view tables on a larger screen or in the PDF version of the report/monograph. If you need additional assistance, email us or use our contact form and identify the tables for which access is required. We will assist you in accessing the content. NIH has helpful information on accessibility.
Toxicity Report 102
NTP Technical Report on the Toxicity Studies of Trans-resveratrol (CASRN 501-36-0) Administered by Gavage for Two Weeks or Three Months to F344/NTac Rats, Wistar Han [Crl:WI(Han)] Rats, and B6C3F1/N Mice
Abstract
Trans-resveratrol (RES) is a polyphenol found in various fruits and plants. Numerous in vitro studies have shown its clear antioxidant and anti-inflammatory effects, which has led to additional in vivo and clinical studies evaluating the use of RES to treat diseases such as cancer, cardiometabolic disease, and neurodegenerative disease. Despite growing interest in and use of RES, limited studies have assessed the safety of RES exposure, especially perinatally. The National Toxicology Program conducted toxicity studies to provide these data.
In the 3-month studies, RES (in 0.5% aqueous methylcellulose) was administered via gavage to time-mated Wistar Han rats from gestation day (GD) 6 through lactation day (LD) 21 at doses of 0, 78, 156, 312.5, 625, or 1,250 mg RES/kg body weight/day (mg/kg/day). Doses were selected based on the lack of observed toxicity in 2-week studies in Fischer 344 (F344/NTac) rats. Offspring were administered the same dose as respective dams from postnatal day (PND) 12 through PND 21 and then for 3 months after weaning. In addition, male and female B6C3F1/N mice at 5–6 weeks of age were administered 0, 156, 312, 625, 1,250, or 2,500 mg/kg/day of RES for 3 months.
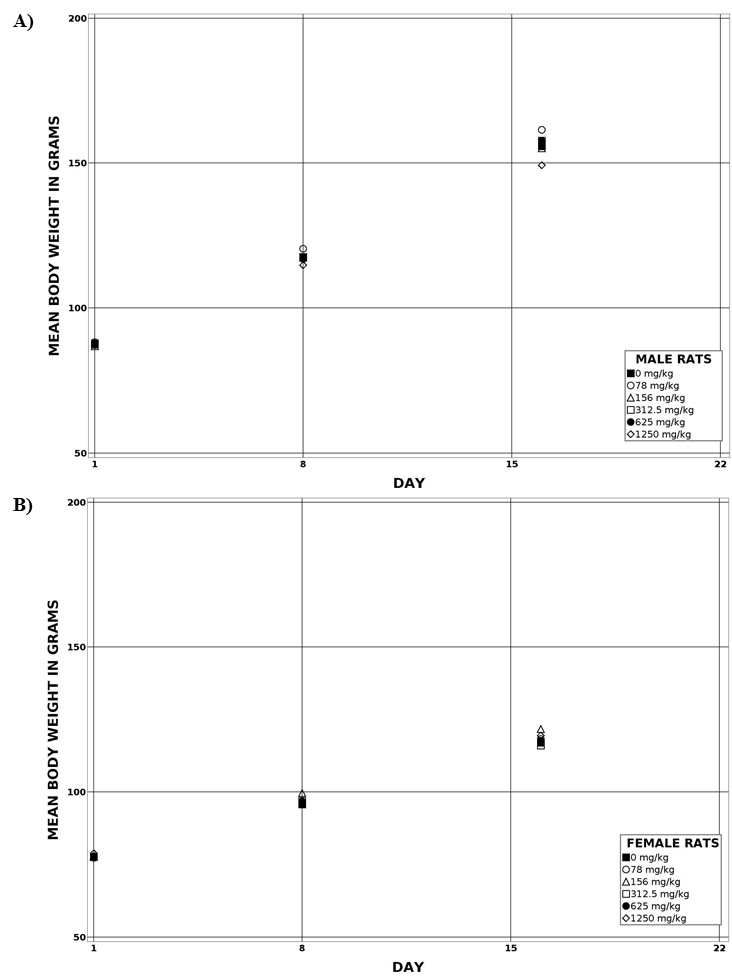
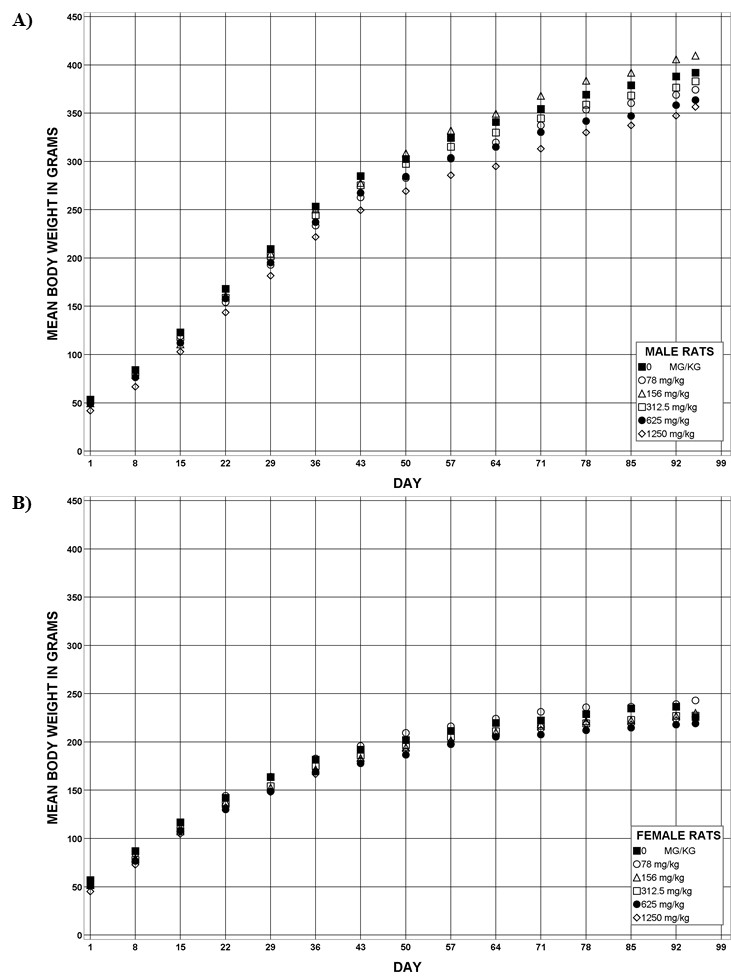
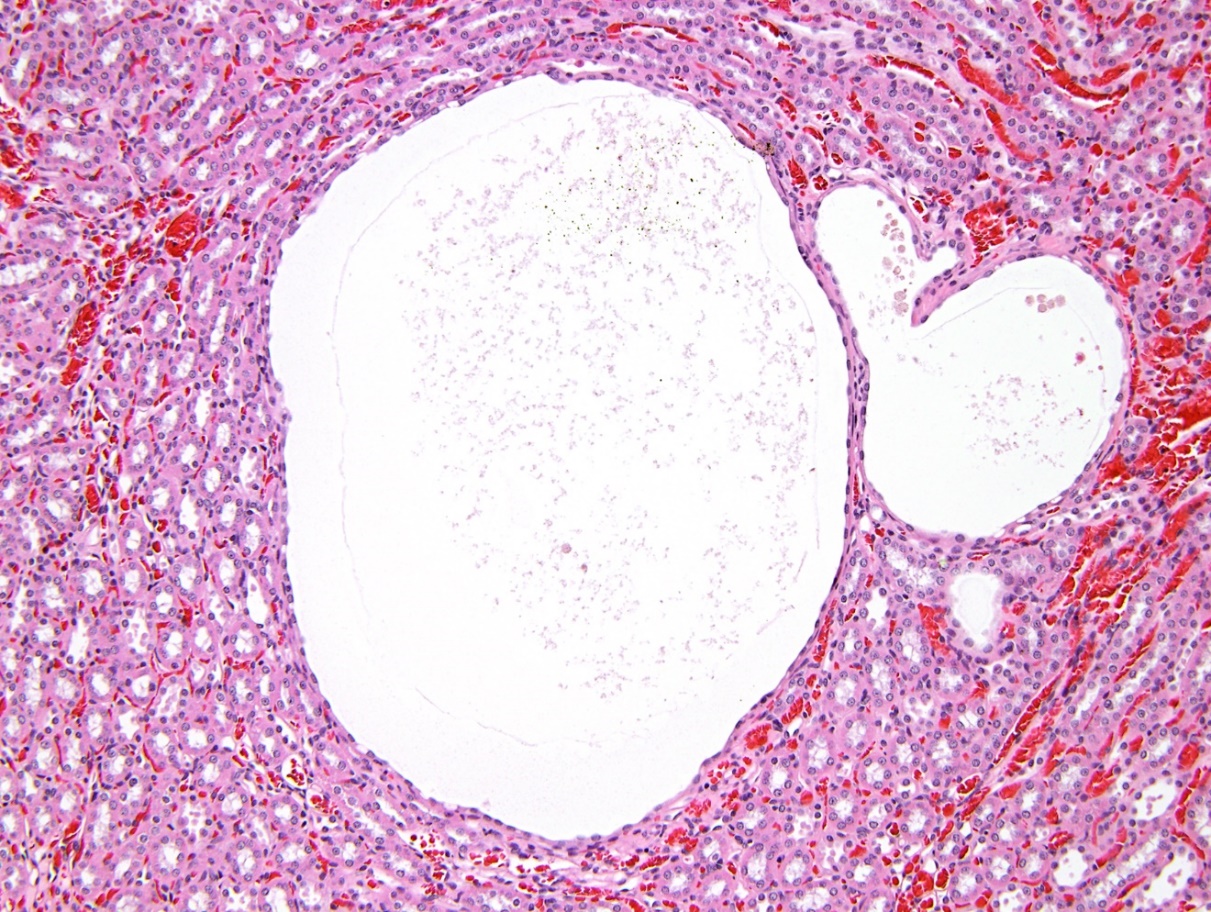
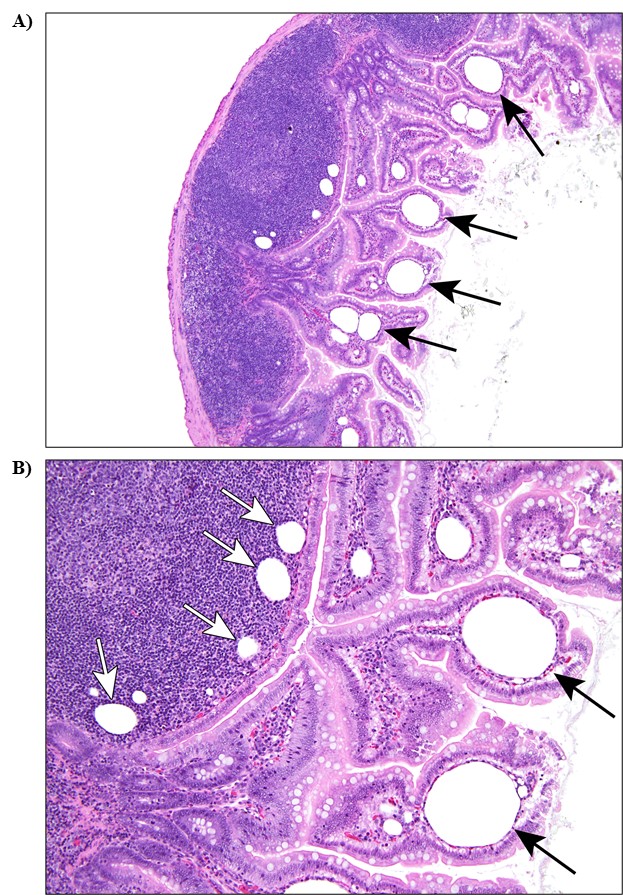
In Wistar Han rats, no dose-related effects of RES on dam survival, gestation length, litter size, or pup weight on PND 1 were identified. Maternal mean body weights and body weight gains of RES-dosed dams were significantly decreased (4%–10% and 19%–35%, respectively) relative to the vehicle control group, especially during the later period of gestation (GD 15–21). The presence of RES and its metabolites in fetal tissue suggested low maternal transfer, and the presence of RES and its metabolites in PND 4 whole pups suggested lactational transfer. Pup mean body weights of RES-dosed groups (≥312.5 mg/kg/day) were lower starting on PND 4 through weaning. During the postweaning period, there was no dose-related effect on survival. Interim mean body weights of male and female rats in the 1,250 mg/kg/day groups during lactation were approximately 20% lower than those of the vehicle control groups. By study termination, mean body weights of all RES-dosed Wistar Han rats were within 10% of the vehicle control groups. There were no dose-related changes in sperm count or estrous cycling. Dose-related histological findings in the Wistar Han rat included nephropathy and renal pelvis and renal tubule dilatation in the kidney and lymphatic ectasia in the small intestine.
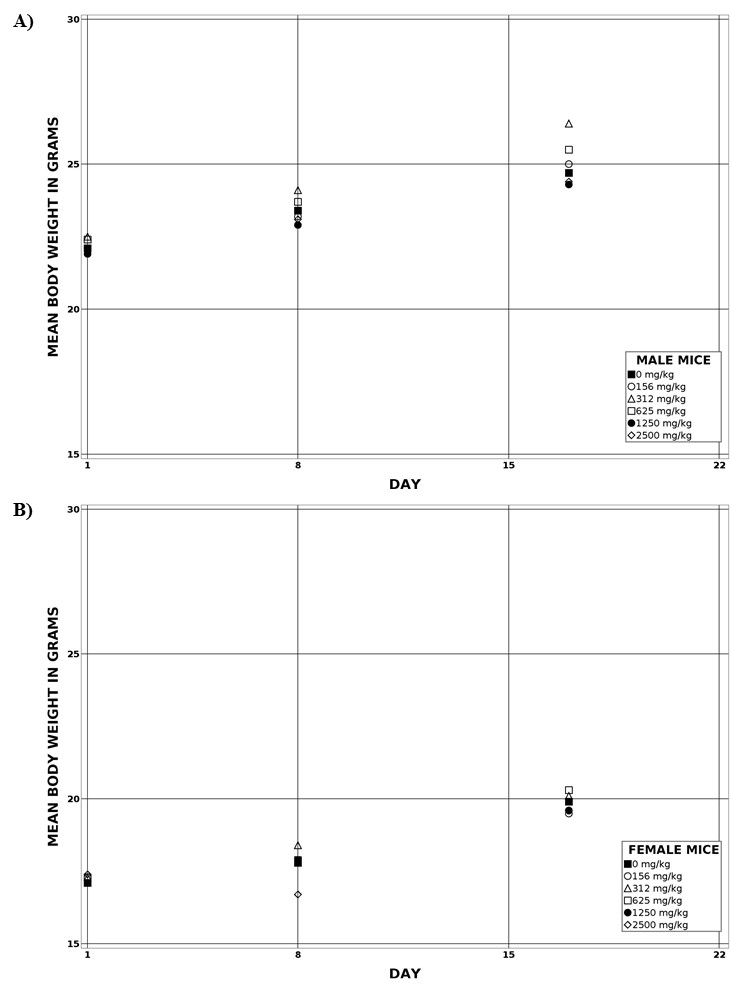
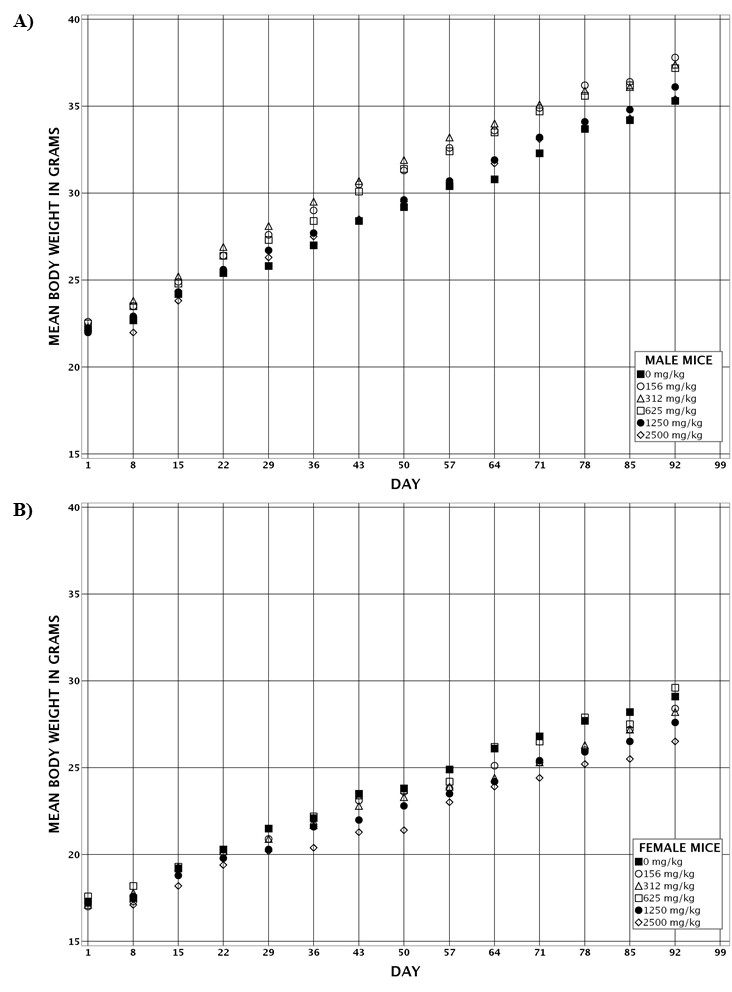
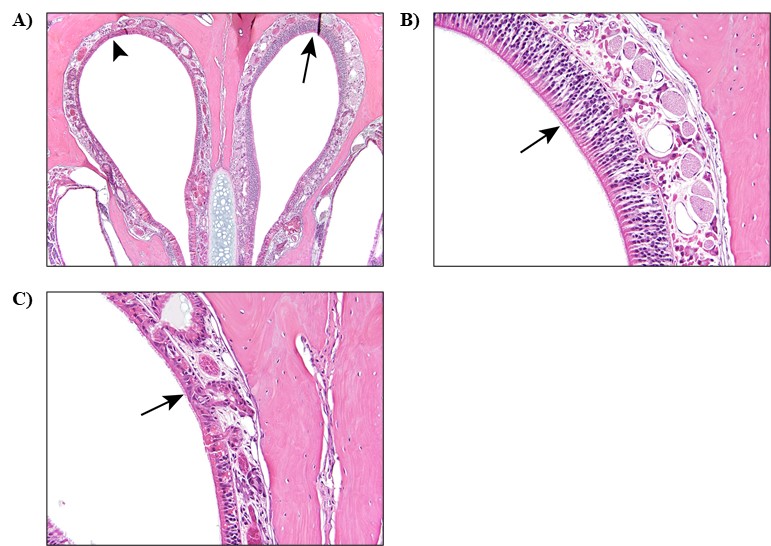
In B6C3F1/N mice, mean body weights were similar between RES-dosed and vehicle control groups throughout the study. After 3 months, there were no dose-related effects on survival. Minimal indications of decreased sperm count and impaired estrous cycling were observed, but these findings were not considered indicative of reproductive toxicity. The absolute and relative liver weights of 2,500 mg/kg/day male mice were significantly increased. Relative liver weights of ≥625 mg/kg/day female mice and relative kidney weights of ≥1,250 mg/kg/day female mice were significantly increased. These increased organ weights were not associated with microscopic findings. Respiratory metaplasia in the olfactory epithelium of the nose was observed in female mice. Increased incidences of this lesion were significant only at the highest dose (2,500 mg/kg/day).
No changes in the frequency of micronucleated reticulocytes and erythrocytes were considered biologically relevant in either species. RES was not mutagenic in the Salmonella typhimurium strains tested.
Under the conditions of this study, the lowest-observed-effect level (LOEL) was 312.5 mg/kg/day in rats as indicated by significantly decreased pup mean body weights of Wistar Han rats exposed perinatally. These body weight differences were resolved in the rat pups by the end of the 3-month study. In B6C3F1/N mice, the LOEL was 625 mg/kg/day as indicated by significantly increased relative liver weights in females; however, these changes in liver weight were not associated with microscopic lesions. The no-observed-effect levels were 156 mg/kg/day in rats and 312 mg/kg/day in mice. Target organs included the kidney and small intestine in rats and the nose in female mice. There was no evidence of genetic toxicity in the micronucleus assay of RES at oral gavage doses up to 1,250 mg/kg/day in Wistar Han rats or up to 2,500 mg/kg/day in B6C3F1/N mice. No clear effects on reproductive parameters were observed. The presence of RES and its metabolites in fetal tissue suggested low maternal transfer, and the presence of RES and its metabolites in PND 4 whole pups suggested lactational transfer.
Synonyms: resveratrol; 3,4',5-stilbenetriol; 3,4',5-trihydroxystilbene; 3,5,4'-trihydroxystilbene
Summary of Findings Considered Toxicologically Relevant in Male and Female Rats and Mice Administered Trans-resveratrol by Gavage for Three Months
| Male Wistar Han Rats | Female Wistar Han Rats | Male B6C3F1/N Mice | Female B6C3F1/N Mice | |
|---|---|---|---|---|
| Doses in aqueous methylcellulose | 0, 78, 156, 312.5, 625, or 1,250 mg/kg/day | 0, 78, 156, 312.5, 625, or 1,250 mg/kg/day | 0, 156, 312, 625, 1,250, or 2,500 mg/kg/day | 0, 156, 312, 625, 1,250, or 2,500 mg/kg/day |
| Survival rates | 10/10, 10/10, 10/10, 10/10, 10/10, 10/10 | 10/10, 10/10, 10/10, 10/10, 10/10, 10/10 | 10/10, 10/10, 10/10, 10/10, 10/10, 10/10 | 10/10, 10/10, 10/10, 10/10, 10/10, 10/10 |
| Body weights | ↓ Pup mean body weight during lactation (up to 22% less than the vehicle control group; 312.5, 625, 1,250 mg/kg/day dosed groups) Final mean body weights of dosed groups within 10% of the vehicle control group | ↓ Dam mean body weight from GD 15 through 21 (up to 10% less than the vehicle control group; 156, 312.5, 625, 1,250 mg/kg/day dosed groups) ↓ Pup mean body weight during lactation (up to 21% less than the vehicle control group; 625, 1,250 mg/kg/day dosed groups) Final mean body weights of dosed groups within 10% of the vehicle control group | Dosed groups within 10% of the vehicle control group | Dosed groups within 10% of the vehicle control group |
| Clinical findings | Nonea | None | None | None |
| Organ weights | None | None | ↑ Absolute and relative liver weight | ↓ Absolute heart weight ↑ Relative kidney weight ↑ Relative liver weight |
| Nonneoplastic effects | Kidney: nephropathy (0/10, 3/10, 1/10, 4/10, 2/10, 7/10); renal tubule, dilatation (0/10, 0/10, 0/10, 0/10, 1/10, 7/10) Small intestine: jejunum, lymphatic ectasia (0/10, 0/10, 0/10, 0/10, 2/10, 2/10); Peyer’s patch, lymphatic ectasia (0/10, 0/10, 1/10, 0/10, 2/10, 1/10) | Kidney: nephropathy (0/10, 0/10, 1/10, 2/10, 3/10, 6/10); renal pelvis, dilatation (0/10, 1/10, 0/10, 1/10, 1/10, 4/10); renal tubule, dilatation (0/10, 0/10, 1/10, 0/10, 0/10, 7/10) Small intestine: jejunum, lymphatic ectasia (0/10, 0/10, 0/10, 0/10, 0/10, 2/10); Peyer’s patch, lymphatic ectasia (0/10, 2/10, 0/10, 1/10, 0/10, 1/10) | None | Nose: olfactory epithelium, metaplasia, respiratory (0/10, 0/10, 0/10, 2/10, 2/10, 4/10) |
| Clinical pathology | None | None | None | None |
| Reproductive findings | None | None | None | None |
| Genetic toxicology | ||||
| Bacterial gene mutations | Negative in Salmonella typhimurium strains TA98, TA100, and TA102, with or without S9 | |||
| Micronucleated erythrocytes (in vivo) | ||||
| Rat peripheral blood: | Negative in males and females | |||
| Mouse peripheral blood: | Negative in males and females | |||
Summary of Findings Considered Toxicologically Relevant in Male and Female Rats and Mice Administered Trans-resveratrol by Gavage for Three Months
| Male Wistar Han Rats | Female Wistar Han Rats | Male B6C3F1/N Mice | Female B6C3F1/N Mice | |
|---|---|---|---|---|
| Doses in aqueous methylcellulose | 0, 78, 156, 312.5, 625, or 1,250 mg/kg/day | 0, 78, 156, 312.5, 625, or 1,250 mg/kg/day | 0, 156, 312, 625, 1,250, or 2,500 mg/kg/day | 0, 156, 312, 625, 1,250, or 2,500 mg/kg/day |
| Survival rates | 10/10, 10/10, 10/10, 10/10, 10/10, 10/10 | 10/10, 10/10, 10/10, 10/10, 10/10, 10/10 | 10/10, 10/10, 10/10, 10/10, 10/10, 10/10 | 10/10, 10/10, 10/10, 10/10, 10/10, 10/10 |
| Body weights | ↓ Pup mean body weight during lactation (up to 22% less than the vehicle control group; 312.5, 625, 1,250 mg/kg/day dosed groups) Final mean body weights of dosed groups within 10% of the vehicle control group | ↓ Dam mean body weight from GD 15 through 21 (up to 10% less than the vehicle control group; 156, 312.5, 625, 1,250 mg/kg/day dosed groups) ↓ Pup mean body weight during lactation (up to 21% less than the vehicle control group; 625, 1,250 mg/kg/day dosed groups) Final mean body weights of dosed groups within 10% of the vehicle control group | Dosed groups within 10% of the vehicle control group | Dosed groups within 10% of the vehicle control group |
| Clinical findings | Nonea | None | None | None |
| Organ weights | None | None | ↑ Absolute and relative liver weight | ↓ Absolute heart weight ↑ Relative kidney weight ↑ Relative liver weight |
| Nonneoplastic effects | Kidney: nephropathy (0/10, 3/10, 1/10, 4/10, 2/10, 7/10); renal tubule, dilatation (0/10, 0/10, 0/10, 0/10, 1/10, 7/10) Small intestine: jejunum, lymphatic ectasia (0/10, 0/10, 0/10, 0/10, 2/10, 2/10); Peyer’s patch, lymphatic ectasia (0/10, 0/10, 1/10, 0/10, 2/10, 1/10) | Kidney: nephropathy (0/10, 0/10, 1/10, 2/10, 3/10, 6/10); renal pelvis, dilatation (0/10, 1/10, 0/10, 1/10, 1/10, 4/10); renal tubule, dilatation (0/10, 0/10, 1/10, 0/10, 0/10, 7/10) Small intestine: jejunum, lymphatic ectasia (0/10, 0/10, 0/10, 0/10, 0/10, 2/10); Peyer’s patch, lymphatic ectasia (0/10, 2/10, 0/10, 1/10, 0/10, 1/10) | None | Nose: olfactory epithelium, metaplasia, respiratory (0/10, 0/10, 0/10, 2/10, 2/10, 4/10) |
| Clinical pathology | None | None | None | None |
| Reproductive findings | None | None | None | None |
| Genetic toxicology | ||||
| Bacterial gene mutations | Negative in Salmonella typhimurium strains TA98, TA100, and TA102, with or without S9 | |||
| Micronucleated erythrocytes (in vivo) | ||||
| Rat peripheral blood: | Negative in males and females | |||
| Mouse peripheral blood: | Negative in males and females | |||
Introduction
Chemical and Physical Properties
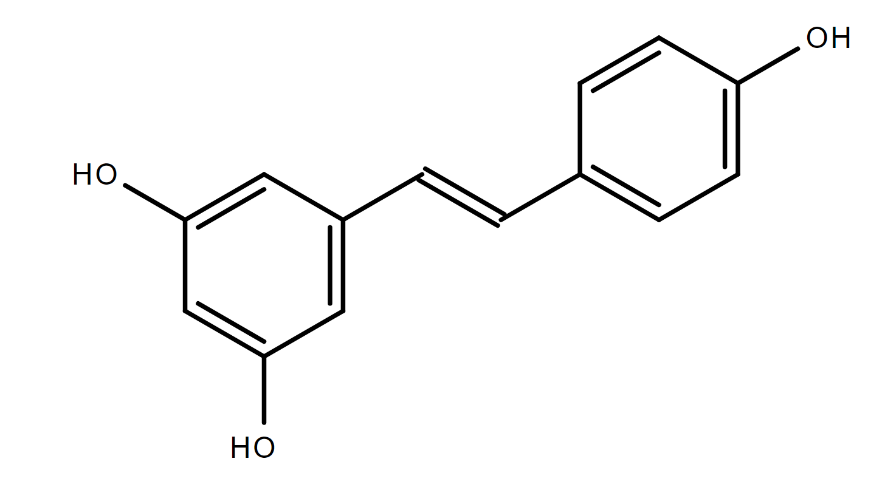
Trans-resveratrol (RES) is a polyphenolic phytoalexin produced by some plants in response to ultraviolet (UV) light, injury, or infection. Stilbene synthase is the final enzyme in the RES synthesis pathway and is stimulated by UV light or fungal infections.2,3 Due to its double bond, resveratrol can exist in the trans- or cis-form; the trans-isomer is more sterically stable.4 Conversion between the trans- and cis-forms can occur with exposure to UV light and is dependent on concentration and pH.5 RES has low water solubility (<0.05 mg/mL) and is more soluble in organic solvents (log Kow of 3.10).6,7 It is an off-white powder with a melting point of 253–255ºC.8 UV absorbance of trans- and cis-resveratrol in ethanol is 306–320 nm and 286–288 nm, respectively.4
2. Fritzemeier KH, Kindl H. Coordinate induction by UV-light of stillbene synthase phenylalanine ammonia-lyase and cinnamate 4-hydrolas in leaves of vitaceae. Planta. 1981; 151:48-52. DOI: 10.1007/BF00384236 PubMed: 24301669
3. Hasan M, Bae H. An overview of stress-induced resveratrol synthesis in grapes: Perspectives for resveratrol-enriched grape products. Molecules. 2017; 22(2):294. DOI: 10.3390/molecules22020294 PubMed: 28216605
4. Trela BC, Waterhouse AL. Resveratrol: Isomeric molar absorptivities and stability. J Agric Food Chem. 1996; 44(5):1253-1257. DOI: 10.1021/jf9504576
5. Flieger J, Tatarczak-Michalewska M, Blicharska E. Characterization of the cis/trans isomerization of resveratrol by high-performance liquid chromatography. Anal Lett. 2017; 50(2):294-303. DOI: 10.1080/00032719.2016.1178756
6. Herbig ME, Evers DH. Correlation of hydrotropic solubilization by urea with logD of drug molecules and utilization of this effect for topical formulations. Eur J Pharm Biopharm. 2013; 85(1):158-160. DOI: 10.1016/j.ejpb.2013.06.022 PubMed: 23958327
7. Amri A, Chaumeil JC, Sfar S, Charrueau C. Administration of resveratrol: What formulation solutions to bioavailability limitations? J Control Release. 2012; 158(2):182-193. DOI: 10.1016/j.jconrel.2011.09.083 PubMed: 21978644
8. O’Neil M. Resveratrol. In: O’Neil M, editor. The Merck Index- An Encyclopedia of Chemicals, Drugs, and Biologicals. Cambridge, UK: Royal Society of Chemistry; 2013. p. 1515.
4. Trela BC, Waterhouse AL. Resveratrol: Isomeric molar absorptivities and stability. J Agric Food Chem. 1996; 44(5):1253-1257. DOI: 10.1021/jf9504576
Production, Use, and Human Exposure
RES can be isolated from the leaves of white hellebore (Veratrum grandiflorum) and roots of Japanese knotweed (Polygonum cuspidatum), plants used in traditional medicine.9,10 In addition, RES is found in several foods, including grapes, peanuts, pistachios, itadori tea, and various berries.11-13 RES is also present in wine and is found at higher concentrations in red wine.10,14-17
9. Hanawa F, Tahara S, Mizutani J. Antifungal stress compounds from Veratrum grandiflorum leaves treated with cupric chloride. Phytochemistry. 1992; 31(9):3005-3007. DOI: 10.1016/0031-9422(92)83436-3
10. Frémont L. Biological effects of resveratrol. Life Sci. 2000; 66(8):663-673. DOI: 10.1016/S0024-3205(99)00410-5 PubMed: 10680575
11. Burns J, Yokota T, Ashihara H, Lean ME, Crozier A. Plant foods and herbal sources of resveratrol. J Agric Food Chem. 2002; 50(11):3337-3340. DOI: 10.1021/jf0112973 PubMed: 12010007
13. Shrikanta A, Kumar A, Govindaswamy V. Resveratrol content and antioxidant properties of underutilized fruits. J Food Sci Technol. 2015; 52(1):383-390. DOI: 10.1007/s13197-013-0993-z PubMed: 25593373
10. Frémont L. Biological effects of resveratrol. Life Sci. 2000; 66(8):663-673. DOI: 10.1016/S0024-3205(99)00410-5 PubMed: 10680575
14. Soleas GJ, Diamandis EP, Goldberg DM. Resveratrol: A molecule whose time has come? And gone? Clin Biochem. 1997; 30(2):91-113. DOI: 10.1016/S0009-9120(96)00155-5 PubMed: 9127691
17. Romero-Pérez AI, Lamuela-Raventós RM, Waterhouse AL, de la Torre-Boronat MC. Levels of cis- and trans-resveratrol and their glucosides in white and rosé Vitis vinifera wines from Spain. J Agric Food Chem. 1996; 44(8):2124-2128. DOI: 10.1021/jf9507654
RES can be commercially produced by isolating it from grape plants, which can be induced to produce greater quantities by applying aluminum chloride or aluminum sulfate to grape shoots and vines.18,19 Production of RES in harvested grapes increased twofold with irradiation by UVB light and threefold with irradiation by UVC light.20 RES can also be produced by treating cell suspension cultures of grapes with Onozuka R-10, a cellulase derived from the fungus Trichoderma viride.21 In addition, stilbene synthase genes have been isolated and inserted into plants, creating transgenic varieties of tobacco, grape, tomatoes, potatoes, rice, and alfalfa with higher RES concentrations.22-25 Lastly, RES can be synthesized from chemical precursors, as is the case with DSM Nutritional Products’ resVida.26
18. Adrian M, Jeandet P, Bessis R, Joubert JM. Induction of phytoalexin (resveratrol) synthesis in grapevine leaves treated with aluminum chloride (AlCl3). J Agric Food Chem. 1996; 44(8):1979-1981. DOI: 10.1021/jf950807o
19. Jeandet P, Bessis R, Adrian M, Yvin J, Joubert JM. inventors. Use of aluminum chloride as a resveratrol synthesis elicitor. United States patent 06080701; 2000
20. Cantos E, Garcia Viguera C, De Pascual Teresa S, Tomas Berberan FA. Effect of postharvest ultraviolet irradiation on resveratrol and other phenolics of cv. Napolean table grapes. J Agric Food Chem. 2000; 48(10):4606-4612. DOI: 10.1021/jf0002948 PubMed: 11052707
21. Calderón AA, Zapata JM, Muñoz R, Pedreño MA, Ros Barceló A. Resveratrol production as a part of the hypersensitive-like response of grapevine cells to an elicitor from Trichoderma viride. New Phytol. 1993; 124(3):455-463. DOI: 10.1111/j.1469-8137.1993.tb03836.x
22. Stark-Lorenzen P, Nelke B, Hänßler G, Mühlbach HP, Thomzik JE. Transfer of a grapevine stilbene synthase gene to rice (Oryza sativa L.). Plant Cell Rep. 1997; 16(10):668-673. DOI: 10.1007/s002990050299 PubMed: 30727616
25. Morelli R, Das S, Bertelli A, Bollini R, Lo Scalzo R, Das DK, Falchi M. The introduction of the stilbene synthase gene enhances the natural antiradical activity of Lycopersicon esculentum mill. Mol Cell Biochem. 2006; 282(1-2):65-73. DOI: 10.1007/s11010-006-1260-7 PubMed: 16317513
26. Edwards JA, Beck M, Riegger C, Bausch J. Safety of resveratrol with examples for high purity, trans-resveratrol, resVida®. Ann N Y Acad Sci. 2011; 1215(1):131-137. DOI: 10.1111/j.1749-6632.2010.05855.x PubMed: 21261651
Due to its low water solubility, RES bioavailability is low to moderate. Thus, formulations for increasing RES bioavailability have been developed, involving micro- and nanoparticle excipients, liposomes, and complexation with cyclic oligosaccharides.7 Research is ongoing to improve the bioavailability and bioefficacy (e.g., increased concentration at tissue-specific sites) of prodrugs for RES.27
7. Amri A, Chaumeil JC, Sfar S, Charrueau C. Administration of resveratrol: What formulation solutions to bioavailability limitations? J Control Release. 2012; 158(2):182-193. DOI: 10.1016/j.jconrel.2011.09.083 PubMed: 21978644
27. Biasutto L, Mattarei A, Azzolini M, La Spina M, Sassi N, Romio M, Paradisi C, Zoratti M. Resveratrol derivatives as a pharmacological tool. Ann N Y Acad Sci. 2017; 1403(1):27-37. DOI: 10.1111/nyas.13401 PubMed: 28675763
Traditional Asian medicine has long used RES from the root of P. cuspidatum as a tonic to treat hypertension and cardiovascular disease, among other uses.10,28,29 Primarily due to its antioxidant and anti-inflammatory effects observed in laboratory studies, RES has been marketed to treat and prevent a variety of diseases, improve glucose metabolism (e.g., beneficial effects on insulin sensitivity),30 provide neuro- and cardio-protection,31-33 enhance the immune system,34,35 protect against cancer,36 and prolong life.37
10. Frémont L. Biological effects of resveratrol. Life Sci. 2000; 66(8):663-673. DOI: 10.1016/S0024-3205(99)00410-5 PubMed: 10680575
28. Hendler SS, Rorvik D. Resveratrol. In: Hendler SS, Rorvik D, editors. PDR for Nutritional Supplements. Montvale, NJ: Medical Economics/Thomson Healthcare; 2001. p. 397–401.
29. Ramírez-Garza SL, Laveriano-Santos EP, Marhuenda-Muñoz M, Storniolo CE, Tresserra-Rimbau A, Vallverdú-Queralt A, Lamuela-Raventós RM. Health effects of resveratrol: Results from human intervention trials. Nutrients. 2018; 10(12):1892. DOI: 10.3390/nu10121892 PubMed: 30513922
30. Szkudelski T, Szkudelska K. Resveratrol and diabetes: From animal to human studies. Biochim Biophys Acta. 2015; 1852(6):1145-1154. DOI: 10.1016/j.bbadis.2014.10.013 PubMed: 25445538
31. Bonnefont-Rousselot D. Resveratrol and cardiovascular diseases. Nutrients. 2016; 8(5):250. DOI: 10.3390/nu8050250 PubMed: 27144581
33. Baur JA, Sinclair DA. Therapeutic potential of resveratrol: The in vivo evidence. Nat Rev Drug Discov. 2006; 5(6):493-506. DOI: 10.1038/nrd2060 PubMed: 16732220
34. Oliveira ALB, Monteiro VVS, Navegantes-Lima KC, Reis JF, Gomes RS, Rodrigues DVS, Gaspar SLF, Monteiro MC. Resveratrol role in autoimmune disease-A mini-review. Nutrients. 2017; 9(12). DOI: 10.3390/nu9121306 PubMed: 29194364
35. Malaguarnera L. Influence of resveratrol on the immune response. Nutrients. 2019; 11(5). DOI: 10.3390/nu11050946 PubMed: 31035454
36. Sinha D, Sarkar N, Biswas J, Bishayee A. Resveratrol for breast cancer prevention and therapy: Preclinical evidence and molecular mechanisms. Semin Cancer Biol. 2016; 40-41:209-232. DOI: 10.1016/j.semcancer.2015.11.001 PubMed: 26774195
37. Camins A, Junyent F, Verdaguer E, Beas-Zarate C, Rojas-Mayorquín AE, Ortuño-Sahagún D, Pallàs M. Resveratrol: An antiaging drug with potential therapeutic applications in treating diseases. Pharmaceuticals (Basel). 2009; 2(3):194-205. DOI: 10.3390/ph2030194 PubMed: 27713233
Human exposure to RES is mainly through ingestion, particularly of peanuts, grapes, and related products.38,39 In 2018, per capita wine consumption in the United States was 11.2 L or 2.95 gallons.40 The content of RES in wine depends on the variety of grape used and on the geographic region in which the grapes were grown. The average red wine contains 1.9 ± 1.7 mg/L RES,41 whereas the average white wine contains ≤0.02 mg/L.42
38. Sales JM, Resurreccion AV. Resveratrol in peanuts. Crit Rev Food Sci Nutr. 2014; 54(6):734-770. DOI: 10.1080/10408398.2011.606928 PubMed: 24345046
39. Farneti B, Masuero D, Costa F, Magnago P, Malnoy M, Costa G, Vrhovsek U, Mattivi F. Is there room for improving the nutraceutical composition of apple? J Agric Food Chem. 2015; 63(10):2750-2759. DOI: 10.1021/acs.jafc.5b00291 PubMed: 25723891
40. Wine Institute. US wine consumption. 2018. https://wineinstitute.org/our-industry/statistics/us-wine-consumption
41. Stervbo U, Vang O, Bonnesen C. A review of the content of the putative chemopreventative phytoalexin resveratrol in red wine. Food Chem. 2007; 101(2):449-457. DOI: 10.1016/j.foodchem.2006.01.047
42. McMurtrey KD, Minn J, Pobanz K, Schultz TP. Analysis of wines for resveratrol using direct injection high-pressure liquid chromatography with electrochemical detection. J Agric Food Chem. 1994; 42(10):2077-2080. DOI: 10.1021/jf00046a001
RES levels in peanuts and peanut products are lower than those in grape products and are summarized in a review by Sales and Resurreccion.38 In one study, RES concentrations were 0.06 μg/g (0.24 nmol/g) for roasted peanuts, 0.32 μg/g (1.42 nmol/g) for peanut butter, and 5.14 μg/g (22.51 nmol/g) for boiled peanuts.43 Hendler and Rorvik28 reported the levels of RES in peanuts to be 0.02–1.79 μg/g (0.09–7.84 nmol/g). Estimates of U.S. peanut consumption per capita annually from 2012 to 2018 range from 6.5 to 7.5 pounds, with peanut butter the primary product consumed.44
38. Sales JM, Resurreccion AV. Resveratrol in peanuts. Crit Rev Food Sci Nutr. 2014; 54(6):734-770. DOI: 10.1080/10408398.2011.606928 PubMed: 24345046
43. Sobolev VS, Cole RJ. Trans-resveratrol content in commercial peanuts and peanut products. J Agric Food Chem. 1999; 47(4):1435-1439. DOI: 10.1021/jf9809885 PubMed: 10563995
28. Hendler SS, Rorvik D. Resveratrol. In: Hendler SS, Rorvik D, editors. PDR for Nutritional Supplements. Montvale, NJ: Medical Economics/Thomson Healthcare; 2001. p. 397–401.
44. The Peanut Institute. History of peanuts, consumption, and affordability. https://peanut-institute.com/peanut-facts/history-of-peanuts-consumption-affordability/
Although dietary intake of total polyphenols has been documented in several studies, comprehensive estimations of RES consumption through diet are limited. One study involving the European Prospective Investigation into Cancer and Nutrition (Spain) cohort evaluated dietary intake of RES and its derivative, piceid.45 Using a compilation of studies on the amounts of trans- and cis-resveratrol in various foods, researchers estimated RES intake in the Spanish cohort to be 100 μg/day. Intake was highest in older men. The primary sources of RES were wine and grape juice (98.4% and 1.6%, respectively); peanuts, pistachios, and berries contributed <0.01%.45 Studies in other European cohorts have estimated RES intake through wine and grapes to be in the range of 0–200 μg/day.46-48 Estimates of RES intake via diet vary between populations and countries due to different food availability and food consumption patterns.
45. Zamora-Ros R, Andres-Lacueva C, Lamuela-Raventos RM, Berenguer T, Jakszyn P, Martinez C, Sanchez MJ, Navarro C, Chirlaque MD, Tormo MJ, et al. Concentrations of resveratrol and derivatives in foods and estimation of dietary intake in a Spanish population: European Prospective Investigation into Cancer and Nutrition (EPIC)-Spain cohort. Br J Nutr. 2008; 100(1):188-196. DOI: 10.1017/S0007114507882997 PubMed: 18096094
45. Zamora-Ros R, Andres-Lacueva C, Lamuela-Raventos RM, Berenguer T, Jakszyn P, Martinez C, Sanchez MJ, Navarro C, Chirlaque MD, Tormo MJ, et al. Concentrations of resveratrol and derivatives in foods and estimation of dietary intake in a Spanish population: European Prospective Investigation into Cancer and Nutrition (EPIC)-Spain cohort. Br J Nutr. 2008; 100(1):188-196. DOI: 10.1017/S0007114507882997 PubMed: 18096094
46. Lu Y, Zamora-Ros R, Chan S, Cross AJ, Ward H, Jakszyn P, Luben R, Opstelten JL, Oldenburg B, Hallmans G, et al. Dietary polyphenols in the aetiology of Crohn’s disease and ulcerative colitis-A multicenter European Prospective Cohort Study (EPIC). Inflamm Bowel Dis. 2017; 23(12):2072-2082. DOI: 10.1097/MIB.0000000000001108 PubMed: 28837515
48. Siedlinski M, Boer JM, Smit HA, Postma DS, Boezen HM. Dietary factors and lung function in the general population: Wine and resveratrol intake. Eur Respir J. 2012; 39(2):385-391. DOI: 10.1183/09031936.00184110 PubMed: 21852339
Oral exposure to RES also occurs via dietary supplements. For dietary supplements, amounts found in products and dosage recommendations vary. RES supplements can contain from 1 to 500 mg per tablet or capsule. Although the amount individuals in the general population are taking is unclear, up to 5 g per day has been observed to be safe in clinical trials49 and is a recommended upper limit reported on health websites.50,51 Due to its antioxidant and potential antiaging properties, RES is being formulated for dermal application through which more direct application to the target tissue is possible, potentially resulting in higher bioavailability.52,53 Thus, some dermal exposure to RES is possible.
49. Patel KR, Scott E, Brown VA, Gescher AJ, Steward WP, Brown K. Clinical trials of resveratrol. Ann N Y Acad Sci. 2011; 1215:161-169. DOI: 10.1111/j.1749-6632.2010.05853.x PubMed: 21261655
50. Web MD. Resveratrol supplements. https://www.webmd.com/heart-disease/resveratrol-supplements
51. Axe J. Resveratrol: The anti-aging powerhouse that’s good for the heart, brain and waistline. 2017. https://draxe.com/all-about-resveratrol/
52. Ratz-Łyko A, Arct J. Resveratrol as an active ingredient for cosmetic and dermatological applications: A review. J Cosmet Laser Ther. 2019; 21(2):84-90. DOI: 10.1080/14764172.2018.1469767 PubMed: 29737899
53. Ndiaye M, Philippe C, Mukhtar H, Ahmad N. The grape antioxidant resveratrol for skin disorders: Promise, prospects, and challenges. Arch Biochem Biophys. 2011; 508(2):164-170. DOI: 10.1016/j.abb.2010.12.030 PubMed: 21215251
Regulatory Status
RES available in dietary supplements is regulated under the U.S. Food, Drug, and Cosmetic Act. Manufacturers and distributors must notify the Food and Drug Administration when they plan to market dietary supplements that contain “new dietary ingredients” (Section 413b of the Act, 21 U.S.C. 350b).54
54. Code of Federal Regulations (CFR). 21(Section 190.6).
Absorption, Distribution, Metabolism, and Excretion
A number of animal studies and small clinical trials evaluating kinetics and metabolism of RES are available. They have been reviewed elsewhere,49,55,56 but overall findings are summarized here. Generally, RES is rapidly absorbed, highly metabolized in the liver and small intestine, and excreted through urine.
49. Patel KR, Scott E, Brown VA, Gescher AJ, Steward WP, Brown K. Clinical trials of resveratrol. Ann N Y Acad Sci. 2011; 1215:161-169. DOI: 10.1111/j.1749-6632.2010.05853.x PubMed: 21261655
55. Cottart CH, Nivet-Antoine V, Laguillier-Morizot C, Beaudeux JL. Resveratrol bioavailability and toxicity in humans. Mol Nutr Food Res. 2010; 54(1):7-16. DOI: 10.1002/mnfr.200900437 PubMed: 20013887
56. Gambini J, Ingles M, Olaso G, Lopez-Grueso R, Bonet-Costa V, Gimeno-Mallench L, Mas-Bargues C, Abdelaziz KM, Gomez-Cabrera MC, Vina J, et al. Properties of resveratrol: In vitro and in vivo studies about metabolism, bioavailability, and biological effects in animal models and humans. Oxid Med Cell Longev. 2015; 2015:837042. DOI: 10.1155/2015/837042 PubMed: 26221416
Experimental Animals
The disposition of RES has been studied primarily in rodents; one limited study was conducted in beagle dogs. In both cases, RES was rapidly absorbed following oral administration.
In male CD or Sprague Dawley rats given a single gavage dose of 50 or 150 mg RES/kg body weight (mg/kg), the time at which maximal plasma concentrations were reached (Tmax) was ≤1 hour.57,58 After repeated dosing (daily for 14 days) in the CD rats, the Tmax decreased to 0.25 hours in the 50 mg/kg/day group but increased to 2 hours in the 150 mg/kg/day group.57 The National Toxicology Program (NTP) previously investigated the toxicokinetic (TK) behavior of RES in male and female Sprague Dawley (Hsd:Sprague Dawley SD) rats (312.5, 625, or 1,250 mg/kg) and B6C3F1/N mice (625, 1,250, or 2,500 mg/kg) following a single intravenous or gavage administration.59 In both male and female rats and mice, Tmax was predicted by modeling to be ≤4.4 hours, with observed values ranging from 1.5 to 8 hours. Secondary peaks in the plasma concentration-time curves were observed, suggesting enterohepatic recirculation.59 The plasma elimination half-life in male and female rats for the two lower doses were 5.6–8.4 hours but increased to 17.7–22.1 hours in the 1,250 mg/kg/day dose group. In male and female mice, the elimination half-life ranged between 0.3 and 10.7 hours without any clear dose-related effect. Systemic exposure parameters maximum concentration (Cmax) and area under the concentration-time curve (AUC) increased linearly with the dose in both rats and mice. In general, the TK behavior of RES was similar between sexes.
57. Kapetanovic IM, Muzzio M, Huang Z, Thompson TN, McCormick DL. Pharmacokinetics, oral bioavailability, and metabolic profile of resveratrol and its dimethylether analog, pterostilbene, in rats. Cancer Chemother Pharmacol. 2011; 68(3):593-601. DOI: 10.1007/s00280-010-1525-4 PubMed: 21116625
58. Marier JF, Vachon P, Gritsas A, Zhang J, Moreau JP, Ducharme MP. Metabolism and disposition of resveratrol in rats: Extent of absorption, glucuronidation, and enterohepatic recirculation evidenced by a linked-rat model. J Pharmacol Exp Ther. 2002; 302(1):369-373. DOI: 10.1124/jpet.102.033340 PubMed: 12065739
57. Kapetanovic IM, Muzzio M, Huang Z, Thompson TN, McCormick DL. Pharmacokinetics, oral bioavailability, and metabolic profile of resveratrol and its dimethylether analog, pterostilbene, in rats. Cancer Chemother Pharmacol. 2011; 68(3):593-601. DOI: 10.1007/s00280-010-1525-4 PubMed: 21116625
59. Mutlu E, Gibbs ST, South N, Pierfelice J, Burback B, Germolec D, Waidyanatha S. Comparative toxicokinetics of Trans-resveratrol and its major metabolites in Harlan Sprague Dawley rats and B6C3F1/N mice following oral and intravenous administration. Toxicol Appl Pharmacol. 2020; 394:114962. DOI: 10.1016/j.taap.2020.114962 PubMed: 32205187
59. Mutlu E, Gibbs ST, South N, Pierfelice J, Burback B, Germolec D, Waidyanatha S. Comparative toxicokinetics of Trans-resveratrol and its major metabolites in Harlan Sprague Dawley rats and B6C3F1/N mice following oral and intravenous administration. Toxicol Appl Pharmacol. 2020; 394:114962. DOI: 10.1016/j.taap.2020.114962 PubMed: 32205187
The plasma elimination half-life found in previous NTP studies is similar to what has been reported in other studies. In male Wistar rats given red wine containing 6.5 mg/L of RES, the plasma elimination half-life was estimated to be 0.5 hours.60 Other studies in rats following oral administration of RES (50–150 mg/kg/day) report plasma elimination half-lives in the range of 1.8–11.8 hours.57,58 Unlike previous NTP studies in which the highest dose (i.e., 1,250 mg/kg) yielded longer half-lives in both mice and rats,59 Kapetanovic et al.57 reported that higher and repeated doses resulted in shorter half-lives. This discrepancy may be due to differences in doses used, 50–150 mg/kg/day versus 312.5–1,250 mg/kg/day.
60. Bertelli AA, Giovannini L, Stradi R, Bertelli A, Tillement JP. Plasma, urine and tissue levels of trans- and cis-resveratrol (3,4′,5-trihydroxystilbene) after short-term or prolonged administration of red wine to rats. Int J Tissue React. 1996; 18(2-3):67-71. PubMed: 9063768
57. Kapetanovic IM, Muzzio M, Huang Z, Thompson TN, McCormick DL. Pharmacokinetics, oral bioavailability, and metabolic profile of resveratrol and its dimethylether analog, pterostilbene, in rats. Cancer Chemother Pharmacol. 2011; 68(3):593-601. DOI: 10.1007/s00280-010-1525-4 PubMed: 21116625
58. Marier JF, Vachon P, Gritsas A, Zhang J, Moreau JP, Ducharme MP. Metabolism and disposition of resveratrol in rats: Extent of absorption, glucuronidation, and enterohepatic recirculation evidenced by a linked-rat model. J Pharmacol Exp Ther. 2002; 302(1):369-373. DOI: 10.1124/jpet.102.033340 PubMed: 12065739
59. Mutlu E, Gibbs ST, South N, Pierfelice J, Burback B, Germolec D, Waidyanatha S. Comparative toxicokinetics of Trans-resveratrol and its major metabolites in Harlan Sprague Dawley rats and B6C3F1/N mice following oral and intravenous administration. Toxicol Appl Pharmacol. 2020; 394:114962. DOI: 10.1016/j.taap.2020.114962 PubMed: 32205187
57. Kapetanovic IM, Muzzio M, Huang Z, Thompson TN, McCormick DL. Pharmacokinetics, oral bioavailability, and metabolic profile of resveratrol and its dimethylether analog, pterostilbene, in rats. Cancer Chemother Pharmacol. 2011; 68(3):593-601. DOI: 10.1007/s00280-010-1525-4 PubMed: 21116625
Although RES is rapidly absorbed by the gastrointestinal tract in rodents, oral bioavailability of RES is low to moderate. In previous NTP studies, the oral bioavailability estimated was higher in rats (~12%–31%) compared to mice (~3%–6%).59 Other studies also report low oral bioavailability ranging from 18% to 38%,57,58 due to extensive first pass metabolism in the intestine and liver. Gestational transfer of RES has been observed in both Japanese macaques exposed to 0.37% RES via the diet during pregnancy61 and rats following exposure to 4 g/kg RES via the diet from gestation day (GD) 7 to GD 21.62
59. Mutlu E, Gibbs ST, South N, Pierfelice J, Burback B, Germolec D, Waidyanatha S. Comparative toxicokinetics of Trans-resveratrol and its major metabolites in Harlan Sprague Dawley rats and B6C3F1/N mice following oral and intravenous administration. Toxicol Appl Pharmacol. 2020; 394:114962. DOI: 10.1016/j.taap.2020.114962 PubMed: 32205187
57. Kapetanovic IM, Muzzio M, Huang Z, Thompson TN, McCormick DL. Pharmacokinetics, oral bioavailability, and metabolic profile of resveratrol and its dimethylether analog, pterostilbene, in rats. Cancer Chemother Pharmacol. 2011; 68(3):593-601. DOI: 10.1007/s00280-010-1525-4 PubMed: 21116625
58. Marier JF, Vachon P, Gritsas A, Zhang J, Moreau JP, Ducharme MP. Metabolism and disposition of resveratrol in rats: Extent of absorption, glucuronidation, and enterohepatic recirculation evidenced by a linked-rat model. J Pharmacol Exp Ther. 2002; 302(1):369-373. DOI: 10.1124/jpet.102.033340 PubMed: 12065739
61. Roberts VH, Pound LD, Thorn SR, Gillingham MB, Thornburg KL, Friedman JE, Frias AE, Grove KL. Beneficial and cautionary outcomes of resveratrol supplementation in pregnant nonhuman primates. FASEB J. 2014; 28(6):2466-2477. DOI: 10.1096/fj.13-245472 PubMed: 24563374
62. Bourque SL, Dolinsky VW, Dyck JRB, Davidge ST. Maternal resveratrol treatment during pregnancy improves adverse fetal outcomes in a rat model of severe hypoxia. Placenta. 2012; 33(5):449-452. DOI: 10.1016/j.placenta.2012.01.012 PubMed: 22321195
RES undergoes extensive phase II metabolism in the liver of rodents, producing sulfate and glucuronide conjugates such as trans-resveratrol-3-O-B-D-glucuronide (trans-R3G), trans-resveratrol-4-O-glucuronide, trans-resveratrol-diglucuronide, trans-resveratrol-3-O-sulfate (trans-R3S), and cis-resveratrol-3,4′-disulfate.57,59,63-66 Concentrations of these metabolites, particularly trans-R3G and trans-R3S, are generally higher than the concentration of the parent compound. Resveratrol metabolites tend to have similar half-lives to the parent compound in rodents.57,59 Some studies reviewed in Detampel et al.67 suggest RES inhibits phase I metabolism and induces phase II metabolism, indicating the potential for RES-drug interactions.
57. Kapetanovic IM, Muzzio M, Huang Z, Thompson TN, McCormick DL. Pharmacokinetics, oral bioavailability, and metabolic profile of resveratrol and its dimethylether analog, pterostilbene, in rats. Cancer Chemother Pharmacol. 2011; 68(3):593-601. DOI: 10.1007/s00280-010-1525-4 PubMed: 21116625
59. Mutlu E, Gibbs ST, South N, Pierfelice J, Burback B, Germolec D, Waidyanatha S. Comparative toxicokinetics of Trans-resveratrol and its major metabolites in Harlan Sprague Dawley rats and B6C3F1/N mice following oral and intravenous administration. Toxicol Appl Pharmacol. 2020; 394:114962. DOI: 10.1016/j.taap.2020.114962 PubMed: 32205187
63. Menet MC, Baron S, Taghi M, Diestra R, Dargere D, Laprevote O, Nivet-Antoine V, Beaudeux JL, Bedarida T, Cottart CH. Distribution of trans-resveratrol and its metabolites after acute or sustained administration in mouse heart, brain, and liver. Mol Nutr Food Res. 2017; 61(8). DOI: 10.1002/mnfr.201600686 PubMed: 28160405
66. Andres-Lacueva C, Macarulla MT, Rotches-Ribalta M, Boto-Ordonez M, Urpi-Sarda M, Rodriguez VM, Portillo MP. Distribution of resveratrol metabolites in liver, adipose tissue, and skeletal muscle in rats fed different doses of this polyphenol. J Agric Food Chem. 2012; 60(19):4833-4840. DOI: 10.1021/jf3001108 PubMed: 22533982
57. Kapetanovic IM, Muzzio M, Huang Z, Thompson TN, McCormick DL. Pharmacokinetics, oral bioavailability, and metabolic profile of resveratrol and its dimethylether analog, pterostilbene, in rats. Cancer Chemother Pharmacol. 2011; 68(3):593-601. DOI: 10.1007/s00280-010-1525-4 PubMed: 21116625
59. Mutlu E, Gibbs ST, South N, Pierfelice J, Burback B, Germolec D, Waidyanatha S. Comparative toxicokinetics of Trans-resveratrol and its major metabolites in Harlan Sprague Dawley rats and B6C3F1/N mice following oral and intravenous administration. Toxicol Appl Pharmacol. 2020; 394:114962. DOI: 10.1016/j.taap.2020.114962 PubMed: 32205187
67. Detampel P, Beck M, Krähenbühl S, Huwyler J. Drug interaction potential of resveratrol. Drug Metab Rev. 2012; 44(3):253-265. DOI: 10.3109/03602532.2012.700715 PubMed: 22788578
RES and its metabolites are present in the systemic circulation and are distributed widely to a variety of tissues in rodents including heart, lung, liver, kidney, brain, and spleen.59,60,63,64,66,68,69 Dermal administration of RES yielded a similar distribution profile of RES in tissues to that seen with oral administration.70 Tissue concentrations of RES are highly dependent on the expression of glucuronidating and sulfating enzymes, which can be tissue-specific, but also on how much is transported into cells.71 Resveratrol sulfates may be hydrolyzed to regenerate the parent compound by sulfatases.71 Thus, the amount of RES in tissues, and likewise RES elimination and metabolism, is a function of a complex interplay between metabolism and transport mechanisms. Excretion of RES and its metabolites is primarily through renal elimination. Concentrations of RES-derived radioactivity 18 hours postgavage was highest in the urine (3.3%) followed by feces (1.6%).69
59. Mutlu E, Gibbs ST, South N, Pierfelice J, Burback B, Germolec D, Waidyanatha S. Comparative toxicokinetics of Trans-resveratrol and its major metabolites in Harlan Sprague Dawley rats and B6C3F1/N mice following oral and intravenous administration. Toxicol Appl Pharmacol. 2020; 394:114962. DOI: 10.1016/j.taap.2020.114962 PubMed: 32205187
60. Bertelli AA, Giovannini L, Stradi R, Bertelli A, Tillement JP. Plasma, urine and tissue levels of trans- and cis-resveratrol (3,4′,5-trihydroxystilbene) after short-term or prolonged administration of red wine to rats. Int J Tissue React. 1996; 18(2-3):67-71. PubMed: 9063768
63. Menet MC, Baron S, Taghi M, Diestra R, Dargere D, Laprevote O, Nivet-Antoine V, Beaudeux JL, Bedarida T, Cottart CH. Distribution of trans-resveratrol and its metabolites after acute or sustained administration in mouse heart, brain, and liver. Mol Nutr Food Res. 2017; 61(8). DOI: 10.1002/mnfr.201600686 PubMed: 28160405
64. Böhmdorfer M, Szakmary A, Schiestl RH, Vaquero J, Riha J, Brenner S, Thalhammer T, Szekeres T, Jäger W. Involvement of UDP-glucuronosyltransferases and sulfotransferases in the excretion and tissue distribution of resveratrol in mice. Nutrients. 2017; 9(12):1347. DOI: 10.3390/nu9121347 PubMed: 29231856
66. Andres-Lacueva C, Macarulla MT, Rotches-Ribalta M, Boto-Ordonez M, Urpi-Sarda M, Rodriguez VM, Portillo MP. Distribution of resveratrol metabolites in liver, adipose tissue, and skeletal muscle in rats fed different doses of this polyphenol. J Agric Food Chem. 2012; 60(19):4833-4840. DOI: 10.1021/jf3001108 PubMed: 22533982
68. Vitrac X, Desmouliere A, Brouillaud B, Krisa S, Deffieux G, Barthe N, Rosenbaum J, Merillon JM. Distribution of [14C]-trans-resveratrol, a cancer chemopreventive polyphenol, in mouse tissues after oral administration. Life Sci. 2003; 72(20):2219-2233. DOI: 10.1016/S0024-3205(03)00096-1 PubMed: 12628442
69. El-Mohsen MA, Bayele H, Kuhnle G, Gibson G, Debnam E, Kaila Srai S, Rice-Evans C, Spencer JP. Distribution of [3H]trans-resveratrol in rat tissues following oral administration. Br J Nutr. 2006; 96(1):62-70. DOI: 10.1079/BJN20061810 PubMed: 16869992
70. Murakami I, Chaleckis R, Pluskal T, Ito K, Hori K, Ebe M, Yanagida M, Kondoh H. Metabolism of skin-absorbed resveratrol into its glucuronized form in mouse skin. PLoS One. 2014; 9(12):e115359. DOI: 10.1371/journal.pone.0115359 PubMed: 25506824
71. Maier-Salamon A, Bohmdorfer M, Riha J, Thalhammer T, Szekeres T, Jaeger W. Interplay between metabolism and transport of resveratrol. Ann N Y Acad Sci. 2013; 1290:98-106. DOI: 10.1111/nyas.12198 PubMed: 23855471
71. Maier-Salamon A, Bohmdorfer M, Riha J, Thalhammer T, Szekeres T, Jaeger W. Interplay between metabolism and transport of resveratrol. Ann N Y Acad Sci. 2013; 1290:98-106. DOI: 10.1111/nyas.12198 PubMed: 23855471
69. El-Mohsen MA, Bayele H, Kuhnle G, Gibson G, Debnam E, Kaila Srai S, Rice-Evans C, Spencer JP. Distribution of [3H]trans-resveratrol in rat tissues following oral administration. Br J Nutr. 2006; 96(1):62-70. DOI: 10.1079/BJN20061810 PubMed: 16869992
In dogs following oral administration of 200, 600, or 1,200 mg/kg/day for 13 weeks, Tmax of RES and metabolites ranged from 1 to 7 hours, with no apparent differences by dose.72 As observed with rats,58,59 secondary peaks in the plasma concentration-time curves were observed in some dogs, suggesting enterohepatic recirculation.72 In dogs, the half-life of RES was 2–4 hours.72 RES sulfate had a longer half-life than the parent compound in dogs, although the study was limited.72
72. Muzzio M, Huang Z, Hu SC, Johnson WD, McCormick DL, Kapetanovic IM. Determination of resveratrol and its sulfate and glucuronide metabolites in plasma by LC-MS/MS and their pharmacokinetics in dogs. J Pharm Biomed Anal. 2012; 59:201-208. DOI: 10.1016/j.jpba.2011.10.023 PubMed: 22079044
58. Marier JF, Vachon P, Gritsas A, Zhang J, Moreau JP, Ducharme MP. Metabolism and disposition of resveratrol in rats: Extent of absorption, glucuronidation, and enterohepatic recirculation evidenced by a linked-rat model. J Pharmacol Exp Ther. 2002; 302(1):369-373. DOI: 10.1124/jpet.102.033340 PubMed: 12065739
59. Mutlu E, Gibbs ST, South N, Pierfelice J, Burback B, Germolec D, Waidyanatha S. Comparative toxicokinetics of Trans-resveratrol and its major metabolites in Harlan Sprague Dawley rats and B6C3F1/N mice following oral and intravenous administration. Toxicol Appl Pharmacol. 2020; 394:114962. DOI: 10.1016/j.taap.2020.114962 PubMed: 32205187
72. Muzzio M, Huang Z, Hu SC, Johnson WD, McCormick DL, Kapetanovic IM. Determination of resveratrol and its sulfate and glucuronide metabolites in plasma by LC-MS/MS and their pharmacokinetics in dogs. J Pharm Biomed Anal. 2012; 59:201-208. DOI: 10.1016/j.jpba.2011.10.023 PubMed: 22079044
72. Muzzio M, Huang Z, Hu SC, Johnson WD, McCormick DL, Kapetanovic IM. Determination of resveratrol and its sulfate and glucuronide metabolites in plasma by LC-MS/MS and their pharmacokinetics in dogs. J Pharm Biomed Anal. 2012; 59:201-208. DOI: 10.1016/j.jpba.2011.10.023 PubMed: 22079044
72. Muzzio M, Huang Z, Hu SC, Johnson WD, McCormick DL, Kapetanovic IM. Determination of resveratrol and its sulfate and glucuronide metabolites in plasma by LC-MS/MS and their pharmacokinetics in dogs. J Pharm Biomed Anal. 2012; 59:201-208. DOI: 10.1016/j.jpba.2011.10.023 PubMed: 22079044
Humans
Studies in humans have found rapid absorption of orally administered RES. Absorption of 25 mg radiolabeled RES was 70%, with a plasma Tmax reached in about 1 hour.73 Studies of single or repeated administration of 0.5–5 mg RES also reported rapid absorption of RES, with Tmax in the range of 1–1.5 hours.74,75 As in rodents, enterohepatic recirculation has been observed 5–6 hours after dosing.73,74 In a study evaluating single and repeat dosing of 200 mg RES, Tmax did not change with repeated dosing and the degree of accumulation was moderate with accumulation ratios (AUC of repeated dose to AUC of single dose) ranging from 1.44 to 2.09.76 In both studies, as in rats, bioavailability was low (<1%), likely due to the extensive metabolism of RES in the liver and intestine.77 Some studies have investigated how the bioavailability of RES changes depending on how it is consumed: as a pure compound, in grape juice or wine, or with certain foods.78,79 For instance, high lipid-content foods were found to decrease the bioavailability of a 2 g dose of RES,80 although this finding was not confirmed in another study evaluating RES consumed through red wine.81
73. Walle T, Hsieh F, DeLegge MH, Oatis JE Jr, Walle UK. High absorption but very low bioavailability of oral resveratrol in humans. Drug Metab Dispos. 2004; 32(12):1377-1382. DOI: 10.1124/dmd.104.000885 PubMed: 15333514
74. Boocock DJ, Faust GE, Patel KR, Schinas AM, Brown VA, Ducharme MP, Booth TD, Crowell JA, Perloff M, Gescher AJ, et al. Phase I dose escalation pharmacokinetic study in healthy volunteers of resveratrol, a potential cancer chemopreventive agent. Cancer Epidemiol Biomarkers Prev. 2007; 16(6):1246-1252. DOI: 10.1158/1055-9965.EPI-07-0022 PubMed: 17548692
75. Brown VA, Patel KR, Viskaduraki M, Crowell JA, Perloff M, Booth TD, Vasilinin G, Sen A, Schinas AM, Piccirilli G, et al. Repeat dose study of the cancer chemopreventive agent resveratrol in healthy volunteers: Safety, pharmacokinetics, and effect on the insulin-like growth factor axis. Cancer Res. 2010; 70(22):9003-9011. DOI: 10.1158/0008-5472.CAN-10-2364 PubMed: 20935227
73. Walle T, Hsieh F, DeLegge MH, Oatis JE Jr, Walle UK. High absorption but very low bioavailability of oral resveratrol in humans. Drug Metab Dispos. 2004; 32(12):1377-1382. DOI: 10.1124/dmd.104.000885 PubMed: 15333514
74. Boocock DJ, Faust GE, Patel KR, Schinas AM, Brown VA, Ducharme MP, Booth TD, Crowell JA, Perloff M, Gescher AJ, et al. Phase I dose escalation pharmacokinetic study in healthy volunteers of resveratrol, a potential cancer chemopreventive agent. Cancer Epidemiol Biomarkers Prev. 2007; 16(6):1246-1252. DOI: 10.1158/1055-9965.EPI-07-0022 PubMed: 17548692
76. Nunes T, Almeida L, Rocha JF, Falcao A, Fernandes-Lopes C, Loureiro AI, Wright L, Vaz-da-Silva M, Soares-da-Silva P. Pharmacokinetics of trans-resveratrol following repeated administration in healthy elderly and young subjects. J Clin Pharmacol. 2009; 49(12):1477-1482. DOI: 10.1177/0091270009339191 PubMed: 19797536
77. Bode LM, Bunzel D, Huch M, Cho GS, Ruhland D, Bunzel M, Bub A, Franz CM, Kulling SE. In vivo and in vitro metabolism of trans-resveratrol by human gut microbiota. Am J Clin Nutr. 2013; 97(2):295-309. DOI: 10.3945/ajcn.112.049379 PubMed: 23283496
78. Goldberg DM, Yan J, Soleas GJ. Absorption of three wine-related polyphenols in three different matrices by healthy subjects. Clin Biochem. 2003; 36(1):79-87. DOI: 10.1016/S0009-9120(02)00397-1 PubMed: 12554065
79. Meng X, Maliakal P, Lu H, Lee MJ, Yang CS. Urinary and plasma levels of resveratrol and quercetin in humans, mice, and rats after ingestion of pure compounds and grape juice. J Agric Food Chem. 2004; 52(4):935-942. DOI: 10.1021/jf030582e PubMed: 14969553
80. la Porte C, Voduc N, Zhang G, Seguin I, Tardiff D, Singhal N, Cameron DW. Steady-state pharmacokinetics and tolerability of trans-resveratrol 2000 mg twice daily with food, quercetin and alcohol (ethanol) in healthy human subjects. Clin Pharmacokinet. 2010; 49(7):449-454. DOI: 10.2165/11531820-000000000-00000 PubMed: 20528005
81. Vitaglione P, Sforza S, Galaverna G, Ghidini C, Caporaso N, Vescovi PP, Fogliano V, Marchelli R. Bioavailability of trans-resveratrol from red wine in humans. Mol Nutr Food Res. 2005; 49(5):495-504. DOI: 10.1002/mnfr.200500002 PubMed: 15830336
Metabolism of RES in humans also is extensive, producing sulfate and glucuronic acid conjugates similar to those found in rodents, although at different proportions.74,75,79,82,83 In humans, sulfate conjugates are more prominent,55 while in rodents glucuronide conjugates are more common.55,59 Additionally, resveratrol-4′-O-glucuronide has been measured in human plasma after dosing, but much less is found in rodent plasma and tissues. A comparative study of glucuronidation in human, dog, rat, and mouse liver microsomes found higher rates of glucuronidation and higher production of resveratrol-3-O-glucuronide and insignificant formation of resveratraol-4-O-glucuronide in rodent microsomes compared to human and dog microsomes after incubation with 100 µM RES.71 Lastly, differences in microbiota or anatomical differences in the intestine may lead to variations in microbially derived RES metabolites.63
74. Boocock DJ, Faust GE, Patel KR, Schinas AM, Brown VA, Ducharme MP, Booth TD, Crowell JA, Perloff M, Gescher AJ, et al. Phase I dose escalation pharmacokinetic study in healthy volunteers of resveratrol, a potential cancer chemopreventive agent. Cancer Epidemiol Biomarkers Prev. 2007; 16(6):1246-1252. DOI: 10.1158/1055-9965.EPI-07-0022 PubMed: 17548692
75. Brown VA, Patel KR, Viskaduraki M, Crowell JA, Perloff M, Booth TD, Vasilinin G, Sen A, Schinas AM, Piccirilli G, et al. Repeat dose study of the cancer chemopreventive agent resveratrol in healthy volunteers: Safety, pharmacokinetics, and effect on the insulin-like growth factor axis. Cancer Res. 2010; 70(22):9003-9011. DOI: 10.1158/0008-5472.CAN-10-2364 PubMed: 20935227
79. Meng X, Maliakal P, Lu H, Lee MJ, Yang CS. Urinary and plasma levels of resveratrol and quercetin in humans, mice, and rats after ingestion of pure compounds and grape juice. J Agric Food Chem. 2004; 52(4):935-942. DOI: 10.1021/jf030582e PubMed: 14969553
82. Aumont V, Krisa S, Battaglia E, Netter P, Richard T, Merillon JM, Magdalou J, Sabolovic N. Regioselective and stereospecific glucuronidation of trans- and cis-resveratrol in human. Arch Biochem Biophys. 2001; 393(2):281-289. DOI: 10.1006/abbi.2001.2496 PubMed: 11556815
83. Patel KR, Brown VA, Jones DJ, Britton RG, Hemingway D, Miller AS, West KP, Booth TD, Perloff M, Crowell JA, et al. Clinical pharmacology of resveratrol and its metabolites in colorectal cancer patients. Cancer Res. 2010; 70(19):7392-7399. DOI: 10.1158/0008-5472.CAN-10-2027 PubMed: 20841478
55. Cottart CH, Nivet-Antoine V, Laguillier-Morizot C, Beaudeux JL. Resveratrol bioavailability and toxicity in humans. Mol Nutr Food Res. 2010; 54(1):7-16. DOI: 10.1002/mnfr.200900437 PubMed: 20013887
55. Cottart CH, Nivet-Antoine V, Laguillier-Morizot C, Beaudeux JL. Resveratrol bioavailability and toxicity in humans. Mol Nutr Food Res. 2010; 54(1):7-16. DOI: 10.1002/mnfr.200900437 PubMed: 20013887
59. Mutlu E, Gibbs ST, South N, Pierfelice J, Burback B, Germolec D, Waidyanatha S. Comparative toxicokinetics of Trans-resveratrol and its major metabolites in Harlan Sprague Dawley rats and B6C3F1/N mice following oral and intravenous administration. Toxicol Appl Pharmacol. 2020; 394:114962. DOI: 10.1016/j.taap.2020.114962 PubMed: 32205187
71. Maier-Salamon A, Bohmdorfer M, Riha J, Thalhammer T, Szekeres T, Jaeger W. Interplay between metabolism and transport of resveratrol. Ann N Y Acad Sci. 2013; 1290:98-106. DOI: 10.1111/nyas.12198 PubMed: 23855471
63. Menet MC, Baron S, Taghi M, Diestra R, Dargere D, Laprevote O, Nivet-Antoine V, Beaudeux JL, Bedarida T, Cottart CH. Distribution of trans-resveratrol and its metabolites after acute or sustained administration in mouse heart, brain, and liver. Mol Nutr Food Res. 2017; 61(8). DOI: 10.1002/mnfr.201600686 PubMed: 28160405
Data on the tissue distribution of RES and its metabolites in humans are limited. One study reported RES and metabolites (resveratrol-3-O-glucuronide, resveratrol-4′-O-glucuronide, resveratrol-3-O-sulfate, resveratrol-4′-O-sulfate, resveratrol disulfate, and resveratrol sulfate glucuronide) in samples of normal and neoplastic colon tissue in colorectal cancer patients who consumed 500–1,000 mg RES per day for 8 days.83 While mean RES concentrations in neoplastic colon tissues from patients given 1,000 mg for 8 days were 94 nmol per gram,83 mean concentrations of RES in hepatic metastases from colorectal cancer patients on a similar RES treatment regimen (5 g per day for 10–21 days) were much lower (4.8 nmol per gram).84
83. Patel KR, Brown VA, Jones DJ, Britton RG, Hemingway D, Miller AS, West KP, Booth TD, Perloff M, Crowell JA, et al. Clinical pharmacology of resveratrol and its metabolites in colorectal cancer patients. Cancer Res. 2010; 70(19):7392-7399. DOI: 10.1158/0008-5472.CAN-10-2027 PubMed: 20841478
83. Patel KR, Brown VA, Jones DJ, Britton RG, Hemingway D, Miller AS, West KP, Booth TD, Perloff M, Crowell JA, et al. Clinical pharmacology of resveratrol and its metabolites in colorectal cancer patients. Cancer Res. 2010; 70(19):7392-7399. DOI: 10.1158/0008-5472.CAN-10-2027 PubMed: 20841478
84. Howells LM, Berry DP, Elliott PJ, Jacobson EW, Hoffmann E, Hegarty B, Brown K, Steward WP, Gescher AJ. Phase I randomized, double-blind pilot study of micronized resveratrol (SRT501) in patients with hepatic metastases—safety, pharmacokinetics, and pharmacodynamics. Cancer Prev Res (Phila). 2011; 4(9):1419-1425. DOI: 10.1158/1940-6207.CAPR-11-0148 PubMed: 21680702
Similar to what has been observed in animals, the plasma half-life of RES in humans ranges from 1 to 11 hours with minimal dose dependence.74-76,84 In a small study of elderly and young male and female participants (n = 6 per age group) given 200 mg RES once on the first day and then three times daily for 3 more days, the half-life of RES ranged from 2.5 to 4.7 hours.76 No significant differences in half-life were observed due to age, sex, or dosing frequency.76 Other human studies found the half-life of RES to be 2–9 hours, with differences varying with increasing dose (0.5 to 5 mg RES) or dose frequency (single versus repeated dose for 28 days).74,75 In those studies, RES metabolites in plasma tended to be similar to those of the parent compound.74,75
74. Boocock DJ, Faust GE, Patel KR, Schinas AM, Brown VA, Ducharme MP, Booth TD, Crowell JA, Perloff M, Gescher AJ, et al. Phase I dose escalation pharmacokinetic study in healthy volunteers of resveratrol, a potential cancer chemopreventive agent. Cancer Epidemiol Biomarkers Prev. 2007; 16(6):1246-1252. DOI: 10.1158/1055-9965.EPI-07-0022 PubMed: 17548692
76. Nunes T, Almeida L, Rocha JF, Falcao A, Fernandes-Lopes C, Loureiro AI, Wright L, Vaz-da-Silva M, Soares-da-Silva P. Pharmacokinetics of trans-resveratrol following repeated administration in healthy elderly and young subjects. J Clin Pharmacol. 2009; 49(12):1477-1482. DOI: 10.1177/0091270009339191 PubMed: 19797536
84. Howells LM, Berry DP, Elliott PJ, Jacobson EW, Hoffmann E, Hegarty B, Brown K, Steward WP, Gescher AJ. Phase I randomized, double-blind pilot study of micronized resveratrol (SRT501) in patients with hepatic metastases—safety, pharmacokinetics, and pharmacodynamics. Cancer Prev Res (Phila). 2011; 4(9):1419-1425. DOI: 10.1158/1940-6207.CAPR-11-0148 PubMed: 21680702
76. Nunes T, Almeida L, Rocha JF, Falcao A, Fernandes-Lopes C, Loureiro AI, Wright L, Vaz-da-Silva M, Soares-da-Silva P. Pharmacokinetics of trans-resveratrol following repeated administration in healthy elderly and young subjects. J Clin Pharmacol. 2009; 49(12):1477-1482. DOI: 10.1177/0091270009339191 PubMed: 19797536
76. Nunes T, Almeida L, Rocha JF, Falcao A, Fernandes-Lopes C, Loureiro AI, Wright L, Vaz-da-Silva M, Soares-da-Silva P. Pharmacokinetics of trans-resveratrol following repeated administration in healthy elderly and young subjects. J Clin Pharmacol. 2009; 49(12):1477-1482. DOI: 10.1177/0091270009339191 PubMed: 19797536
74. Boocock DJ, Faust GE, Patel KR, Schinas AM, Brown VA, Ducharme MP, Booth TD, Crowell JA, Perloff M, Gescher AJ, et al. Phase I dose escalation pharmacokinetic study in healthy volunteers of resveratrol, a potential cancer chemopreventive agent. Cancer Epidemiol Biomarkers Prev. 2007; 16(6):1246-1252. DOI: 10.1158/1055-9965.EPI-07-0022 PubMed: 17548692
75. Brown VA, Patel KR, Viskaduraki M, Crowell JA, Perloff M, Booth TD, Vasilinin G, Sen A, Schinas AM, Piccirilli G, et al. Repeat dose study of the cancer chemopreventive agent resveratrol in healthy volunteers: Safety, pharmacokinetics, and effect on the insulin-like growth factor axis. Cancer Res. 2010; 70(22):9003-9011. DOI: 10.1158/0008-5472.CAN-10-2364 PubMed: 20935227
74. Boocock DJ, Faust GE, Patel KR, Schinas AM, Brown VA, Ducharme MP, Booth TD, Crowell JA, Perloff M, Gescher AJ, et al. Phase I dose escalation pharmacokinetic study in healthy volunteers of resveratrol, a potential cancer chemopreventive agent. Cancer Epidemiol Biomarkers Prev. 2007; 16(6):1246-1252. DOI: 10.1158/1055-9965.EPI-07-0022 PubMed: 17548692
75. Brown VA, Patel KR, Viskaduraki M, Crowell JA, Perloff M, Booth TD, Vasilinin G, Sen A, Schinas AM, Piccirilli G, et al. Repeat dose study of the cancer chemopreventive agent resveratrol in healthy volunteers: Safety, pharmacokinetics, and effect on the insulin-like growth factor axis. Cancer Res. 2010; 70(22):9003-9011. DOI: 10.1158/0008-5472.CAN-10-2364 PubMed: 20935227
As in experimental animals, RES and its metabolites are rapidly excreted in humans, primarily through the urine. Following a single oral dose of 0.5–5 g to healthy volunteers, 77% of the urinary metabolites of RES were recovered within 4 hours after dosing.74 In that study, fecal concentrations of RES metabolites were less than that of RES, which is consistent with enterohepatic recirculation.74
74. Boocock DJ, Faust GE, Patel KR, Schinas AM, Brown VA, Ducharme MP, Booth TD, Crowell JA, Perloff M, Gescher AJ, et al. Phase I dose escalation pharmacokinetic study in healthy volunteers of resveratrol, a potential cancer chemopreventive agent. Cancer Epidemiol Biomarkers Prev. 2007; 16(6):1246-1252. DOI: 10.1158/1055-9965.EPI-07-0022 PubMed: 17548692
74. Boocock DJ, Faust GE, Patel KR, Schinas AM, Brown VA, Ducharme MP, Booth TD, Crowell JA, Perloff M, Gescher AJ, et al. Phase I dose escalation pharmacokinetic study in healthy volunteers of resveratrol, a potential cancer chemopreventive agent. Cancer Epidemiol Biomarkers Prev. 2007; 16(6):1246-1252. DOI: 10.1158/1055-9965.EPI-07-0022 PubMed: 17548692
Toxicity
Experimental Animals
Animal studies show minimal toxicity associated with oral RES administration. A 28-day study in Wistar Han rats given RES via diet (0, 50, 150, 500 mg/kg/day) showed no exposure-related effects on body weight, clinical signs, hematology, clinical chemistry, or histopathology at any exposure concentration.85 Another 28-day study in CD Virus Antibody Free (VAF) rats given ≤3,000 mg/kg/day found slight hemolytic anemia in male rats, with no histological correlate, which resolved after a 4-week recovery period.86,87 A 90-day study in Wistar Han rats established a no-observed-adverse-effect level (NOAEL) of 750 mg/kg/day.85 In CD (Crl:CD[SD]IGS) rats given 200, 400, or 1,000 mg/kg/day via gavage for 90 days, the middle and high female dose groups had significantly decreased mean body weight gains relative to the vehicle control group; no body weight changes were observed in males.88 Additionally, there were significant increases in bilirubin at the high dose and hepatomegaly at the middle and high doses in both sexes. No dose-related changes in hematology, clinical chemistry, coagulation parameters, other organ weights, or histopathology were observed. Oral dosing in rats for 6 months resulted in decreased body weights and discolored feces at the highest dose (2,000 mg/kg/day); the NOAEL in this and other studies was 300 mg/kg/day.86,87 Additional studies have reported even higher NOAELs (e.g., 1,000 mg/kg/day).89 At higher doses (>2,000 mg/kg/day), nephrotoxicity has been observed in male and female CD VAF rats.86
85. Williams LD, Burdock GA, Edwards JA, Beck M, Bausch J. Safety studies conducted on high-purity trans-resveratrol in experimental animals. Food Chem Toxicol. 2009; 47(9):2170-2182. DOI: 10.1016/j.fct.2009.06.002 PubMed: 19505523
86. Crowell JA, Korytko PJ, Morrissey RL, Booth TD, Levine BS. Resveratrol-associated renal toxicity. Toxicol Sci. 2004; 82(2):614-619. DOI: 10.1093/toxsci/kfh263 PubMed: 15329443
87. Elliott PJ, Walpole S, Morelli L, Lambert PD, Lunsmann W, Westphal CH, Lavu S. Resveratrol/SRT-501. Drugs Future. 2009; 34(4):291. DOI: 10.1358/dof.2009.034.04.1360696
85. Williams LD, Burdock GA, Edwards JA, Beck M, Bausch J. Safety studies conducted on high-purity trans-resveratrol in experimental animals. Food Chem Toxicol. 2009; 47(9):2170-2182. DOI: 10.1016/j.fct.2009.06.002 PubMed: 19505523
88. Johnson WD, Morrissey RL, Usborne AL, Kapetanovic I, Crowell JA, Muzzio M, McCormick DL. Subchronic oral toxicity and cardiovascular safety pharmacology studies of resveratrol, a naturally occurring polyphenol with cancer preventive activity. Food Chem Toxicol. 2011; 49(12):3319-3327. DOI: 10.1016/j.fct.2011.08.023 PubMed: 21939727
86. Crowell JA, Korytko PJ, Morrissey RL, Booth TD, Levine BS. Resveratrol-associated renal toxicity. Toxicol Sci. 2004; 82(2):614-619. DOI: 10.1093/toxsci/kfh263 PubMed: 15329443
87. Elliott PJ, Walpole S, Morelli L, Lambert PD, Lunsmann W, Westphal CH, Lavu S. Resveratrol/SRT-501. Drugs Future. 2009; 34(4):291. DOI: 10.1358/dof.2009.034.04.1360696
89. Horn TL, Cwik MJ, Morrissey RL, Kapetanovic I, Crowell JA, Booth TD, McCormick DL. Oncogenicity evaluation of resveratrol in p53(+/-) (p53 knockout) mice. Food Chem Toxicol. 2007; 45(1):55-63. DOI: 10.1016/j.fct.2006.07.015 PubMed: 16965847
86. Crowell JA, Korytko PJ, Morrissey RL, Booth TD, Levine BS. Resveratrol-associated renal toxicity. Toxicol Sci. 2004; 82(2):614-619. DOI: 10.1093/toxsci/kfh263 PubMed: 15329443
In male and female dogs, RES-related effects involved only abnormally colored feces during dosing; there were no dose-related changes in body weight, organ weight, or histopathological evaluations or any cardiotoxic effects.87 The NOAEL in dogs was 300 mg/kg/day. A separate 90-day oral toxicity study in dogs demonstrated no dose‐related mortality, clinical signs of toxicity, or gross pathology at 200, 600, or 1,200 mg/kg/day.88 However, body weights for both male and female dogs were significantly decreased at the highest dose, which was associated with decreased feed consumption. For this reason, the NOAEL for RES in dogs was 600 mg/kg/day.88 RES did not cause skin or eye irritation in male and female New Zealand white rabbits.85
87. Elliott PJ, Walpole S, Morelli L, Lambert PD, Lunsmann W, Westphal CH, Lavu S. Resveratrol/SRT-501. Drugs Future. 2009; 34(4):291. DOI: 10.1358/dof.2009.034.04.1360696
88. Johnson WD, Morrissey RL, Usborne AL, Kapetanovic I, Crowell JA, Muzzio M, McCormick DL. Subchronic oral toxicity and cardiovascular safety pharmacology studies of resveratrol, a naturally occurring polyphenol with cancer preventive activity. Food Chem Toxicol. 2011; 49(12):3319-3327. DOI: 10.1016/j.fct.2011.08.023 PubMed: 21939727
88. Johnson WD, Morrissey RL, Usborne AL, Kapetanovic I, Crowell JA, Muzzio M, McCormick DL. Subchronic oral toxicity and cardiovascular safety pharmacology studies of resveratrol, a naturally occurring polyphenol with cancer preventive activity. Food Chem Toxicol. 2011; 49(12):3319-3327. DOI: 10.1016/j.fct.2011.08.023 PubMed: 21939727
85. Williams LD, Burdock GA, Edwards JA, Beck M, Bausch J. Safety studies conducted on high-purity trans-resveratrol in experimental animals. Food Chem Toxicol. 2009; 47(9):2170-2182. DOI: 10.1016/j.fct.2009.06.002 PubMed: 19505523
Humans
In humans, RES appears to be generally well tolerated. Clinical trials with low doses of RES show no adverse effects. At higher doses (≥0.5 g/day), the most common adverse effects were gastrointestinal (abdominal pain, nausea, flatulence, diarrhea).75,90,91
75. Brown VA, Patel KR, Viskaduraki M, Crowell JA, Perloff M, Booth TD, Vasilinin G, Sen A, Schinas AM, Piccirilli G, et al. Repeat dose study of the cancer chemopreventive agent resveratrol in healthy volunteers: Safety, pharmacokinetics, and effect on the insulin-like growth factor axis. Cancer Res. 2010; 70(22):9003-9011. DOI: 10.1158/0008-5472.CAN-10-2364 PubMed: 20935227
90. Chow HHS, Garland LL, Hsu C-H, Vining DR, Chew WM, Miller JA, Perloff M, Crowell JA, Alberts DS. Resveratrol modulates drug- and carcinogen-metabolizing enzymes in a healthy volunteer study. Cancer Prev Res (Phila). 2010; 3(9):1168-1175. DOI: 10.1158/1940-6207.CAPR-09-0155 PubMed: 20716633
91. Cottart CH, Nivet-Antoine V, Beaudeux JL. Review of recent data on the metabolism, biological effects, and toxicity of resveratrol in humans. Mol Nutr Food Res. 2014; 58(1):7-21. DOI: 10.1002/mnfr.201200589 PubMed: 23740855
Reproductive and Developmental Toxicity
Experimental Animals
A limited number of studies have evaluated the effects of RES exposure in utero and its potential reproductive toxicity. In developing chick embryos of white Leghorns, RES (1, 10, 25, 50, or 100 μg/disk [0.004, 0.044, 0.11, 0.22, or 0.438 μmol/disk] incubated for 48–72 hours) induced avascular zones in the developing chorioallantoic membrane.92 RES did not elicit any effects on implantation number, resorptions, live young, or pre- and postimplantation losses in pregnant Sprague Dawley rats consuming 0, 120, 300, or 750 mg RES/kg/day in the diet from gestation day (GD) 5 through 20.85 Furthermore, uterine, placental, litter, and fetal weights were similar and there were no fetal abnormalities. Thus, the NOAEL for maternal toxicity and embryofetal development in Sprague Dawley rats in this study was the highest dose tested, 750 mg/kg/day. Another reproductive toxicity study was conducted in rats administered 300, 1,000, or 3,000 mg/kg/day via oral gavage from GD 7 through GD 17. While some (5 out of 25) dams were euthanized due to adverse clinical conditions, there were no effects on the fetuses at any dose. The maternal NOAEL was 300 mg/kg/day and the developmental NOAEL was 1,000 mg/kg/day.87 A study in CD-1 (ICR) mice exposed to concentrations of RES similar to concentrations found in wine (3 mg/L in water) also found no effect on litter size or sex ratio.93 RES has been reported, however, to impair morphogenesis in the P19C5 embryoid body murine morphogenesis assay via changes in Wnt3a, Tbx6, and Cyp26a1 gene expression.94
92. Brâkenhielm E, Cao R, Cao Y. Suppression of angiogenesis, tumor growth, and wound healing by resveratrol, a natural compound in red wine and grapes. FASEB J. 2001; 15(10):1798-1800. DOI: 10.1096/fj.01-0028fje PubMed: 11481234
85. Williams LD, Burdock GA, Edwards JA, Beck M, Bausch J. Safety studies conducted on high-purity trans-resveratrol in experimental animals. Food Chem Toxicol. 2009; 47(9):2170-2182. DOI: 10.1016/j.fct.2009.06.002 PubMed: 19505523
87. Elliott PJ, Walpole S, Morelli L, Lambert PD, Lunsmann W, Westphal CH, Lavu S. Resveratrol/SRT-501. Drugs Future. 2009; 34(4):291. DOI: 10.1358/dof.2009.034.04.1360696
93. Kyselova V, Peknicova J, Buckiova D, Boubelik M. Effects of p-nonylphenol and resveratrol on body and organ weight and in vivo fertility of outbred CD-1 mice. Reprod Biol Endocrinol. 2003; 1:30. DOI: 10.1186/1477-7827-1-30 PubMed: 12749770
94. Kim IQ, Marikawa Y. Embryoid body test with morphological and molecular endpoints implicates potential developmental toxicity of trans-resveratrol. Toxicol Appl Pharmacol. 2018; 355:211-225. DOI: 10.1016/j.taap.2018.07.006 PubMed: 29990529
The effects of RES on reproductive organs are varied. In one study, Sprague Dawley rats exposed to 120, 300, or 750 mg/kg/day via the diet for 90 days did not show changes in sperm count and quality, ovarian morphology, estrous cycling, or reproductive organ histopathology.85 In CD-1 (ICR) mice, there was no effect of exposure to drinking water containing 3 mg/L RES for 90 days on body weight, sperm count, sperm morphology, or ovary morphology but there was a decrease in seminal vesicle and ovary weight compared to control animals.93 On the other hand, administration of 20 mg/kg/day via gavage for 90 days in Sprague Dawley rats resulted in reduced diameter of seminiferous tubules, increased density of seminiferous tubules, and increased sperm count and plasma concentrations of luteinizing hormone, follicle stimulating hormone, and testosterone.95 RES has been reported to bind to estrogen receptor (ER)α and ERβ with similar affinity, and is mitogenic in ERα and β transfected CHO-K1 cells, and the ER positive (ER+) cell lines MCF-7 and T47T.96,97
85. Williams LD, Burdock GA, Edwards JA, Beck M, Bausch J. Safety studies conducted on high-purity trans-resveratrol in experimental animals. Food Chem Toxicol. 2009; 47(9):2170-2182. DOI: 10.1016/j.fct.2009.06.002 PubMed: 19505523
93. Kyselova V, Peknicova J, Buckiova D, Boubelik M. Effects of p-nonylphenol and resveratrol on body and organ weight and in vivo fertility of outbred CD-1 mice. Reprod Biol Endocrinol. 2003; 1:30. DOI: 10.1186/1477-7827-1-30 PubMed: 12749770
95. Juan ME, Gonzalez-Pons E, Munuera T, Ballester J, Rodriguez-Gil JE, Planas JM. trans-Resveratrol, a natural antioxidant from grapes, increases sperm output in healthy rats. J Nutr. 2005; 135(4):757-760. DOI: 10.1093/jn/135.4.757 PubMed: 15795430
96. Bowers JL, Tyulmenkov VV, Jernigan SC, Klinge CM. Resveratrol acts as a mixed agonist/antagonist for estrogen receptors alpha and beta. Endocrinology. 2000; 141(10):3657-3667. DOI: 10.1210/endo.141.10.7721 PubMed: 11014220
97. Gehm BD, McAndrews JM, Chien PY, Jameson JL. Resveratrol, a polyphenolic compound found in grapes and wine, is an agonist for the estrogen receptor. Proc Natl Acad Sci USA. 1997; 94(25):14138-14143. DOI: 10.1073/pnas.94.25.14138 PubMed: 9391166
RES has been studied as a protective agent against chemical-, disease-, or age-related impairments in reproductive organs. Due in part to its antioxidant properties, RES has been shown to be protective against chemical-induced damage to the ovaries and spermatogonia.98-102 RES improved estrus cyclicity in rat models of polycystic ovary syndrome (PCOS), increased the ovarian follicle reserve, and extended ovarian life span in rats (reviewed in Ortega and Duleba103). In vitro incubation with RES induced maturation and blastocyst formation in oocytes from aged mice.104 Additionally, RES modulated the insulin signaling pathways in theca-interstitial cells that may prevent the theca-interstitial cell hyperplasia seen in PCOS.105
98. Banu SK, Stanley JA, Sivakumar KK, Arosh JA, Burghardt RC. Resveratrol protects the ovary against chromium-toxicity by enhancing endogenous antioxidant enzymes and inhibiting metabolic clearance of estradiol. Toxicol Appl Pharmacol. 2016; 303:65-78. DOI: 10.1016/j.taap.2016.04.016 PubMed: 27129868
102. Singh I, Goyal Y, Ranawat P. Potential chemoprotective role of resveratrol against cisplatin induced testicular damage in mice. Chem Biol Interact. 2017; 273:200-211. DOI: 10.1016/j.cbi.2017.05.024 PubMed: 28606469
103. Ortega I, Duleba AJ. Ovarian actions of resveratrol. Ann N Y Acad Sci. 2015; 1348(1):86-96. DOI: 10.1111/nyas.12875 PubMed: 26315293
104. Liu MJ, Sun AG, Zhao SG, Liu H, Ma SY, Li M, Huai YX, Zhao H, Liu HB. Resveratrol improves in vitro maturation of oocytes in aged mice and humans. Fertil Steril. 2018; 109(5):900-907. DOI: 10.1016/j.fertnstert.2018.01.020 PubMed: 29778389
105. Wong DH, Villanueva JA, Cress AB, Duleba AJ. Effects of resveratrol on proliferation and apoptosis in rat ovarian theca-interstitial cells. Mol Hum Reprod. 2010; 16(4):251-259. DOI: 10.1093/molehr/gaq002 PubMed: 20067985
Humans
The literature contains no studies on the reproductive and developmental toxicity of RES in humans. In a study evaluating RES as a protective agent for reproductive function, hyperandrogenic PCOS patients took 1,500 mg/day of RES for 3 months and exhibited decreased testosterone levels and increased insulin sensitivity.106 Incubation of oocytes from women aged 38–45 years in RES-containing media improved oocyte quality.104 These improvements were attributed to increased mitochondrial function and improved spindle and chromosomal formation in the oocytes.
106. Banaszewska B, Wrotynska-Barczynska J, Spaczynski RZ, Pawelczyk L, Duleba AJ. Effects of resveratrol on polycystic ovary syndrome: A double-blind, randomized, placebo-controlled trial. J Clin Endocrinol Metab. 2016; 101(11):4322-4328. DOI: 10.1210/jc.2016-1858 PubMed: 27754722
104. Liu MJ, Sun AG, Zhao SG, Liu H, Ma SY, Li M, Huai YX, Zhao H, Liu HB. Resveratrol improves in vitro maturation of oocytes in aged mice and humans. Fertil Steril. 2018; 109(5):900-907. DOI: 10.1016/j.fertnstert.2018.01.020 PubMed: 29778389
Immunotoxicity
A previous NTP study found no significant toxicity on innate or adaptive immune system function after oral gavage exposure of male B6C3F1/N mice to ≤2,500 mg/kg/day resveratrol for 28 days.107 An independent safety study found no evidence of sensitization induced by RES in the local lymph node assay.85 Other studies have described immunomodulatory effects of RES, both experimentally and in humans,35,108-110 primarily for its use as a preventive agent against chronic, immune-related diseases rather than in the context of evaluating toxicity.
107. Huang MC, White KL, Elmore SA, Guo TL, Germolec D. Immunotoxicity studies of trans-resveratrol in male B6C3F1/N mice. J Immunotoxicol. 2020; 17(1):194-201. DOI: 10.1080/1547691X.2020.1833113 PubMed: 33213203
85. Williams LD, Burdock GA, Edwards JA, Beck M, Bausch J. Safety studies conducted on high-purity trans-resveratrol in experimental animals. Food Chem Toxicol. 2009; 47(9):2170-2182. DOI: 10.1016/j.fct.2009.06.002 PubMed: 19505523
35. Malaguarnera L. Influence of resveratrol on the immune response. Nutrients. 2019; 11(5). DOI: 10.3390/nu11050946 PubMed: 31035454
108. Espinoza JL, Trung LQ, Inaoka PT, Yamada K, An DT, Mizuno S, Nakao S, Takami A. The repeated administration of resveratrol has measurable effects on circulating T-cell subsets in humans. Oxid Med Cell Longev. 2017; 2017:6781872. DOI: 10.1155/2017/6781872 PubMed: 28546852
110. Di Renzo L, Marsella LT, Carraro A, Valente R, Gualtieri P, Gratteri S, Tomasi D, Gaiotti F, De Lorenzo A. Changes in LDL oxidative status and oxidative and inflammatory gene expression after red wine intake in healthy people: A randomized trial. Mediators Inflamm. 2015; 2015:317348. DOI: 10.1155/2015/317348 PubMed: 26101461
Carcinogenicity
The literature contains no studies on the carcinogenicity of RES in animals or humans. One study assessed the carcinogenicity of RES in TSG-p53+/- (heterozygous p53 knockout; p53+/-) mice. There were no increases in the incidence of benign or malignant neoplasms in TSG-p53+/- mice after 6 months of exposure via oral gavage at 1,000, 2,000, or 4,000 mg/kg/day, but urothelial hyperplasia was observed at 2,000 and 4,000 mg/kg/day.89 In this study, there was high mortality in the 2,000 and 4,000 dose groups (40% and 70%, respectively), likely due to gastrointestinal test article impaction.89
89. Horn TL, Cwik MJ, Morrissey RL, Kapetanovic I, Crowell JA, Booth TD, McCormick DL. Oncogenicity evaluation of resveratrol in p53(+/-) (p53 knockout) mice. Food Chem Toxicol. 2007; 45(1):55-63. DOI: 10.1016/j.fct.2006.07.015 PubMed: 16965847
89. Horn TL, Cwik MJ, Morrissey RL, Kapetanovic I, Crowell JA, Booth TD, McCormick DL. Oncogenicity evaluation of resveratrol in p53(+/-) (p53 knockout) mice. Food Chem Toxicol. 2007; 45(1):55-63. DOI: 10.1016/j.fct.2006.07.015 PubMed: 16965847
Genetic Toxicity
Although RES has been investigated for antioxidant and antigenotoxic effects, several studies (described below) indicate it has genotoxic activity in vitro, which may be partially dependent on forming a complex with copper and oxygen. However, the few in vivo studies reported for this compound suggest that RES does not appear to be genotoxic.
RES was reported as negative in Salmonella typhimurium tester strains TA98 and TA100, and in Escherichia coli WP2 uvrA, when tested at several concentrations ranging from 0.02 to 5,000 μg/plate in the absence or presence of rat metabolic liver enzymes (S9 mix).111 A highly purified preparation of RES, called resVida, was also reported as negative in S. typhimurium tester strains TA98, TA100, TA1535, TA1537, and E. coli WP2 uvrA (pKM101), when tested at ≤5,000 μg/plate in the absence or presence of rat S9 mix.85
111. Matsuoka A, Furuta A, Ozaki M, Fukuhara K, Miyata N. Resveratrol, a naturally occurring polyphenol, induces sister chromatid exchanges in a Chinese hamster lung (CHL) cell line. Mutat Res. 2001; 494(1-2):107-113. DOI: 10.1016/S1383-5718(01)00184-X PubMed: 11423350
85. Williams LD, Burdock GA, Edwards JA, Beck M, Bausch J. Safety studies conducted on high-purity trans-resveratrol in experimental animals. Food Chem Toxicol. 2009; 47(9):2170-2182. DOI: 10.1016/j.fct.2009.06.002 PubMed: 19505523
In cell culture studies conducted by Matsuoka et al.,111 exposure to 20 μg/mL resveratrol for 24–48 hours increased the frequency of micronuclei in Chinese hamster lung (CHL) fibroblasts. Chromosomal aberrations, primarily chromatid breaks and exchanges, increased when CHL fibroblasts were exposed to 10 μg/mL resveratrol for 48 hours or to 20 μg/mL resveratrol for 54 hours. Exposure to 10 μg/mL resveratrol for 48 or 72 hours also changed the modal number of chromosomes in metaphase spreads from these cells, suggesting that RES may have an aneugenic effect.
111. Matsuoka A, Furuta A, Ozaki M, Fukuhara K, Miyata N. Resveratrol, a naturally occurring polyphenol, induces sister chromatid exchanges in a Chinese hamster lung (CHL) cell line. Mutat Res. 2001; 494(1-2):107-113. DOI: 10.1016/S1383-5718(01)00184-X PubMed: 11423350
The genotoxicity of RES was also evaluated in Chinese hamster V79 lung fibroblasts and L5178Y Tk+/- mouse lymphoma cells by Schmitt et al.112 V79 cells were exposed to 100 μM RES for 6 hours, washed, and then evaluated for micronuclei every hour from 2 to 18 hours after exposure. Micronuclei were increased by approximately 10-fold at time points ranging from 14 to 18 hours. L5178Y Tk+/- cells were exposed to several concentrations of RES, ranging from 1 to 60 μM, for 4 hours. Cells were washed and allowed to grow for another 20 hours before harvest. Dose-dependent induction of micronuclei was observed, with a fivefold induction at 60 μM. Cells from this experiment were also evaluated for kinetochore-positive micronuclei, aberrant spindle morphology, and displacement of chromosomes from metaphase rings, which increased by 2.3-, 2.9-, and 1.7-fold, respectively, at 60 μM, suggesting that RES might induce micronuclei by an aneugenic mode-of-action. RES (≤200 μM) did not affect microtubule assembly in a cell-free tubulin polymerization assay, however.
112. Schmitt E, Lehmann L, Metzler M, Stopper H. Hormonal and genotoxic activity of resveratrol. Toxicol Lett. 2002; 136(2):133-142. DOI: 10.1016/S0378-4274(02)00290-4 PubMed: 12425963
Human colonic epithelial NCM460 cells were exposed to 0, 0.01, 0.1, 1, 10, or 100 μM RES for 24 hours and evaluated in a cytokinesis-block micronucleus assay.113 A U-shaped curve was observed for micronuclei at concentrations from 0 to 10 μM, with levels of micronuclei dropping below control levels from 0.01 to 0.1 μM and increasing to control levels from 1 to 10 μM, with a modest induction of micronuclei above control levels at 100 μM.
113. Guo X, Ni J, Dai X, Zhou T, Yang G, Xue J, Wang X. Biphasic regulation of spindle assembly checkpoint by low and high concentrations of resveratrol leads to the opposite effect on chromosomal instability. Mutat Res Genet Toxicol Environ Mutagen. 2018; 825:19-30. DOI: 10.1016/j.mrgentox.2017.11.004 PubMed: 29307372
Several studies have investigated the mechanisms by which RES causes genotoxicity in vitro. Using a set of six analogues of RES that differed in the number and placement of hydroxy groups, Matsuoka et al.114 showed that the 4’-hydroxy group was necessary for the genotoxic effects of RES in the micronucleus assay and chromosomal aberration assay when conducted using CHL fibroblasts. For each experimental endpoint, CHL fibroblasts were exposed to concentrations of RES analogues ranging from 2.5 to 20 μg/mL for 24 or 48 hours, or to 10 μg/mL of RES for 48 hours for comparison. In a study by Liu et al.,115 a panel of isogenic DT40 chicken B-lymphoma cells deficient for genes involved in different DNA repair pathways were compared to wildtype DT40 cells when exposed to concentrations of RES ranging from 5 to 20 µM for 72 hours. This panel indicated that genes related to DNA single strand break repair (Parp1), base excision repair (Polβ), homologous recombination (Brca1 and Brca2), and translesion synthesis (Rev3 and Rad18) were required to survive exposure to RES, whereas cells did not depend on nucleotide excision repair (Xpa) and nonhomologous end joining repair (Ku70) for survival. Furthermore, deficiency for Parp1 or Polβ modestly increased sensitivity to RES-dependent induction of γ-H2AX (a biomarker of double strand DNA breaks) and chromosomal aberrations compared to WT DT40 cells. Biochemical studies indicate that RES forms a copper-peroxide complex that may target reactive oxygen to DNA, resulting in DNA damage.116 In the presence of cupric ions (Cu2+) and oxygen, the dihydroxylated benzene ring of RES is converted to a trihydroxylated benzene ring complexed with Cu2+, oxygen, and water. This complex promoted cleavage of DNA in a plasmid-based DNA cleavage assay when present at concentrations as low as 1 μM. This effect was not observed with other metal ions, such as Mg2+, Mn2+, Zn2+, Ni2+, Co2+, or Fe3+.
114. Matsuoka A, Takeshita K, Furuta A, Ozaki M, Fukuhara K, Miyata N. The 4′-hydroxy group is responsible for the in vitro cytogenetic activity of resveratrol. Mutat Res. 2002; 521(1-2):29-35. DOI: 10.1016/S1383-5718(02)00211-5 PubMed: 12438001
115. Liu Y, Wu X, Hu X, Chen Z, Liu H, Takeda S, Qing Y. Multiple repair pathways mediate cellular tolerance to resveratrol-induced DNA damage. Toxicol In Vitro. 2017; 42:130-138. DOI: 10.1016/j.tiv.2017.04.017 PubMed: 28431926
116. Fukuhara K, Miyata N. Resveratrol as a new type of DNA-cleaving agent. Bioorg Med Chem Lett. 1998; 8(22):3187-3192. DOI: 10.1016/S0960-894X(98)00585-X PubMed: 9873700
Although RES has been shown to cause DNA damage in vitro, it was not genotoxic in the few in vivo studies that have been reported for this compound. Micronuclei were not induced in polychromatic erythrocytes (PCEs) obtained from the bone marrow of male Swiss albino mice when evaluated 24 hours after exposure to 0, 6.25, 12.5, 25, 50, or 100 mg/kg RES by gavage.117 No significant increases in micronucleated PCEs, and no apparent toxicity to PCEs, were observed in bone marrow from male Sprague Dawley rats administered 0, 500, 1,000, or 2,000 mg/kg/day resVida by gavage on 2 consecutive days (24 hours apart).85 resVida was present in plasma and widely distributed among various organs in male Sprague Dawley rats, although bone marrow was not specifically assessed for the presence of resVida.85
117. Abraham SK, Khandelwal N, Hintzsche H, Stopper H. Antigenotoxic effects of resveratrol: Assessment of in vitro and in vivo response. Mutagenesis. 2016; 31(1):27-33. PubMed: 26152226
85. Williams LD, Burdock GA, Edwards JA, Beck M, Bausch J. Safety studies conducted on high-purity trans-resveratrol in experimental animals. Food Chem Toxicol. 2009; 47(9):2170-2182. DOI: 10.1016/j.fct.2009.06.002 PubMed: 19505523
85. Williams LD, Burdock GA, Edwards JA, Beck M, Bausch J. Safety studies conducted on high-purity trans-resveratrol in experimental animals. Food Chem Toxicol. 2009; 47(9):2170-2182. DOI: 10.1016/j.fct.2009.06.002 PubMed: 19505523
Study Rationale
RES was nominated by the National Institute of Environmental Health Sciences for toxicological evaluation by NTP due to its widespread use as a dietary supplement and insufficient information on its potential toxicity and carcinogenicity. In particular, data were lacking on effects associated with perinatal exposure and effects at the doses being investigated for therapeutic purposes. Because exposure to RES occurs primarily through ingestion, oral gavage was the selected route of administration.
Materials and Methods
Procurement and Characterization
Trans-resveratrol
Trans-resveratrol (RES) was obtained from Bayville Chemical Supply Co. Inc. (Deer Park, NY) in a single lot (156AB). Identity, purity, and stability analyses were conducted by the analytical chemistry lab at RTI International (Research Triangle Park, NC) (Appendix A). Reports on analyses performed in support of the RES study are on file at the National Institute of Environmental Health Sciences (NIEHS).
Lot 156AB, a fine off-white powder with a melting point of 253.5°C, was identified as RES using Fourier transform infrared (FT-IR) spectroscopy and 1H nuclear magnetic resonance (NMR) spectroscopy. Low- and high-resolution mass spectrometry were conducted by the analytical chemistry laboratory at RTI International (Table A-1) and the University of South Carolina (Columbia, SC), respectively. No reference spectra were available for comparison, but all spectra were consistent with the mass and structure of RES.
Purity evaluation using high-performance liquid chromatography (HPLC) with ultraviolet (UV) detection did not identify any impurities. Lot 156AB was found to contain the trans-isomer of RES exclusively in an analysis using HPLC with a photodiode array (PDA) detector (Table A-1). Karl Fisher titration performed at Galbraith Laboratories (Knoxville, TN) indicated a water content of 0.24%. The overall purity of lot 156AB was determined to be >99%.
Accelerated stability studies conducted using HPLC/UV confirmed the bulk chemical is stable when protected from light and stored for 2 weeks at refrigerated (5°C), room (25°C), elevated (60°C), and frozen (–20°C) temperatures. The bulk chemical was stored at –20°C and protected from light, per the manufacturer’s recommendations.
Methylcellulose
Methylcellulose used to make the 0.5% aqueous vehicle for gavage formulations was obtained from Spectrum (Gardena, CA) in three lots (UR1026, WL0069, and XB1050). Lot UR1026 was used in the 2-week studies and lots WL0069 and XB1050 were used in the 3-month studies.
The identity of the methylcellulose was confirmed by the study laboratory using FT-IR spectroscopy. Periodic purity analyses were performed by Galbraith Laboratories, Inc. (Knoxville, TN) during the 3-month studies to determine the methoxy group content. The August 27, 2008, sample of lot WL0069, used to prepare the first dose formulation, had methoxy group content (32.2%) outside of the acceptance criteria of 27.5%–31.5%. A replacement lot (XB1050) was procured for the remaining formulations and was within the acceptance criteria for methoxy group content (29.3%).
Deionized water was used to make the 0.5% aqueous methylcellulose vehicle for gavage formulations.
Preparation and Analysis of Dose Formulations
Dose formulations of RES in 0.5% methylcellulose were prepared at concentrations of 15.6, 31.2, 62.5, 125, or 250 mg/mL for the 2-week study in Fischer 344 (F344/NTac) rats, the 3-month study in Wister Han rats, and the 2-week and 3-month studies in B6C3F1/N mice (Table A-2). The method of preparation was validated for concentration ranges of 15–500 mg/mL. The formulations were found to be resuspended and homogeneous after blending.
Stability of the 15.6 mg/mL and 500 mg/mL formulations was confirmed for 42 days when protected from light and stored at room (~25°C), refrigerated (5°C), and freezer (–20°C) temperatures. A dosing simulation study on the 15.6 mg/mL formulation found that it was stable when stored at room temperature in an open amber vessel for 3 hours.
Analysis of preadministration and postadministration dose formulations were conducted throughout the study by the study laboratory (Appendix A). Postadministration samples were collected from the bottles used to dose the animals. All preadministration samples from the 2-week and 3-month studies administered to animals were within 10% of the target concentrations, except for a 125 mg/mL dose formulation prepared for the mouse study in September 2008. Postadministration samples of the 62.5 mg/mL dose formulation in the 2-week studies for mice and F344/NTac rats were 17.5% and 19.5% above the target concentration, respectively. Postadministration samples of the 125 and 250 mg/mL dose formulations prepared in September 2008 for the 3-month mouse studies were 10.9% and 14.3% above the target concentrations, respectively. All other samples were within 10% of the target concentration.
Animal Source
Male and female F344/NTac rats and B6C3F1/N mice were obtained from Taconic Biosciences, Inc. (Germantown, NY) for the 2-week studies. For the 3-month studies, time-mated (F0) female Wistar Han [Crl:WI(Han)] rats were obtained from Charles River Laboratories (Raleigh, NC); male and female B6C3F1/N mice were obtained from Taconic Biosciences, Inc. (Germantown, NY). The rationale for change of rat strain from F344/NTac to Wistar Han [Crl:WI(Han)] was a programmatic decision. For many years, the National Toxicology Program (NTP) used the inbred F344/N rat for its toxicity and carcinogenicity studies. Over time, the F344/N rat exhibited sporadic seizures and idiopathic chylothorax, and consistently high rates of mononuclear cell leukemia and testicular neoplasia. Because of these issues in the F344/N rat and NTP’s desire to find a more fecund rat model that could be used in both reproductive and carcinogenesis studies for comparative purposes, a change in the rat model was explored. After a workshop held by NTP in 2005, use of the F344/N rat was discontinued and NTP switched to the F344/NTac rat118 while other rat models were being investigated. The Wistar Han rat, an outbred stock, [Crl:WI(Han)] was eventually selected119 because it was projected to have a long lifespan, resistance to disease, large litter size, and low neonatal mortality.120
118. King-Herbert A, Thayer K. NTP workshop: Animal models for the NTP rodent cancer bioassay: Stocks and strains—should we switch? Toxicol Pathol. 2006; 34(6):802-805. DOI: 10.1080/01926230600935938 PubMed: 17162538
119. King-Herbert AP, Sills RC, Bucher JR. Commentary: Update on animal models for NTP studies. Toxicol Pathol. 2010; 38(1):180-181. DOI: 10.1177/0192623309356450 PubMed: 20019353
120. Hedrich HJ. Taxonomy and stocks and strains. In: Suckow M, Weisbroth S, Franklin C, editors. The Laboratory Rat. Burlington, MA: Elsevier Academic; 2006. p. 71–92. 10.1016/B978-012074903-4/50006-6
Animal Welfare
Animal care and use are in accordance with the Public Health Service Policy on Humane Care and Use of Animals. All animal studies were conducted in an animal facility accredited by AAALAC International. Studies were approved by the Battelle (Columbus, OH) Animal Care and Use Committee and conducted in accordance with all relevant National Institutes of Health (NIH) and NTP animal care and use policies and applicable federal, state, and local regulations and guidelines.
Two-week Studies
F344/NTac rats and B6C3F1/N mice were approximately 3 to 4 (rats) or 4 to 5 (mice) weeks old on receipt. Animals were quarantined for 11 days, and both F344/NTac rats and B6C3F1/N mice were approximately 5 to 6 weeks old on the first day of the studies. F344/NTac rats and B6C3F1/N mice were randomly assigned to one of six dose groups before the start of the study. Randomization was stratified by body weight to produce similar group mean weights using PATH/TOX SYSTEM software (Xybion Medical Systems Corporation, Lawrenceville, NJ).
Before the studies began, five male and five female F344/NTac rats and B6C3F1/N mice were randomly selected for parasite evaluation and gross observation for evidence of disease. Additionally, the health of the animals was monitored during the studies according to the protocols of the NTP Sentinel Animal Program (Appendix C). All test results were negative.
Groups of five male and five female F344/NTac rats and five male and five female B6C3F1/N mice were administered 0, 78, 156, 312.5, 625, or 1,250 mg RES/kg body weight/day (mg/kg/day) (F344/NTac rats) and 0, 156, 312, 625, 1,250, or 2,500 mg/kg/day (B6C3F1/N mice) in 0.5% aqueous methylcellulose by gavage 5 days per week for 2 weeks. These doses were selected based on available literature at the time of study design86 and limitations in chemical formulation and administration. Although a previous 28-day study in CD Virus Antibody Free (VAF) rats reported nephrotoxicity and limited lethality at 3,000 mg/kg/day,86 challenges with formulating a gavage-able dose in methylcellulose to achieve that concentration necessitated lowering the high dose for both rats and mice. Because no data were available on the toxicity of higher doses in mice, the high dose given to mice was the highest possible given chemistry limitations and was greater than the high dose administered in rats.
86. Crowell JA, Korytko PJ, Morrissey RL, Booth TD, Levine BS. Resveratrol-associated renal toxicity. Toxicol Sci. 2004; 82(2):614-619. DOI: 10.1093/toxsci/kfh263 PubMed: 15329443
86. Crowell JA, Korytko PJ, Morrissey RL, Booth TD, Levine BS. Resveratrol-associated renal toxicity. Toxicol Sci. 2004; 82(2):614-619. DOI: 10.1093/toxsci/kfh263 PubMed: 15329443
Vehicle control animals were administered the 0.5% aqueous methylcellulose vehicle alone; dosing volumes were 5 mL/kg body weight (mL/kg) for F344/NTac rats and 10 mL/kg for B6C3F1/N mice. Animals were administered the dose for at least 2 consecutive days prior to necropsy. Feed and water were available ad libitum. F344/NTac rats and B6C3F1/N mice were housed individually (male B6C3F1/N mice) or five per cage by sex (male and female F344/NTac rats, female B6C3F1/N mice). F344/NTac rats and B6C3F1/N mice were observed twice daily for signs of mortality or moribundity. Clinical observations were recorded daily, and body weights were recorded initially, on day 8, and at study termination. Details of the study design and animal maintenance are summarized in Table 1. Information on feed composition and contaminants is provided in Appendix B.
Necropsies were performed on all F344/NTac rats and B6C3F1/N mice. Organ weights were determined for the heart, right kidney, liver, lung, right testis, and thymus. Tissues for microscopic examination were fixed and preserved in 10% neutral buffered formalin (except eyes, which were first fixed in Davidson’s solution), processed and trimmed, embedded in paraffin, sectioned to a thickness of approximately 5 μm, and stained with hematoxylin and eosin (H&E). Gross lesions were examined microscopically. As no dose-related changes were found at gross necropsy in F344/NTac rats, no further microscopic examinations were performed. While no dose-related changes were found at gross necropsy in B6C3F1/N mice, there were possible dose-related changes in the weights of the liver and thymus; the liver and thymus were examined microscopically on all vehicle control and 2,500 mg/kg/day group mice. Table 1 lists the tissues and organs examined.
Three-month Studies
Study Design for Wistar Han Rats
F0 female Wistar Han rats were 11 to 12 weeks old upon receipt. Gestation day (GD) 1 was defined as the first day with evidence of mating; F0 females were received from Charles River Laboratories (Raleigh, NC) on GD 2 and held for 4 days. F0 females were randomly assigned to one of six dose groups on GD 5. To ensure at least 16 females in the 0, 78, 312.5, and 1,250 mg/kg/day groups, 33 females were assigned to each dose group to allow sufficient animals for biological sampling. Randomization was stratified by body weight to produce similar group mean weights using PATH/TOX SYSTEM software (Xybion Medical Systems Corporation, Lawrenceville, NJ).
F0 Wistar Han females were quarantined for 37 days after receipt. Ten nonmated females received in the same shipment as the time-mated dams were designated for disease monitoring and were used for gross necropsies 2 days after arrival; samples were collected for parasite evaluation and gross observation of disease. The health of the F1 animals was monitored during the studies according to the protocols of the NTP Sentinel Animal Program (Appendix C). All test results were negative.
Beginning on GD 6, F0 female Wistar Han rats were administered RES in 0.5% aqueous methylcellulose by gavage throughout gestation and lactation at one of five dose levels (78, 156, 312.5, 625, or 1,250 mg/kg/day) or the vehicle control (0.5% aqueous methylcellulose). Formulations were administered daily, except for the day of delivery if the dam was in the process of delivering; dosing volumes were 5 mL/kg. F0 females were weighed on GD 5 (for randomization) and daily (except for the day of delivery) throughout the perinatal period; the dosing volume was calculated using the dam’s most recent body weight. Feed and water were available ad libitum. F0 females were housed individually during gestation and with their respective litters during lactation. Cages were changed weekly for pregnant dams before delivery and twice weekly for dams and their litters after postnatal day (PND) 4.
The day of parturition was considered lactation day (LD) 0 for dams and PND 0 for pups. F0 female Wister Han rats that did not deliver were euthanized on GD 27, and the uteri were examined for evidence of implantation. On PND 1, clinical observations and litter weights by sex were recorded. From PND 2 through PND 12 (when the F1 pups began receiving the formulations by gavage), the number of pups for each litter was recorded twice daily. F1 pups were individually weighed on PNDs 4, 7, 12, 15, 18, and 21.
On PND 4, the number of litters was reduced to seven litters per dose group, and litters were standardized to eight Wistar Han pups per litter (four males and four females when possible); litters used had a minimum of at least three pups per sex. On the day the last litter reached PND 18, five litters per group were randomly selected and two pups per sex from each litter were randomly selected for use in the 3-month study. On the day the last litter reached PND 21, the pups were weaned, and dams were removed from the cages and humanely euthanized with carbon dioxide. Weaning marked the beginning of the 3-month study.
After weaning, F1 pups were housed five per cage. Groups of 10 male and 10 female Wistar Han F1 pups were administered 0, 78, 156, 312.5, 625, or 1,250 mg/kg/day in 0.5% aqueous methylcellulose by gavage 5 days per week for 3 months. Pups were administered the same dose their respective dam received during gestation and lactation, and F1 pups began receiving these doses on PND 12 via gavage. Vehicle control animals were administered the 0.5% aqueous methylcellulose vehicle alone. Dosing volumes were 5 mL/kg, using the animal’s most recent body weight, and dosing was completed by noon each day. Feed and water were available ad libitum. Two diets were utilized in the rat studies: (1) NIH-07 during the perinatal phase and (2) NTP-2000 during the postweaning phase. The NIH-07 diet is a higher protein diet that supports reproduction and lactation in rodents, whereas the NTP-2000 diet is a lower protein diet that decreases the incidence of chronic nephropathy in adult rats. Cages were changed twice weekly and rotated every 2 weeks. Details of the study design and animal maintenance are summarized in Table 1. Information on feed composition and contaminants is provided in Appendix B.
Throughout the perinatal phase and at study termination, biological samples were collected from the 0, 78, 312.5, and 1,250 mg/kg/day groups and stored at approximately −20°C before shipment on dry ice to RTI International (Research Triangle Park, NC) for analysis to confirm internal dose (Appendix D). On GD 18, blood was collected from the retroorbital sinus of three randomly selected dams from each dose group at 30 minutes, 60 minutes, or 90 minutes after RES administration (nine dams per dose group in total). Animals were anesthetized with a carbon dioxide/oxygen mixture and blood was collected into tubes containing sodium heparin, centrifuged, and the plasma harvested. The dams were then humanely euthanized with carbon dioxide, and the fetuses were removed and individually flash frozen in liquid nitrogen. On PND 4, following dose administration to dams, 10 male and 10 female randomly selected standardized pups for each dose group were humanely euthanized by decapitation by noon, placed into individual vials (one pup per vial), and flash frozen in liquid nitrogen. On PND 21, following the last dose administration to pups, blood was collected via cardiac puncture from five male and five female Wistar Han rat pups from each dose group. Animals were first anesthetized with a carbon dioxide/oxygen mixture and blood was then collected into tubes containing lithium heparin, centrifuged, and the plasma harvested. After blood collection, the pups were humanely euthanized by carbon dioxide inhalation overdose and were disposed of without further evaluation. At study termination (24 hours after the last dose), blood was collected from the retroorbital sinus of five randomly selected animals per sex for each dose group for biological sampling. Animals were anesthetized with a carbon dioxide/oxygen mixture and blood was collected into tubes containing sodium heparin, centrifuged, and the plasma harvested.
Study Design for B6C3F1/N Mice
Male and female B6C3F1/N mice were 4–5 weeks old on receipt. Animals were quarantined for 11 (females) or 12 (male) days and mice were approximately 5 to 6 weeks old on the first day of the study. Mice were randomly assigned to one of six dose groups before the start of the study. Randomization was stratified by body weight to produce similar group mean weights using PATH/TOX SYSTEM software (Xybion Medical Systems Corporation, Lawrenceville, NJ).
Before the studies began, five male and five female mice were randomly selected for parasite evaluation and gross observation for evidence of disease. In addition, 10 male and 10 female mice were selected for 4-week and end-of-study serologies. The health of the animals was monitored during the studies according to the protocols of the NTP Sentinel Animal Program (Appendix C). All test results were negative.
Groups of 10 male and 10 female mice were administered RES at doses of 0, 156, 312, 625, 1,250, or 2,500 mg/kg/day in 0.5% aqueous methylcellulose by gavage 5 days per week for 3 months. Vehicle control animals were administered the 0.5% aqueous methylcellulose vehicle alone. Dosing volumes were 10 mL/kg, using the animal’s most recent body weight, and dosing was completed by noon each day. Animals were administered the dose for at least 2 consecutive days prior to necropsy. Feed and water were available ad libitum. Male mice were housed individually, whereas female mice were housed five per cage. Cages were changed weekly (males) or twice weekly (females) and rotated every 2 weeks. Details of the study design and animal maintenance are summarized in Table 1. Information on feed composition and contaminants is provided in Appendix B.
Clinical Examinations and Pathology
During the 3-month studies, Wistar Han rats and B6C3F1/N mice were observed twice daily for signs of morbidity or moribundity and weighed prior to dosing on day 1, weekly thereafter, and at study termination. Clinical observations were recorded after dosing on day 1, weekly thereafter, and at study termination.
At the end of the 3-month studies, animals were anesthetized with a carbon dioxide/oxygen mixture and bled in random order. Blood was collected from the retroorbital site of all animals for hematology, clinical chemistry (rats only), and erythrocyte micronuclei analyses. Blood for hematology and micronuclei determinations was collected into tubes containing ethylenediaminetetraacetic acid (EDTA). Blood for clinical chemistry measurements was collected into serum separator tubes, centrifuged, and the serum harvested. Hematology parameters were analyzed using an Advia 120 hematology analyzer (Bayer Diagnostics Division, Tarrytown, NY). Clinical chemistry parameters were analyzed using a Roche cobas c501 chemistry analyzer (Roche, Indianapolis, IN). The parameters measured are listed in Table 1. Samples for erythrocyte micronuclei determination were stored at 2°C–8°C immediately after collection and shipped to Integrated Laboratory Systems, LLC (ILS, Durham, NC) for analysis.
At the end of the 3-month studies, samples were collected for sperm motility and vaginal cytology evaluations from F1 male and female Wistar Han rats in the 0, 312.5, 625, and 1,250 mg/kg/day groups and from male and female B6C3F1/N mice in the 0, 625, 1,250, and 2,500 mg/kg/day groups. The parameters evaluated are listed in Table 1. For 16 consecutive days before scheduled study termination, the vaginal vaults of the females were moistened with saline, if necessary, and samples of vaginal fluid and cells were collected and subsequently stained. Relative numbers of leukocytes, nucleated epithelial cells, and large squamous epithelial cells were determined and used to ascertain estrous cycle stage (i.e., diestrus, proestrus, estrus, and metestrus). Measured parameters of cycle length, number of cycles, and time spent in any specific stage of the estrous cycle of female rats and mice are presented in Appendix F. Male animals were evaluated for sperm count and motility. The left testis and left epididymis were isolated and weighed. The tail of the epididymis (cauda epididymis) was then removed from the epididymal body (corpus epididymis) and weighed. Test yolk (rats) or modified Tyrode’s buffer (mice) was applied to slides and a small incision was made at the distal border of the cauda epididymis. The sperm effluxing from the incision were dispersed in the buffer on the slides, and the numbers of motile and nonmotile spermatozoa were counted for five fields per slide by two observers. After completion of sperm motility estimates, each left cauda epididymis was placed in buffered saline solution. Caudae were finely minced, and the tissue was incubated in the saline solution at 34°C–38°C. Sperm density was determined microscopically with the aid of a hemocytometer. To quantify spermatogenesis, the testicular spermatid head count was determined by removing the tunica albuginea and homogenizing the left testis in phosphate-buffered saline containing 10% dimethyl sulfoxide. Homogenization-resistant spermatid nuclei were counted with a hemocytometer.
Necropsies were performed on all animals. Organ weights were determined for the heart, right kidney, liver, lung, right testis, and thymus. Tissues for microscopic examination were fixed and preserved in 10% neutral buffered formalin (except eyes, which were first fixed in Davidson’s solution, and testes, vaginal tunics, and epididymides, which were first fixed in modified Davidson’s solution), processed and trimmed, embedded in paraffin, sectioned to a thickness of 5 μm, and stained with H&E. Complete histopathological examinations were performed by the study laboratory pathologist on all vehicle control and 1,250 mg/kg/day Wistar Han rats and all vehicle control and 2,500 mg/kg/day B6C3F1/N mice. The kidney, intestine (jejunum; rats only), and nose (mice only) were identified as target organs and examined to a no-effect level. Table 1 lists the tissues and organs examined.
After a review of the laboratory reports and selected histopathological slides by a quality assessment (QA) pathologist, the findings and reviewed slides were submitted to an NTP Pathology Working Group (PWG) coordinator for a second independent review. Any inconsistencies in the diagnoses made by the study laboratory and QA pathologists were resolved by the NTP pathology peer-review process. Final diagnoses for reviewed lesions represent a consensus of the PWG or a consensus between the study laboratory pathologist, NTP pathologist, QA pathologist, and the PWG coordinator. Details of these review procedures have been described, in part, by Maronpot and Boorman121 and Boorman et al.122
121. Maronpot RR, Boorman GA. Interpretation of rodent hepatocellular proliferative alterations and hepatocellular tumors in chemical safety assessment. Toxicol Pathol. 1982; 10(2):71-78. DOI: 10.1177/019262338201000210 PubMed: 28094716
122. Boorman GA, Haseman JK, Waters MD, Hardisty JF, Sills RC. Quality review procedures necessary for rodent pathology databases and toxicogenomic studies: The National Toxicology Program experience. Toxicol Pathol. 2002; 30(1):88-92. DOI: 10.1080/01926230252824752 PubMed: 11890481
Statistical Methods
Calculation and Analysis of Nonneoplastic Lesion Incidences
Incidences of nonneoplastic lesions are presented as numbers of animals bearing such lesions at a specific anatomical site and the numbers of animals with that site examined microscopically. For the 3-month study in mice, Fisher’s exact test,123 a procedure that uses the overall proportion of affected animals, was used to identify statistically significant differences between animals administered RES and vehicle control animals, and the Cochran-Armitage trend test was used to test for significant trends.124
123. Gart JJ, Chu KC, Tarone RE. Statistical issues in interpretation of chronic bioassay tests for carcinogenicity. J Natl Cancer Inst. 1979; 62(4):957-974. PubMed: 285297
124. Armitage P. Statistical Methods in Medical Research. Oxford: Blackwell; 1971.
Because up to two pups/sex/litter were present in the perinatal and 3-month study in rats, the Cochran-Armitage test was modified to accommodate litter effects using the Rao-Scott approach.125 The Rao-Scott approach accounts for litter effects by estimating the ratio of the variance in the presence of litter effects to the variance in the absence of litter effects. This ratio is then used to adjust the sample size downward to yield the estimated variance in the presence of litter effects. The Rao-Scott approach was implemented in the Cochran-Armitage test as recommended by Fung et al.126 formula ₸RS2.
125. Rao JN, Scott AJ. A simple method for the analysis of clustered binary data. Biometrics. 1992; 48(2):577-585. DOI: 10.2307/2532311 PubMed: 1637980
126. Fung KY, Krewski D, Rao JN, Scott AJ. Tests for trend in developmental toxicity experiments with correlated binary data. Risk Anal. 1994; 14(4):639-648. DOI: 10.1111/j.1539-6924.1994.tb00277.x PubMed: 7972964
Analysis of Continuous Variables
Two approaches were employed to assess the significance of pairwise comparisons between dosed and vehicle control groups in the analysis of continuous variables. Organ and body weight data, which historically have approximately normal distributions, were analyzed with the parametric multiple comparison procedures of Dunnett127 and Williams.128,129 Hematology, dam gestation length, litter size and survival, internal dose assessment, spermatid, and epididymal spermatozoal data, which typically have skewed distributions, were analyzed using the nonparametric multiple comparison methods of Shirley130 (as modified by Williams131 and Dunn132). The Jonckheere test133 was used to assess the significance of dose-related trends and to determine whether a trend-sensitive test (the Williams or Shirley test) was more appropriate for pairwise comparisons than a test that does not assume a monotonic dose-related trend (the Dunnett or Dunn test).
127. Dunnett CW. A multiple comparison procedure for comparing several treatments with a control. J Am Stat Assoc. 1955; 50(272):1096-1121. DOI: 10.1080/01621459.1955.10501294
128. Williams DA. A test for differences between treatment means when several dose levels are compared with a zero dose control. Biometrics. 1971; 27(1):103-117. DOI: 10.2307/2528930 PubMed: 5547548
129. Williams DA. The comparison of several dose levels with a zero dose control. Biometrics. 1972; 28(2):519-531. DOI: 10.2307/2556164 PubMed: 5037867
130. Shirley E. A non-parametric equivalent of Williams’ test for contrasting increasing dose levels of a treatment. Biometrics. 1977; 33(2):386-389. DOI: 10.2307/2529789 PubMed: 884197
131. Williams DA. A note on Shirley’s nonparametric test for comparing several dose levels with a zero-doe control. Biometrics. 1986; 42(1):183-186. DOI: 10.2307/2531254 PubMed: 3719054
132. Dunn OJ. Multiple comparisons using rank sums. Technometrics. 1964; 6(3):241-252. DOI: 10.1080/00401706.1964.10490181
133. Jonckheere AR. A distribution-free k-sample test against ordered alternatives. Biometrika. 1954; 41(1-2):133-145. DOI: 10.1093/biomet/41.1-2.133
For the perinatal and 3-month study in rats, postweaning body weights were measured on two pups/sex/litter; more than two pups/sex/litter were possible in preweaning body weight measurements. The analyses of preweaning pup body weights took litter effects into account by use of mixed-effects regression wherein litters were the random effects.
For some endpoints in the perinatal and 3-month study in rats, such as hematology, clinical chemistry, and internal dose, data were collected for 10 animals across five different source litters. In these cases, the trend across dose groups was analyzed by a permutation test based on the Jonckheere trend test, implemented by randomly permuting whole litters across dose groups and bootstrapping within the litters.134 Pairwise comparisons were made using a modified Wilcoxon test that incorporated litter effects.135 The Hommel procedure was used to adjust for multiple comparisons.
134. Davison AC, Hinkley DV. Bootstrap methods and their application. Cambridge, UK: Cambridge University Press; 1997. 10.1017/CBO9780511802843
135. Datta S, Satten GA. Rank-sum tests for clustered data. J Am Stat Assoc. 2005; 100(471):908-915. DOI: 10.1198/016214504000001583
Before statistical analysis, extreme values identified by the outlier test of Dixon and Massey136 were examined by NTP personnel, and implausible values were eliminated from the analysis.
136. Dixon W, Massey F. Introduction to statistical analysis. New York, NY: McGraw Hill Book Company Inc; 1957. 10.2307/2332898
Analysis of Vaginal Cytology Data
Vaginal cytology data consist of daily observations of estrous cycle stages over a 16-day period. Differences from the vehicle control group for cycle length and number of cycles were analyzed using a Datta-Satten modified Wilcoxon test with a Hommel adjustment for multiple comparisons.
To identify disruptions in estrous cyclicity, a continuous-time Markov chain model (multi-state model) was fit using a maximum likelihood approach,137 producing estimates of stage lengths for each dose group. Confidence intervals for these estimates were obtained based on bootstrap sampling of the individual animal cycle sequences. Stage lengths that were significantly different from the vehicle control group were identified using permutation testing with a Hommel adjustment for multiple comparisons.
137. Kalbfleisch JD, Lawless JF. The analysis of panel data under a Markov assumption. J Am Stat Assoc. 1985; 80(392):863-871. DOI: 10.1080/01621459.1985.10478195
Analysis of Reproductive Performance Data
Reproductive performance data for the perinatal and 3-month study in rats were analyzed using the Cochran-Armitage trend test and the Fisher’s exact pairwise test.
Quality Assurance Methods
The 2-week and 3-month studies were conducted in compliance with the U.S. Food and Drug Administration Good Laboratory Practice Regulations.138 In addition, the 2-week and 3-month study reports were audited retrospectively by an independent QA contractor against study records submitted to the NTP Archives. Separate audits covered completeness and accuracy of the pathology data, pathology specimens, final pathology tables, and a draft of this NTP Toxicity Report. Audit procedures and findings are presented in reports on file at NIEHS. The audit findings were reviewed and assessed by NTP staff, and all comments were resolved or otherwise addressed during the preparation of this toxicity report.
138. Code of Federal Regulations (CFR). 21(Part 58).
Genetic Toxicology
The genetic toxicity of RES was assessed by testing the ability of the chemical to induce mutations in various strains of Salmonella typhimurium and to increase the frequency of micronucleated erythrocytes in rat and mouse peripheral blood. The protocol for these studies and the results are given in Appendix D. The RES test article for the bacterial mutagenicity studies was obtained from a different manufacturer (Chromadex; Los Angeles, CA) than that used for the in vivo studies.
The genetic toxicity studies have evolved from an earlier effort by NTP to develop a comprehensive database permitting a critical anticipation of a chemical’s carcinogenicity in experimental animals based on numerous considerations, including the molecular structure of the chemical and its observed effects in short-term in vitro and in vivo genetic toxicity tests (structure-activity relationships). The short-term tests were originally developed to clarify proposed mechanisms of chemical-induced DNA damage based on the relationship between electrophilicity and mutagenicity139 and the somatic mutation theory of cancer.140,141 Of note, however, not all cancers arise through genotoxic mechanisms.
139. Miller JA, Miller EC. Ultimate chemical carcinogens as reactive mutagenic electrophiles. In: Hiatt HH, Watson JD, Winsten JA, editors. Origins of Human Cancer. Cold Spring Harbor, NY: Cold Spring Harbor Laboratory; 1977. p. 605–627.
140. Straus DS. Somatic mutation, cellular differentiation, and cancer causation. J Natl Cancer Inst. 1981; 67:233-241. PubMed: 7021938
141. Crawford BD. Perspectives on the somatic mutation model of carcinogenesis. In: Mehlman MA, Flamm WG, Lorentzen RJ, editors. Advances in Modern Environmental Toxicology Mechanisms and Toxicity of Chemical Carcinogens and Mutagens. Princeton, NJ: Princeton Scientific Publishing Co. Inc; 1985. p. 13–59.
Bacterial Mutagenicity
DNA reactivity combined with Salmonella mutagenicity is highly correlated with induction of carcinogenicity in multiple species/sexes of rodents and at multiple tissue sites.142 A positive response in the Salmonella test was shown to be the most predictive in vitro indicator for rodent carcinogenicity (89% of the Salmonella mutagens are rodent carcinogens).143,144 Additionally, no battery of tests that included the Salmonella test improved the predictivity of the Salmonella test alone. However, these other tests can provide useful information on the types of DNA and chromosomal damage induced by the chemical under investigation.
142. Ashby J, Tennant RW. Definitive relationships among chemical structure, carcinogenicity and mutagenicity for 301 chemicals tested by the US NTP. Mutat Res. 1991; 257(3):229-306. DOI: 10.1016/0165-1110(91)90003-E PubMed: 1707500
143. Tennant RW, Margolin BH, Shelby MD, Zeiger E, Haseman JK, Spalding J, Caspary W, Resnick M, Stasiewicz S, Anderson B, et al. Prediction of chemical carcinogenicity in rodents from in vitro genetic toxicity assays. Science. 1987; 236(4804):933-941. DOI: 10.1126/science.3554512 PubMed: 3554512
144. Zeiger E, Haseman JK, Shelby MD, Margolin BH, Tennant RW, Holden H. Evaluation of four in vitro genetic toxicity tests for predicting rodent carcinogenicity: Confirmation of earlier results with 41 additional chemicals. Environ Mol Mutagen. 1990; 16 Suppl 18:1-14. DOI: 10.1002/em.2850160502 PubMed: 2091921
Peripheral Blood Micronucleus Test
Micronuclei (literally “small nuclei” or Howell-Jolly bodies) are biomarkers of induced structural or numerical chromosomal alterations and are formed when acentric fragments or whole chromosomes fail to incorporate into either of two daughter nuclei during cell division.145,146 The predictivity for carcinogenicity of a positive response in acute in vivo bone marrow chromosome aberration or micronucleus tests appears to be less than that in the Salmonella test.147,148 However, clearly positive results in long-term peripheral blood micronucleus tests have high predictivity for rodent carcinogenicity; a weak response in one sex only or negative results in both sexes in this assay do not correlate well with either negative or positive results in rodent carcinogenicity studies.149 Because of the theoretical and observed associations between induced genetic damage and adverse effects in somatic and germ cells, the determination of in vivo genetic effects is important to the overall understanding of the risks associated with exposure to a particular chemical.
145. Schmid W. The micronucleus test. Mutat Res. 1975; 31(1):9-15. DOI: 10.1016/0165-1161(75)90058-8 PubMed: 48190
146. Heddle JA, Hite M, Kirkhart B, Mavournin K, MacGregor JT, Newell GW, Salamone MF. The induction of micronuclei as a measure of genotoxicity. A report of the U.S. Environmental Protection Agency Gene-Tox Program. Mutat Res. 1983; 123(1):61-118. DOI: 10.1016/0165-1110(83)90047-7 PubMed: 6888413
147. Shelby MD, Erexson GL, Hook GJ, Tice RR. Evaluation of a three-exposure mouse bone marrow micronucleus protocol: Results with 49 chemicals. Environ Mol Mutagen. 1993; 21(2):160-179. DOI: 10.1002/em.2850210210 PubMed: 8444144
148. Shelby MD, Witt KL. Comparison results from mouse bone marrow chromosome aberration and micronucleus tests. Environ Mol Mutagen. 1995; 25:302-313. DOI: 10.1002/em.2850250407 PubMed: 7607185
149. Witt KL, Knapton A, Wehr CM, Hook GJ, Mirsalis J, Shelby MD, MacGregor JT. Micronucleated erythrocyte frequency in peripheral blood of B6C3F(1) mice from short-term, prechronic, and chronic studies of the NTP carcinogenesis bioassay program. Environ Mol Mutagen. 2000; 36(3):163–194. DOI: 10.1002/1098-2280(2000)36:3<163::AID-EM1>3.0.CO;2-P
Results
Data Availability
The National Toxicology Program (NTP) evaluated all study data. Data relevant for evaluating toxicological findings are presented here. All study data are available in the NTP Chemical Effects in Biological Systems (CEBS) database: https://doi.org/10.22427/NTP-DATA-TOX-102.150
150. National Toxicology Program (NTP). TOX-102: Toxicity report tables & curves pathology tables, survival and growth curves from NTP short-term and genetic toxicology studies. Research Triangle Park, NC: U.S. Department of Health and Human Services, National Institutes of Health, National Toxicology Program; 2020. DOI: 10.22427/NTP-DATA-TOX-102
Rats
Two-week Study in F344/NTac Rats
All Fischer 344 (F344/NTac) rats survived until study termination following administration of trans-resveratrol (RES) (Table 2). Mean body weights of all dosed groups were within 5% of the vehicle control groups at all measured time points (Table 2; Figure 2). No dose-related clinical observations were noted (Appendix F). There were no significant dose-related differences in organ weights and no dose-related gross or microscopic findings (Appendix F).
Dose Selection Rationale for Three-month Studies in Wister Han Rats
The same doses were used in the 3-month study in Wistar Han rats as were used in the 2-week studies in F344/NTac rats due to the absence of observed toxicity at the 2-week study doses. Due to programmatic changes in the NTP testing program, the F344/NTac strain of rat was changed to Wistar Han.119 There was no evidence that there would be differential toxicity in this strain, thus a 2-week study in Wistar Han rats was not conducted.
119. King-Herbert AP, Sills RC, Bucher JR. Commentary: Update on animal models for NTP studies. Toxicol Pathol. 2010; 38(1):180-181. DOI: 10.1177/0192623309356450 PubMed: 20019353
Three-month Study in Wistar Han Rats (Perinatal Phase)
No significant dose-related differences were observed in pregnancy status, maternal survival, gestation length, or number of Wistar Han dams that littered (Table 3). Maternal mean body weights and body weight gains were lower in all dosed animals except for those in the lowest dose group, 78 mg RES/kg body weight/day (mg/kg/day). Maternal mean body weights were significantly decreased (4%–10% lower) relative to the vehicle control group starting on gestation day (GD) 15 in the 625 and 1,250 mg/kg/day groups, on GD 17 in the 312.5 mg/kg/day group, and on GD 18 in the 156 mg/kg/day group. Body weight gains were significantly decreased relative to the vehicle control group by 19%–35% in all but the 78 mg/kg/day group throughout gestation (GD 6–21). During lactation, there were no significant effects of RES on maternal mean body weights or body weight gains (Table 4). No dose-related clinical observations in pups or dams were noted (Appendix F). No significant differences in total or live litter size, sex ratio, or pup survival at PND 1 or 4 were observed (Table 5).
From PND 4 through weaning, male and female pup mean body weights of RES-dosed groups tended to be lower than those of the vehicle control groups, with a negative trend with dose and pairwise significance in one or more dosed groups (312.5, 625, and 1,250 mg/kg/day). At weaning (PND 21), mean body weights of males and females in the highest dosed group, 1,250 mg/kg/day, were significantly decreased (20%–21%) relative to the vehicle control groups. In other male and female dosed groups on PND 21, the difference from the vehicle control groups ranged from 4% to 12% (Table 6). There were no significant dose-related differences in pup survival from PND 4 through weaning.
Internal Dose Assessment (Preweaning)
RES and two metabolites, trans-resveratrol-3-O-B-D-glucuronide (trans-R3G) and trans-resveratrol-3-sulfate (trans-R3S), were quantified using validated analytical methods (Appendix D) in the following samples: Wistar Han maternal plasma and whole fetuses at 30, 60, and 90 minutes following dose administration on GD 18; male and female whole pups following dose administration to dams on PND 4; and male and female pup plasma following the last dose administration to pups on PND 21. Corresponding data are presented in Table 7 and Table 8.
In GD 18 maternal plasma, RES, trans-R3G and trans-R3S concentrations increased proportionately with dose at all three time points with some exceptions (Table 7). For RES and both metabolites, the highest dam plasma concentrations were generally seen 90 minutes postdose. Concentrations of trans-R3G and trans-R3S were much higher than those of RES demonstrating significant first pass metabolism of RES following oral administration (Table 7). For example, at the 90-minute time point, trans-R3G and trans-R3S concentrations were 33- to 109-fold and 25- to 39-fold higher, respectively, than RES concentrations at all doses and time points (Table 7). RES and metabolites were detected in pooled fetuses on GD 18 at all doses and time points and, as in maternal plasma, increased with dose and time; the highest concentrations were measured at 90 minutes. Concentrations of RES and metabolites in whole fetuses were approximately 1%–11% of dam plasma concentrations demonstrating that the transfer of RES and metabolites from dams to fetuses is low (Table 7).
Male and female PND 4 pups showed dose-dependent increases in RES, trans-R3G and trans-R3S concentrations (Table 8). Similar to GD 18, the metabolite concentrations in whole pups at PND 4 were higher than RES concentrations. Trans-R3G and trans-R3S concentrations in PND 4 pups were 5- to 12-fold and 4- to 7-fold higher than RES concentrations at all doses, respectively. The detection of RES and its metabolites in pups indicated transfer of RES and conjugated RES forms from the dam to pups during lactation.
RES concentrations in PND 21 male and female pup plasma were lower than concentrations in PND 4 whole pups in all dosed groups except the highest dosed group (1,250 mg/kg/day), whereas trans-R3G and trans-R3S concentrations were higher in PND 21 plasma (Table 8). There was no apparent sex difference in the concentration of RES or metabolites in PND 21 pups.
Three-month Study in Wistar Han Rats (Postweaning Phase)
All animals survived to study termination (Table 9). There were no dose-related clinical observations (Appendix F). Mean body weights of RES-dosed animals in all but the 1,250 mg/kg/day group were within 2%–9% of the vehicle control groups at study termination (Table 9; Figure 3). In the 1,250 mg/kg/day group, mean body weights of male and female Wistar Han rats were 21% and 16% lower, respectively, relative to the vehicle control groups 8 days after weaning (study day [SD] 8) (Appendix F). From SD 15 onward, mean body weights of male and female Wistar Han rats in the 1,250 mg/kg/day group were within 20% of the vehicle control groups. By study termination (~SD 95), female Wistar Han rats in the 1,250 mg/kg/day group had mean body weights similar to those of the vehicle control group; male Wistar Han rats weighed 9% less than the vehicle control group (Table 9).
At study termination, there were no dose-related effects on clinical chemistry measures (Appendix F). Several significant differences were observed in the female hematology. These differences were small in magnitude, not observed in the males, or within biological variability, and thus were not considered related to dose. Organ weights were not affected by RES administration (Appendix F).
Vaginal cytology and sperm counts were assessed in the 0, 312.5, 625, and 1,250 mg/kg/day groups after 3 months of exposure. Cycle length, number of cycles, and time in each respective stage in RES-dosed Wistar Han rats were similar to the vehicle control group (Appendix F).
Wistar Han rats administered RES did not display any biologically significant changes in testis or epididymis weights, spermatid or spermatozoa counts, or sperm motility (Appendix F). RES did not exhibit the potential to be a male or female reproductive toxicant in the Wistar Han rat.
Internal Dose Assessment (Postweaning)
RES and two metabolites, trans-R3G and trans-R3S, were quantified using a validated analytical method (Appendix D) in male and female Wistar Han rat plasma collected 24 hours after the last dose administration on SD 95. Plasma concentrations of RES and trans-R3S were much lower in offspring at necropsy compared to those in dams on GD 18 or in offspring on PND 21 (Table 7), likely due to the extended time between the last dose and when samples were collected (24 hours) (Table 10).
Histopathology
This section describes the statistically significant or biologically noteworthy changes in the incidences of nonneoplastic lesions of the kidney, jejunum, and Peyer’s patch in male and female Wistar Han rats. No dose-related neoplasms were present. Summaries of the incidences of nonneoplastic lesions mentioned in this section are presented in Appendix F.
Kidney: Nephropathy occurred in all groups of dosed male Wistar Han rats with a positive trend with dose and a significantly increased incidence in the 1,250 mg/kg/day group compared to the vehicle control group (Table 11). This lesion, also known as chronic progressive nephropathy, also occurred in female Wistar Han rats administered ≥156 mg/kg/day, with a positive dose-related trend and a significantly increased incidence in the 1,250 mg/kg/day group compared to the vehicle control group (Table 11). Histologically, this lesion was characterized by focal to multifocal small clusters of tubules within the renal cortex that displayed cytoplasmic basophilia (regeneration), thickened basement membranes, and peritubular mononuclear cell infiltrates.
Renal tubule dilatation occurred in male and female Wistar Han rats with a positive trend with dose and a significantly increased incidence in the 1,250 mg/kg/day groups compared to the vehicle control groups (Table 11). This diagnosis was reserved for those cases with one or two large ectatic tubules within the renal medulla that frequently contained eosinophilic intraluminal material (Figure 4) without histological evidence of lower urinary tract obstruction in the tissue sections evaluated. When the lesion was adjacent to a focus of nephropathy, tubular dilatation was deemed to be part of nephropathy and not diagnosed separately.
The lesion of renal pelvis dilatation occurred with a positive trend for incidence in female Wistar Han rats (Table 11). This lesion was characterized by distention and dilatation of the renal pelvis and occurred without histological evidence of lower urinary tract obstruction in the tissue sections evaluated.
Jejunum: Lymphatic ectasia occurred in the jejunum in the 625 and 1,250 mg/kg/day male groups and in the 1,250 mg/kg/day female group (Table 12). A positive trend with dose was found for the incidence in males. This unique lesion was characterized as central lymphatic dilatation of the villous tips within the jejunum (Figure 5).
Peyer’s patch: Lymphatic ectasia occurred in the Peyer’s patches in the 156, 625, and 1,250 mg/kg/day groups of male Wistar Han rats, and in the 78, 312.5, and 1,250 mg/kg/day groups of female Wistar Han rats (Table 12). This lesion was characterized by a few discrete clear dilated lymphatics within the lymphoid tissue, usually located in the subepithelial dome region (Figure 5).
Mice
Two-week Study in B6C3F1/N Mice
All B6C3F1/N mice survived until study termination, and mean body weights of all dosed groups were within 7% of the vehicle control groups at measured time points (Table 13; Figure 6). No dose-related clinical observations were noted (Appendix F).
A significant increase in relative liver weight was observed in the 2,500 mg/kg/day group of female mice, as well as a positive trend (Table 14). There were no associated dose-related gross or microscopic findings (Appendix F).
Dose Selection Rationale for Three-month Studies in B6C3F1/N Mice
The same doses were used in the 3-month study in B6C3F1/N mice as were used in the 2-week study due to the lack of observed toxicity at the doses used in the 2-week study.
Three-month Study in B6C3F1/N Mice
All animals survived to study termination (Table 15). Mean body weights of RES-dosed male and female B6C3F1/N mice ranged from within 1%–10% of vehicle control animals and were not significantly different from vehicle control animals at any point during the study (Table 15; Figure 7). No dose-related clinical observations were noted (Appendix F).
No effects on hematological parameters were observed with RES exposure (Appendix F).
In male mice, absolute and relative liver weights were significantly increased in the highest dose group (2,500 mg/kg/day) relative to the vehicle control group (Table 16). In female mice, absolute heart weights were significantly decreased in the 1,250 and 2,500 mg/kg/day groups compared to the vehicle control group. Additionally, there were significant increases in relative kidney weights (1,250 and 2,500 mg/kg/day groups) and relative liver weights (625, 1,250, and 2,500 mg/kg/day groups) compared to the vehicle control group (Table 16). No other effects on organ weights were observed.
Reproductive parameters were evaluated in male mice in the 0, 625, 1,250, and 2,500 mg/kg/day groups. There were no significant differences in testis or epididymis weights, testicular sperm count, or percent motile sperm (Table 17). Cauda epididymis sperm counts were 24%, 14%, and 13% lower than the vehicle control group in the 625, 1,250, and 2,500 mg/kg/day groups, respectively, with only the 625 mg/kg/day group attaining statistical significance (Table 17). Histopathological lesions were not observed in either the epididymis or testis.
Vaginal cytology evaluations were conducted in female mice in the 0, 625, 1,250, and 2,500 mg/kg/day groups. Cycle length and number of cycles in RES-dosed mice were not significantly different from vehicle control mice (Appendix F). The 625 and 2,500 mg/kg/day groups spent less time in estrus and more time in metestrus than the vehicle control group (Appendix F). Extended diestrus was more prevalent in all RES-dosed groups relative to the vehicle control group. Although there were some apparent changes in estrus and metestrus in RES-dosed mice, they were minimal in magnitude and not dose dependent (Appendix F).
Histopathology
This section describes the statistically significant or biologically noteworthy changes in the incidence of nonneoplastic lesions of the nose in female B6C3F1/N mice. No dose-related neoplasms were present. Summaries of the nonneoplastic lesions mentioned in this section are presented in Appendix F.
Nose: Respiratory metaplasia of the olfactory epithelium occurred with a positive dose-related trend and a significantly increased incidence in the 2,500 mg/kg/day female dosed group relative to the vehicle control group (Table 18). This lesion is characterized by focally extensive areas of replacement of olfactory epithelium with columnar ciliated respiratory epithelium. This change was most often present in the dorsal aspect of the nasal cavity at Level II (Figure 8).
Other lesions: There were positive trends with dose in the occurrence of kidney nephropathy in male mice, kidney mineralization in female mice, and mixed cell infiltration in the livers of male and female mice (Appendix F), but the biological significance of these lesions is unknown.
Genetic Toxicology
RES (33 to 3,333 μg/plate) was not mutagenic in Salmonella typhimurium strains TA98, TA100, or TA102 when tested with or without exogenous metabolic activation provided by Aroclor 1254-induced rat liver S9 and cofactors (Table E-1).
In rats, the reticulocyte population is the only red blood cell population that can be accurately assessed for micronucleus frequency in peripheral blood due to efficient splenic scavenging of damaged erythrocytes soon after they emerge from the bone marrow. In both sexes of Wistar Han rats in the 3-month study, there were no significant increases in the frequencies of micronucleated reticulocytes (polychromatic erythrocytes; PCEs) (Table E-2). A positive trend in the percentage of PCEs was observed in female Wistar Han rats; however, the absolute increase (0.38%) in the 1,250 mg/kg/day group compared to the vehicle control group was small and was not considered to be biologically relevant.
No increases in the frequency of micronucleated erythrocytes (either immature or mature) were seen in the peripheral blood of female B6C3F1/N mice in the 3-month study (Table E-3). Significant increases in micronucleated mature erythrocytes (NCEs) were observed for every dosed group in male B6C3F1/N mice. However, the absolute difference in micronucleated NCEs in the dosed groups relative to the vehicle control group ranged from 0.06% to 0.16%. These small increases were not considered biologically relevant.
Discussion
Trans-resveratrol (RES) has captured the attention of researchers and clinicians for years as a potential treatment or preventive natural product for various conditions, including cancer, cardiometabolic diseases, and neurodegenerative diseases. The development of novel techniques and strategies to improve its bioavailability and bioefficacy suggests continued prevalence and use of RES both therapeutically and in consumer products. Due to its low bioavailability, RES used in dietary supplements and in clinical trials can be found at high concentrations, with doses up to 5 g per day. The National Toxicology Program (NTP) conducted the present studies to address key knowledge gaps in resveratrol safety, especially those for perinatal RES exposure.
The doses used in the present studies approximate human exposure. Oral doses of 2.5 and 5 g RES in humans, as used in some clinical studies,59 are similar to an oral gavage dose of 312.5 and 625 mg/kg/day in rats (625 and 1,250 mg/kg/day in mice), after adjusting for body surface area.151 For example, 625 mg/kg exposure in rats corresponds to a human equivalent dose (HED) of 101.4 mg/kg, or a single oral dose of 6.1 to 9.1 g, accounting for human body weight ranging from 60 to 90 kg. These HEDs are 1.2- to 1.8-fold higher than the doses used in clinical studies. Furthermore, a toxicokinetic study of RES in the same strains of rodents showed that systemic exposures following a single gavage dose at the same dose levels used in this study were within an order of magnitude of those observed in a clinical study.59 Rat-to-human exposure multiples calculated using internal exposure measures, maximum concentration (Cmax), and area under the concentration-time curve (AUC), were 2.2–3.4-fold and 9.4–10.4-fold, respectively.59 Thus, the internal doses in the present study in animals are similar to what could be expected with therapeutic use of RES in humans. The 5-day exposure paradigm in these rodent studies likely affected the amount of time animals maintained a steady-state internal dose, given the rapid metabolism of RES, but may not have affected the findings substantially given the length of the study. Overall, however, these internal concentrations are higher than would be expected after moderate RES supplementation or from RES obtained from foods.
59. Mutlu E, Gibbs ST, South N, Pierfelice J, Burback B, Germolec D, Waidyanatha S. Comparative toxicokinetics of Trans-resveratrol and its major metabolites in Harlan Sprague Dawley rats and B6C3F1/N mice following oral and intravenous administration. Toxicol Appl Pharmacol. 2020; 394:114962. DOI: 10.1016/j.taap.2020.114962 PubMed: 32205187
151. Reagan-Shaw S, Nihal M, Ahmad N. Dose translation from animal to human studies revisited. FASEB J. 2008; 22(3):659-661. DOI: 10.1096/fj.07-9574LSF PubMed: 17942826
59. Mutlu E, Gibbs ST, South N, Pierfelice J, Burback B, Germolec D, Waidyanatha S. Comparative toxicokinetics of Trans-resveratrol and its major metabolites in Harlan Sprague Dawley rats and B6C3F1/N mice following oral and intravenous administration. Toxicol Appl Pharmacol. 2020; 394:114962. DOI: 10.1016/j.taap.2020.114962 PubMed: 32205187
59. Mutlu E, Gibbs ST, South N, Pierfelice J, Burback B, Germolec D, Waidyanatha S. Comparative toxicokinetics of Trans-resveratrol and its major metabolites in Harlan Sprague Dawley rats and B6C3F1/N mice following oral and intravenous administration. Toxicol Appl Pharmacol. 2020; 394:114962. DOI: 10.1016/j.taap.2020.114962 PubMed: 32205187
Given the potential use of RES in women of child-bearing age, perinatal exposure was included in the current Wistar Han rat study. In this study, there were no significant effects of RES on reproductive parameters. Lower mean body weights and body weight gains of dams in dosed groups ≥156 mg RES/kg body weight/day (mg/kg/day) during late gestation were observed. There were no dose-related effects on total or live litter size, pup survival, or pup weight on postnatal day (PND) 1. These findings corroborate previous studies in rodents that show no significant effects on litter size or reproduction after exposure to RES during gestation.85,87,93,152 Throughout lactation, male and female Wistar Han rat pups exposed to RES (≥312.5 mg/kg/day) had lower mean body weights than the vehicle control groups, which potentially could be due to maternal effects and/or postnatal effects on the pups. These animals were exposed to RES in utero and during lactation, both via milk and (starting on PND 12) via direct oral gavage. However, by the end of the 3-month study, RES-dosed Wistar Han rat offspring had similar mean body weights compared to vehicle control animals. A similar growth pattern was observed in a study of spontaneously hypertensive rats given RES in the diet from the beginning of gestation through PND 21 (4 g/kg diet).152 Assuming feed consumption of approximately 20 g/animal/day and an average body weight of 300 g during gestation, the maternal exposure would be equivalent to 270 mg/kg/day in that study. Although there was no effect of gestational RES exposure on maternal or fetal body weight, mean body weights of offspring from RES-dosed dams were lower (17%) than vehicle control animals by PND 21; dams continued to consume RES in the diet during lactation.152 By 5 weeks of age, there was no difference in body weights among the offspring.152 The authors of that study proposed RES may affect offspring growth by altering quantity or quality of milk production via altered prolactin synthesis, as shown in Chao et al.153 Taken together, the findings suggested a developmental effect of RES resulting in growth retardation, potentially due to effects on the dam during gestation or lactation.152
85. Williams LD, Burdock GA, Edwards JA, Beck M, Bausch J. Safety studies conducted on high-purity trans-resveratrol in experimental animals. Food Chem Toxicol. 2009; 47(9):2170-2182. DOI: 10.1016/j.fct.2009.06.002 PubMed: 19505523
87. Elliott PJ, Walpole S, Morelli L, Lambert PD, Lunsmann W, Westphal CH, Lavu S. Resveratrol/SRT-501. Drugs Future. 2009; 34(4):291. DOI: 10.1358/dof.2009.034.04.1360696
93. Kyselova V, Peknicova J, Buckiova D, Boubelik M. Effects of p-nonylphenol and resveratrol on body and organ weight and in vivo fertility of outbred CD-1 mice. Reprod Biol Endocrinol. 2003; 1:30. DOI: 10.1186/1477-7827-1-30 PubMed: 12749770
152. Care AS, Sung MM, Panahi S, Gragasin FS, Dyck JRB, Davidge ST, Bourque SL. Perinatal resveratrol supplementation to spontaneously hypertensive rat dams mitigates the development of hypertension in adult offspring. Hypertension. 2016; 67(5):1038-1044. DOI: 10.1161/HYPERTENSIONAHA.115.06793 PubMed: 26928803
152. Care AS, Sung MM, Panahi S, Gragasin FS, Dyck JRB, Davidge ST, Bourque SL. Perinatal resveratrol supplementation to spontaneously hypertensive rat dams mitigates the development of hypertension in adult offspring. Hypertension. 2016; 67(5):1038-1044. DOI: 10.1161/HYPERTENSIONAHA.115.06793 PubMed: 26928803
152. Care AS, Sung MM, Panahi S, Gragasin FS, Dyck JRB, Davidge ST, Bourque SL. Perinatal resveratrol supplementation to spontaneously hypertensive rat dams mitigates the development of hypertension in adult offspring. Hypertension. 2016; 67(5):1038-1044. DOI: 10.1161/HYPERTENSIONAHA.115.06793 PubMed: 26928803
152. Care AS, Sung MM, Panahi S, Gragasin FS, Dyck JRB, Davidge ST, Bourque SL. Perinatal resveratrol supplementation to spontaneously hypertensive rat dams mitigates the development of hypertension in adult offspring. Hypertension. 2016; 67(5):1038-1044. DOI: 10.1161/HYPERTENSIONAHA.115.06793 PubMed: 26928803
153. Chao W, Xuexin Z, Jun S, Ming C, Hua J, Li G, Tan C, Xu W. Effects of resveratrol on cell growth and prolactin synthesis in GH3 cells. Exp Ther Med. 2014; 7(4):923-928. DOI: 10.3892/etm.2014.1544 PubMed: 24669252
152. Care AS, Sung MM, Panahi S, Gragasin FS, Dyck JRB, Davidge ST, Bourque SL. Perinatal resveratrol supplementation to spontaneously hypertensive rat dams mitigates the development of hypertension in adult offspring. Hypertension. 2016; 67(5):1038-1044. DOI: 10.1161/HYPERTENSIONAHA.115.06793 PubMed: 26928803
In the current Wistar Han rat studies, RES and its metabolites were found in dam plasma and in whole fetuses and pups, with no clear sex difference. Internal concentrations of RES in this study were lower than doses commonly used for in vitro studies, such as those that evaluate genetic toxicity. The presence of RES and its metabolites in fetal tissue suggested low maternal transfer, and the presence of RES and its metabolites in PND 4 whole pups suggested lactational transfer. Data regarding maternal RES concentrations during pregnancy or RES in breast milk or amniotic fluid is limited and only include RES concentrations. In a study of Japanese macaques exposed to 0.37% RES via the diet during pregnancy, gestational transfer of RES was reported with slightly higher RES concentrations measured in the plasma of the fetus than the dam.61 Another study in rats described placental transfer of RES following exposure to 4 g/kg RES via the diet from gestation day (GD) 7 to GD 21.62 RES metabolites were detected in the fetuses and pups in the current study, generally with more trans-resveratrol-3-O-B-D-glucuronide (trans-R3G) than trans-resveratrol-3-sulfate (trans-R3S) and a low percentage of transfer from the dams. Because some sulfotransferases, but very few uridine 5'-diphospho-glucuronosyl transferases, are found in fetal livers,154 some metabolism (i.e., sulfonation) might occur in the fetus; however, it is more likely that most of the RES metabolites detected in the fetus have crossed the placenta. Because RES and its metabolites were detected in fetuses and pups, developmental effects of RES could be related to direct effects of RES or metabolite exposure in addition to indirect effects through the dam.
61. Roberts VH, Pound LD, Thorn SR, Gillingham MB, Thornburg KL, Friedman JE, Frias AE, Grove KL. Beneficial and cautionary outcomes of resveratrol supplementation in pregnant nonhuman primates. FASEB J. 2014; 28(6):2466-2477. DOI: 10.1096/fj.13-245472 PubMed: 24563374
62. Bourque SL, Dolinsky VW, Dyck JRB, Davidge ST. Maternal resveratrol treatment during pregnancy improves adverse fetal outcomes in a rat model of severe hypoxia. Placenta. 2012; 33(5):449-452. DOI: 10.1016/j.placenta.2012.01.012 PubMed: 22321195
154. Moscovitz JE, Aleksunes LM. Establishment of metabolism and transport pathways in the rodent and human fetal liver. Int J Mol Sci. 2013; 14(12):23801-23827. DOI: 10.3390/ijms141223801 PubMed: 24322441
RES exposure has been associated with decreased body weights of similar magnitude in other rat studies. In a 13-week exposure study in adult Wistar rats, mean body weights and body weight gains were approximately 10% lower in the highest exposure group (750 mg/kg/day via the diet) compared to control animals starting at week 4 and throughout the remainder of the study.85 In CD Virus Antibody Free (VAF) rats administered RES via oral gavage for four weeks, terminal mean body weights of male rats were 12% lower than vehicle control animals; however, in females, mean body weights were slightly higher than vehicle control animals (2%) in the high dose group (3,000 mg/kg/day).86 Another 90-day oral gavage study in CD (Crl:CD[SD]IGS) rats showed no effect on body weights in males and slight reductions (8%–9%) in females during weeks 10–13 at the 1,000 mg/kg/day dose.88 In the current study, B6C3F1/N mice administered RES did not have significant differences in body weight. Similarly, in a multigenerational drinking water study in CD-1 (ICR) mice, male and female RES-exposed mice in the parental generation had 6%–9% lower mean body weights than control animals, which was not significant; there was no appreciable difference in the F1 generation.93 Decreased body weight is a common endpoint for establishing the no-observed-effect level (NOEL) in other rodent studies of RES. The NOELs in the present study were 156 mg/kg/day in rats and 312 mg/kg/day in mice, which are consistent with findings in other oral administration studies that report NOELs in rats of 200,88 300,86 and 75085 mg/kg/day.
85. Williams LD, Burdock GA, Edwards JA, Beck M, Bausch J. Safety studies conducted on high-purity trans-resveratrol in experimental animals. Food Chem Toxicol. 2009; 47(9):2170-2182. DOI: 10.1016/j.fct.2009.06.002 PubMed: 19505523
86. Crowell JA, Korytko PJ, Morrissey RL, Booth TD, Levine BS. Resveratrol-associated renal toxicity. Toxicol Sci. 2004; 82(2):614-619. DOI: 10.1093/toxsci/kfh263 PubMed: 15329443
88. Johnson WD, Morrissey RL, Usborne AL, Kapetanovic I, Crowell JA, Muzzio M, McCormick DL. Subchronic oral toxicity and cardiovascular safety pharmacology studies of resveratrol, a naturally occurring polyphenol with cancer preventive activity. Food Chem Toxicol. 2011; 49(12):3319-3327. DOI: 10.1016/j.fct.2011.08.023 PubMed: 21939727
93. Kyselova V, Peknicova J, Buckiova D, Boubelik M. Effects of p-nonylphenol and resveratrol on body and organ weight and in vivo fertility of outbred CD-1 mice. Reprod Biol Endocrinol. 2003; 1:30. DOI: 10.1186/1477-7827-1-30 PubMed: 12749770
88. Johnson WD, Morrissey RL, Usborne AL, Kapetanovic I, Crowell JA, Muzzio M, McCormick DL. Subchronic oral toxicity and cardiovascular safety pharmacology studies of resveratrol, a naturally occurring polyphenol with cancer preventive activity. Food Chem Toxicol. 2011; 49(12):3319-3327. DOI: 10.1016/j.fct.2011.08.023 PubMed: 21939727
86. Crowell JA, Korytko PJ, Morrissey RL, Booth TD, Levine BS. Resveratrol-associated renal toxicity. Toxicol Sci. 2004; 82(2):614-619. DOI: 10.1093/toxsci/kfh263 PubMed: 15329443
85. Williams LD, Burdock GA, Edwards JA, Beck M, Bausch J. Safety studies conducted on high-purity trans-resveratrol in experimental animals. Food Chem Toxicol. 2009; 47(9):2170-2182. DOI: 10.1016/j.fct.2009.06.002 PubMed: 19505523
Dose-related histopathological findings in the current studies consisted of renal and intestinal lesions in Wistar Han rats and nasal lesions in B6C3F1/N mice. The renal lesions in Wistar Han rats consisted of nephropathy and renal tubule dilatation in male and female rats and renal pelvis dilatation in female rats. The nephropathy lesions were of minimal severity and characterized by focal to multifocal small clusters of proximal tubules within the renal cortex that displayed cytoplasmic basophilia (regeneration), thickened basement membranes, and peritubular mononuclear cell infiltrates. This lesion is also known as chronic progressive nephropathy (CPN) and is a spontaneous background lesion in rodents whose incidence/severity may be exacerbated by various chemicals.155 The exact etiology of CPN is unknown, but it is influenced by various physiological factors such as caloric intake, dietary protein content, and male hormones. In young adult rats, the early lesion consists of foci of basophilic proximal tubules with crowded nuclei and/or a thickened basement membrane. With age, the lesion progresses and may present prominent hyaline casts in the medullary region, tubule atrophy, tubule dilatation, focal glomerular sclerosis, glomerular atrophy, mononuclear cell infiltration and transitional cell hyperplasia of the renal pelvis lining. Renal tubule dilatation was diagnosed when it occurred in the renal medullary region and was not associated with any histological evidence of nephropathy or lower urinary tract obstruction. Typically, only one or a few tubules were affected, and the dilated tubules frequently contained an eosinophilic intraluminal material, consistent with protein. The renal pelvis dilatation occurred with a positive trend in female Wistar Han rats only and was characterized by distention of the renal pelvis without histological evidence of lower urinary tract obstruction and without renal papilla atrophy. Although there are many etiologies associated with this lesion, most are due to lower urinary tract obstruction. In this study, the cause was undetermined. Some of the same renal lesions were also reported in a 28-day rat study.86 Lesions observed included tubule dilatation, papillary necrosis, hyperplasia of the pelvic epithelium, and nephropathy, among others. Most lesions occurred in the male and female 3,000 mg/kg/day dosed groups.86
155. National Toxicology Program (NTP). NTP nonneoplastic lesion atlas- Renal, kidney. Research Triangle Park, NC: U.S. Department of Health and Human Services, National Institutes of Health, National Toxicology Program. https://ntp.niehs.nih.gov/nnl/urinary/kidney/necp/index.htm
86. Crowell JA, Korytko PJ, Morrissey RL, Booth TD, Levine BS. Resveratrol-associated renal toxicity. Toxicol Sci. 2004; 82(2):614-619. DOI: 10.1093/toxsci/kfh263 PubMed: 15329443
86. Crowell JA, Korytko PJ, Morrissey RL, Booth TD, Levine BS. Resveratrol-associated renal toxicity. Toxicol Sci. 2004; 82(2):614-619. DOI: 10.1093/toxsci/kfh263 PubMed: 15329443
The intestinal lesions in male and female Wistar Han rats consisted of minimal to mild lymphatic ectasia of the lacteals within the jejunum villous tips and the lymphatic vessels in the subepithelial dome region of the Peyer’s patches. This lesion is also known as lymphangiectasis.156 The cause of the lymphatic ectasia in these tissues was not determined. The jejunum contains lacteals that are lymphatic capillaries in the villous tips. These function to absorb products from the breakdown of dietary fats (fatty acids and glycerol). The lacteals can merge to form larger lymphatic vessels that transport chyle via the lymphatic system to the thoracic duct where it is emptied into the blood stream. Peyer’s patches are a part of this lymphatic system, presenting as prominent masses of lymphatic tissue located in the submucosa and lamina propria throughout the rodent small intestine. Lymphatics within the Peyer’s patches are involved in the lymphatic drainage of the intestines and function in immune surveillance. A similar histological finding was described in an NTP study of Fischer 344 (F344/N) rats administered indole-3-carbinol via oral gavage.157 These animals demonstrated a dose-related dilatation of lymphatics (lymphangiectasis) of the duodenum, jejunum, and mesenteric lymph nodes. Material within dilated lacteals stained with Oil Red O and Sudan black, consistent with lipid accumulation. Electron microscopic evaluation confirmed extracellular lipid accumulation within the villar lamina propria, lacteals, and within villar macrophages. It was suggested that the accumulation of large lipid droplets was possibly due to an impairment of lipid transport in the lacteals. For a more detailed description of lipid transport, see Friedman and Nylund.158
156. Nolte T, Brander-Weber P, Dangler C, Deschl U, Elwell MR, Greaves P, Hailey R, Leach MW, Pandiri AR, Rogers A, et al. Nonproliferative and proliferative lesions of the gastrointestinal tract, pancreas and salivary glands of the rat and mouse. J Toxicol Pathol. 2016; 29(1 Suppl):1S-125S. DOI: 10.1293/tox.29.1S PubMed: 26973378
157. Boyle MC, Crabbs TA, Wyde ME, Painter JT, Hill GD, Malarkey DE, Lieuallen WG, Nyska A. Intestinal lymphangiectasis and lipidosis in rats following subchronic exposure to indole-3-carbinol via oral gavage. Toxicol Pathol. 2012; 40(4):561-576. DOI: 10.1177/0192623311436178 PubMed: 22328411
158. Friedman HI, Nylund B. Intestinal fat digestion, absorption, and transport. A review. Am J Clin Nutr. 1980; 33(5):1108-1139. DOI: 10.1093/ajcn/33.5.1108 PubMed: 6989228
The dose-related nasal lesion in female B6C3F1/N mice consisted of respiratory metaplasia of the olfactory epithelium. Respiratory metaplasia in this study was of minimal severity and defined as transformation or replacement of olfactory epithelium with a more resistant, ciliated, columnar epithelium that resembles respiratory epithelium. The presence of this metaplasia implies that loss of olfactory epithelium has occurred through necrosis or atrophy and is considered an adaptive change. The lesions were focally extensive and occurred most often in the dorsal aspect (dorsal medial meatus) of the nasal cavity at Level II. Mechanisms of exposure of nasal tissues to toxicants in noninhalation studies can be via the bloodstream or via regurgitation/reflux, inhalation of volatiles from the stomach, or by exhaling the parent or a toxic metabolite.159 Metabolism of a parent compound or metabolites that arrive from the blood stream may occur in respiratory tissues and studies have shown that significant enzymatic activity occurs in the cytoplasm of olfactory epithelium; the resulting metabolism may detoxify a material or result in a more toxic metabolite.159,160
159. Sells DM, Brix AE, Nyska A, Jokinen MP, Orzech DP, Walker NJ. Respiratory tract lesions in noninhalation studies. Toxicol Pathol. 2007; 35(1):170-177. DOI: 10.1080/01926230601059969 PubMed: 17325986
159. Sells DM, Brix AE, Nyska A, Jokinen MP, Orzech DP, Walker NJ. Respiratory tract lesions in noninhalation studies. Toxicol Pathol. 2007; 35(1):170-177. DOI: 10.1080/01926230601059969 PubMed: 17325986
160. Reed CJ. Drug metabolism in the nasal cavity: Relevance to toxicology. Drug Metab Rev. 1993; 25(1-2):173-205. DOI: 10.3109/03602539308993975 PubMed: 8449146
RES-dosed male and female mice had higher liver weights than vehicle control animals, with significantly increased relative weights among the ≥625 mg/kg/day female dosed groups and significantly increased absolute and relative weights in the 2,500 mg/kg/day male dosed group. These organ weight changes did not correlate with any microscopic observations. Hepatomegaly was also reported in CD male and female rats given 1,000 mg/kg/day for 13 weeks, along with increases in bilirubin.88 In that study, there was no microscopic evidence of hepatotoxicity. The increase in liver weight observed may be due to induction of hepatic enzymes involved in metabolism and/or antioxidant pathways.33
88. Johnson WD, Morrissey RL, Usborne AL, Kapetanovic I, Crowell JA, Muzzio M, McCormick DL. Subchronic oral toxicity and cardiovascular safety pharmacology studies of resveratrol, a naturally occurring polyphenol with cancer preventive activity. Food Chem Toxicol. 2011; 49(12):3319-3327. DOI: 10.1016/j.fct.2011.08.023 PubMed: 21939727
33. Baur JA, Sinclair DA. Therapeutic potential of resveratrol: The in vivo evidence. Nat Rev Drug Discov. 2006; 5(6):493-506. DOI: 10.1038/nrd2060 PubMed: 16732220
Data from Wistar Han rats and B6C3F1/N mice presented here provide little indication of reproductive toxicity in males and females. There were no significant differences in testes weights and no microscopic findings in the male or female reproductive tracts of rats or mice. Differences in cauda epididymis sperm count and alterations in vaginal cytology in B6C3F1/N mice were not considered related to dose as they were small in magnitude and not consistently dose dependent. Similarly, other studies in rodents report no change in reproductive organ weight or histopathology at doses up to 1,000 mg/kg/day85,88 or no significant differences in sperm count/quality, ovarian morphology, or estrous cycling at doses up to 750 mg/kg/day.85,93 There have been indications, however, of an effect of lower doses of RES on reproductive biology. In Sprague Dawley rats administered 20 mg/kg/day via gavage for 90 days, sperm counts were higher in RES-dosed rats, accompanied by increases in seminiferous tubule density, but without changes in testes weight or sperm quality.95 In addition, RES consumption was linked to increased ovary weight and disrupted estrous cycling in Sprague Dawley rats exposed to 100 μM RES in drinking water.161 While the differences in findings could be attributed to hormetic effects of RES, evidence for such is limited to in vitro and a few in vivo studies.162 Additional studies evaluating the dose response of the reproductive effects would help clarify these disparate findings and the underlying mechanisms.
85. Williams LD, Burdock GA, Edwards JA, Beck M, Bausch J. Safety studies conducted on high-purity trans-resveratrol in experimental animals. Food Chem Toxicol. 2009; 47(9):2170-2182. DOI: 10.1016/j.fct.2009.06.002 PubMed: 19505523
88. Johnson WD, Morrissey RL, Usborne AL, Kapetanovic I, Crowell JA, Muzzio M, McCormick DL. Subchronic oral toxicity and cardiovascular safety pharmacology studies of resveratrol, a naturally occurring polyphenol with cancer preventive activity. Food Chem Toxicol. 2011; 49(12):3319-3327. DOI: 10.1016/j.fct.2011.08.023 PubMed: 21939727
85. Williams LD, Burdock GA, Edwards JA, Beck M, Bausch J. Safety studies conducted on high-purity trans-resveratrol in experimental animals. Food Chem Toxicol. 2009; 47(9):2170-2182. DOI: 10.1016/j.fct.2009.06.002 PubMed: 19505523
93. Kyselova V, Peknicova J, Buckiova D, Boubelik M. Effects of p-nonylphenol and resveratrol on body and organ weight and in vivo fertility of outbred CD-1 mice. Reprod Biol Endocrinol. 2003; 1:30. DOI: 10.1186/1477-7827-1-30 PubMed: 12749770
95. Juan ME, Gonzalez-Pons E, Munuera T, Ballester J, Rodriguez-Gil JE, Planas JM. trans-Resveratrol, a natural antioxidant from grapes, increases sperm output in healthy rats. J Nutr. 2005; 135(4):757-760. DOI: 10.1093/jn/135.4.757 PubMed: 15795430
161. Henry LA, Witt DM. Resveratrol: Phytoestrogen effects on reproductive physiology and behavior in female rats. Horm Behav. 2002; 41(2):220-228. DOI: 10.1006/hbeh.2001.1754 PubMed: 11855907
162. Calabrese EJ, Mattson MP, Calabrese V. Resveratrol commonly displays hormesis: Occurrence and biomedical significance. Hum Exp Toxicol. 2010; 29(12):980-1015. DOI: 10.1177/0960327110383625 PubMed: 21115559
Under the conditions of this study, the lowest-observed-effect level (LOEL) was 312.5 mg/kg/day in rats as indicated by significantly decreased pup mean body weights of Wistar Han rats exposed perinatally. These body weight differences were resolved in the rat pups by the end of the 3-month study. In B6C3F1/N mice, the LOEL was 625 mg/kg/day as indicated by significantly increased relative liver weights in females; however, these changes in liver weight were not associated with microscopic lesions. The no-observed-effect levels were 156 mg/kg/day in rats and 312 mg/kg/day in mice. Target organs included the kidney and small intestine in rats and the nose in female mice. There was no evidence of genetic toxicity in the micronucleus assay of RES at oral gavage doses up to 1,250 mg/kg/day in Wistar Han rats or up to 2,500 mg/kg/day in B6C3F1/N mice. No clear effects on reproductive parameters were observed. The presence of RES and its metabolites in fetal tissue suggested low maternal transfer, and the presence of RES and its metabolites in PND 4 whole pups suggested lactational transfer.
References
1. ChemSpider. Structure search. 2021. https://www.chemspider.com/StructureSearch.aspx
2. Fritzemeier KH, Kindl H. Coordinate induction by UV-light of stillbene synthase phenylalanine ammonia-lyase and cinnamate 4-hydrolas in leaves of vitaceae. Planta. 1981; 151:48-52. DOI: 10.1007/BF00384236 PubMed: 24301669
3. Hasan M, Bae H. An overview of stress-induced resveratrol synthesis in grapes: Perspectives for resveratrol-enriched grape products. Molecules. 2017; 22(2):294. DOI: 10.3390/molecules22020294 PubMed: 28216605
4. Trela BC, Waterhouse AL. Resveratrol: Isomeric molar absorptivities and stability. J Agric Food Chem. 1996; 44(5):1253-1257. DOI: 10.1021/jf9504576
5. Flieger J, Tatarczak-Michalewska M, Blicharska E. Characterization of the cis/trans isomerization of resveratrol by high-performance liquid chromatography. Anal Lett. 2017; 50(2):294-303. DOI: 10.1080/00032719.2016.1178756
6. Herbig ME, Evers DH. Correlation of hydrotropic solubilization by urea with logD of drug molecules and utilization of this effect for topical formulations. Eur J Pharm Biopharm. 2013; 85(1):158-160. DOI: 10.1016/j.ejpb.2013.06.022 PubMed: 23958327
7. Amri A, Chaumeil JC, Sfar S, Charrueau C. Administration of resveratrol: What formulation solutions to bioavailability limitations? J Control Release. 2012; 158(2):182-193. DOI: 10.1016/j.jconrel.2011.09.083 PubMed: 21978644
8. O’Neil M. Resveratrol. In: O’Neil M, editor. The Merck Index- An Encyclopedia of Chemicals, Drugs, and Biologicals. Cambridge, UK: Royal Society of Chemistry; 2013. p. 1515.
9. Hanawa F, Tahara S, Mizutani J. Antifungal stress compounds from Veratrum grandiflorum leaves treated with cupric chloride. Phytochemistry. 1992; 31(9):3005-3007. DOI: 10.1016/0031-9422(92)83436-3
10. Frémont L. Biological effects of resveratrol. Life Sci. 2000; 66(8):663-673. DOI: 10.1016/S0024-3205(99)00410-5 PubMed: 10680575
11. Burns J, Yokota T, Ashihara H, Lean ME, Crozier A. Plant foods and herbal sources of resveratrol. J Agric Food Chem. 2002; 50(11):3337-3340. DOI: 10.1021/jf0112973 PubMed: 12010007
12. Lyons MM, Yu C, Toma RB, Cho SY, Reiboldt W, Lee J, van Breemen RB. Resveratrol in raw and baked blueberries and bilberries. J Agric Food Chem. 2003; 51(20):5867-5870. DOI: 10.1021/jf034150f PubMed: 13129286
13. Shrikanta A, Kumar A, Govindaswamy V. Resveratrol content and antioxidant properties of underutilized fruits. J Food Sci Technol. 2015; 52(1):383-390. DOI: 10.1007/s13197-013-0993-z PubMed: 25593373
14. Soleas GJ, Diamandis EP, Goldberg DM. Resveratrol: A molecule whose time has come? And gone? Clin Biochem. 1997; 30(2):91-113. DOI: 10.1016/S0009-9120(96)00155-5 PubMed: 9127691
15. Lamuela-Raventos RM, Waterhouse AL. Occurrence of resveratrol in selected California wines by a new HPLC method. J Agric Food Chem. 1993; 41(4):521-523. DOI: 10.1021/jf00028a001
16. McMurtrey K. Resveratrol in wine. In: Watkins TR, editor. Wine: Nutritional and Therapeutic Benefits. Washington, D.C.: American Chemical Society; 1997. p. 44–55. DOI: 10.1021/bk-1997-0661.ch005
17. Romero-Pérez AI, Lamuela-Raventós RM, Waterhouse AL, de la Torre-Boronat MC. Levels of cis- and trans-resveratrol and their glucosides in white and rosé Vitis vinifera wines from Spain. J Agric Food Chem. 1996; 44(8):2124-2128. DOI: 10.1021/jf9507654
18. Adrian M, Jeandet P, Bessis R, Joubert JM. Induction of phytoalexin (resveratrol) synthesis in grapevine leaves treated with aluminum chloride (AlCl3). J Agric Food Chem. 1996; 44(8):1979-1981. DOI: 10.1021/jf950807o
19. Jeandet P, Bessis R, Adrian M, Yvin J, Joubert JM. inventors. Use of aluminum chloride as a resveratrol synthesis elicitor. United States patent 06080701; 2000
20. Cantos E, Garcia Viguera C, De Pascual Teresa S, Tomas Berberan FA. Effect of postharvest ultraviolet irradiation on resveratrol and other phenolics of cv. Napolean table grapes. J Agric Food Chem. 2000; 48(10):4606-4612. DOI: 10.1021/jf0002948 PubMed: 11052707
21. Calderón AA, Zapata JM, Muñoz R, Pedreño MA, Ros Barceló A. Resveratrol production as a part of the hypersensitive-like response of grapevine cells to an elicitor from Trichoderma viride. New Phytol. 1993; 124(3):455-463. DOI: 10.1111/j.1469-8137.1993.tb03836.x
22. Stark-Lorenzen P, Nelke B, Hänßler G, Mühlbach HP, Thomzik JE. Transfer of a grapevine stilbene synthase gene to rice (Oryza sativa L.). Plant Cell Rep. 1997; 16(10):668-673. DOI: 10.1007/s002990050299 PubMed: 30727616
23. National Toxicology Program (NTP). NTP technical report on the toxicology and carcinogenesis studies of 2,3,7,8-tetrachlorodibenzo-p-dioxin (TCDD) (CAS No. 1746-01-6) in female Harlan Sprague-Dawley rats (gavage studies). Research Triangle Park, NC: U.S. Department of Health and Human Services, National Institutes of Health, National Toxicology Program; 2006. Technical Report No. 521. https://ntp.niehs.nih.gov/publications/reports/tr/tr521 PubMed: 16835633
24. Hipskind JD, Paiva NL. Constitutive accumulation of a resveratrol-glucoside in transgenic alfalfa increases resistance to Phoma medicaginis. Mol Plant Microbe Interact. 2000; 13(5):551-562. DOI: 10.1094/MPMI.2000.13.5.551 PubMed: 10796021
25. Morelli R, Das S, Bertelli A, Bollini R, Lo Scalzo R, Das DK, Falchi M. The introduction of the stilbene synthase gene enhances the natural antiradical activity of Lycopersicon esculentum mill. Mol Cell Biochem. 2006; 282(1-2):65-73. DOI: 10.1007/s11010-006-1260-7 PubMed: 16317513
26. Edwards JA, Beck M, Riegger C, Bausch J. Safety of resveratrol with examples for high purity, trans-resveratrol, resVida. Ann N Y Acad Sci. 2011; 1215(1):131-137. DOI: 10.1111/j.1749-6632.2010.05855.x PubMed: 21261651
27. Biasutto L, Mattarei A, Azzolini M, La Spina M, Sassi N, Romio M, Paradisi C, Zoratti M. Resveratrol derivatives as a pharmacological tool. Ann N Y Acad Sci. 2017; 1403(1):27-37. DOI: 10.1111/nyas.13401 PubMed: 28675763
28. Hendler SS, Rorvik D. Resveratrol. In: Hendler SS, Rorvik D, editors. PDR for Nutritional Supplements. Montvale, NJ: Medical Economics/Thomson Healthcare; 2001. p. 397–401.
29. Ramírez-Garza SL, Laveriano-Santos EP, Marhuenda-Muñoz M, Storniolo CE, Tresserra-Rimbau A, Vallverdú-Queralt A, Lamuela-Raventós RM. Health effects of resveratrol: Results from human intervention trials. Nutrients. 2018; 10(12):1892. DOI: 10.3390/nu10121892 PubMed: 30513922
30. Szkudelski T, Szkudelska K. Resveratrol and diabetes: From animal to human studies. Biochim Biophys Acta. 2015; 1852(6):1145-1154. DOI: 10.1016/j.bbadis.2014.10.013 PubMed: 25445538
31. Bonnefont-Rousselot D. Resveratrol and cardiovascular diseases. Nutrients. 2016; 8(5):250. DOI: 10.3390/nu8050250 PubMed: 27144581
32. Wahab A, Gao K, Jia C, Zhang F, Tian G, Murtaza G, Chen J. Significance of resveratrol in clinical management of chronic diseases. Molecules. 2017; 22(8):1329. DOI: 10.3390/molecules22081329 PubMed: 28820474
33. Baur JA, Sinclair DA. Therapeutic potential of resveratrol: The in vivo evidence. Nat Rev Drug Discov. 2006; 5(6):493-506. DOI: 10.1038/nrd2060 PubMed: 16732220
34. Oliveira ALB, Monteiro VVS, Navegantes-Lima KC, Reis JF, Gomes RS, Rodrigues DVS, Gaspar SLF, Monteiro MC. Resveratrol role in autoimmune disease-A mini-review. Nutrients. 2017; 9(12). DOI: 10.3390/nu9121306 PubMed: 29194364
35. Malaguarnera L. Influence of resveratrol on the immune response. Nutrients. 2019; 11(5). DOI: 10.3390/nu11050946 PubMed: 31035454
36. Sinha D, Sarkar N, Biswas J, Bishayee A. Resveratrol for breast cancer prevention and therapy: Preclinical evidence and molecular mechanisms. Semin Cancer Biol. 2016; 40-41:209-232. DOI: 10.1016/j.semcancer.2015.11.001 PubMed: 26774195
37. Camins A, Junyent F, Verdaguer E, Beas-Zarate C, Rojas-Mayorquín AE, Ortuño-Sahagún D, Pallàs M. Resveratrol: An antiaging drug with potential therapeutic applications in treating diseases. Pharmaceuticals (Basel). 2009; 2(3):194-205. DOI: 10.3390/ph2030194 PubMed: 27713233
38. Sales JM, Resurreccion AV. Resveratrol in peanuts. Crit Rev Food Sci Nutr. 2014; 54(6):734-770. DOI: 10.1080/10408398.2011.606928 PubMed: 24345046
39. Farneti B, Masuero D, Costa F, Magnago P, Malnoy M, Costa G, Vrhovsek U, Mattivi F. Is there room for improving the nutraceutical composition of apple? J Agric Food Chem. 2015; 63(10):2750-2759. DOI: 10.1021/acs.jafc.5b00291 PubMed: 25723891
40. Wine Institute. US wine consumption. 2018. https://wineinstitute.org/our-industry/statistics/us-wine-consumption
41. Stervbo U, Vang O, Bonnesen C. A review of the content of the putative chemopreventative phytoalexin resveratrol in red wine. Food Chem. 2007; 101(2):449-457. DOI: 10.1016/j.foodchem.2006.01.047
42. McMurtrey KD, Minn J, Pobanz K, Schultz TP. Analysis of wines for resveratrol using direct injection high-pressure liquid chromatography with electrochemical detection. J Agric Food Chem. 1994; 42(10):2077-2080. DOI: 10.1021/jf00046a001
43. Sobolev VS, Cole RJ. Trans-resveratrol content in commercial peanuts and peanut products. J Agric Food Chem. 1999; 47(4):1435-1439. DOI: 10.1021/jf9809885 PubMed: 10563995
44. The Peanut Institute. History of peanuts, consumption, and affordability. https://peanut-institute.com/peanut-facts/history-of-peanuts-consumption-affordability/
45. Zamora-Ros R, Andres-Lacueva C, Lamuela-Raventos RM, Berenguer T, Jakszyn P, Martinez C, Sanchez MJ, Navarro C, Chirlaque MD, Tormo MJ, et al. Concentrations of resveratrol and derivatives in foods and estimation of dietary intake in a Spanish population: European Prospective Investigation into Cancer and Nutrition (EPIC)-Spain cohort. Br J Nutr. 2008; 100(1):188-196. DOI: 10.1017/S0007114507882997 PubMed: 18096094
46. Lu Y, Zamora-Ros R, Chan S, Cross AJ, Ward H, Jakszyn P, Luben R, Opstelten JL, Oldenburg B, Hallmans G, et al. Dietary polyphenols in the aetiology of Crohn’s disease and ulcerative colitis-A multicenter European Prospective Cohort Study (EPIC). Inflamm Bowel Dis. 2017; 23(12):2072-2082. DOI: 10.1097/MIB.0000000000001108 PubMed: 28837515
47. Levi F, Pasche C, Lucchini F, Ghidoni R, Ferraroni M, La Vecchia C. Resveratrol and breast cancer risk. Eur J Cancer Prev. 2005; 14(2):139-142. DOI: 10.1097/00008469-200504000-00009 PubMed: 15785317
48. Siedlinski M, Boer JM, Smit HA, Postma DS, Boezen HM. Dietary factors and lung function in the general population: Wine and resveratrol intake. Eur Respir J. 2012; 39(2):385-391. DOI: 10.1183/09031936.00184110 PubMed: 21852339
49. Patel KR, Scott E, Brown VA, Gescher AJ, Steward WP, Brown K. Clinical trials of resveratrol. Ann N Y Acad Sci. 2011; 1215:161-169. DOI: 10.1111/j.1749-6632.2010.05853.x PubMed: 21261655
50. Web MD. Resveratrol supplements. https://www.webmd.com/heart-disease/resveratrol-supplements
51. Axe J. Resveratrol: The anti-aging powerhouse that’s good for the heart, brain and waistline. 2017. https://draxe.com/all-about-resveratrol/
52. Ratz-Łyko A, Arct J. Resveratrol as an active ingredient for cosmetic and dermatological applications: A review. J Cosmet Laser Ther. 2019; 21(2):84-90. DOI: 10.1080/14764172.2018.1469767 PubMed: 29737899
53. Ndiaye M, Philippe C, Mukhtar H, Ahmad N. The grape antioxidant resveratrol for skin disorders: Promise, prospects, and challenges. Arch Biochem Biophys. 2011; 508(2):164-170. DOI: 10.1016/j.abb.2010.12.030 PubMed: 21215251
54. Code of Federal Regulations (CFR). 21(Section 190.6).
55. Cottart CH, Nivet-Antoine V, Laguillier-Morizot C, Beaudeux JL. Resveratrol bioavailability and toxicity in humans. Mol Nutr Food Res. 2010; 54(1):7-16. DOI: 10.1002/mnfr.200900437 PubMed: 20013887
56. Gambini J, Ingles M, Olaso G, Lopez-Grueso R, Bonet-Costa V, Gimeno-Mallench L, Mas-Bargues C, Abdelaziz KM, Gomez-Cabrera MC, Vina J, et al. Properties of resveratrol: In vitro and in vivo studies about metabolism, bioavailability, and biological effects in animal models and humans. Oxid Med Cell Longev. 2015; 2015:837042. DOI: 10.1155/2015/837042 PubMed: 26221416
57. Kapetanovic IM, Muzzio M, Huang Z, Thompson TN, McCormick DL. Pharmacokinetics, oral bioavailability, and metabolic profile of resveratrol and its dimethylether analog, pterostilbene, in rats. Cancer Chemother Pharmacol. 2011; 68(3):593-601. DOI: 10.1007/s00280-010-1525-4 PubMed: 21116625
58. Marier JF, Vachon P, Gritsas A, Zhang J, Moreau JP, Ducharme MP. Metabolism and disposition of resveratrol in rats: Extent of absorption, glucuronidation, and enterohepatic recirculation evidenced by a linked-rat model. J Pharmacol Exp Ther. 2002; 302(1):369-373. DOI: 10.1124/jpet.102.033340 PubMed: 12065739
59. Mutlu E, Gibbs ST, South N, Pierfelice J, Burback B, Germolec D, Waidyanatha S. Comparative toxicokinetics of Trans-resveratrol and its major metabolites in Harlan Sprague Dawley rats and B6C3F1/N mice following oral and intravenous administration. Toxicol Appl Pharmacol. 2020; 394:114962. DOI: 10.1016/j.taap.2020.114962 PubMed: 32205187
60. Bertelli AA, Giovannini L, Stradi R, Bertelli A, Tillement JP. Plasma, urine and tissue levels of trans- and cis-resveratrol (3,4′,5-trihydroxystilbene) after short-term or prolonged administration of red wine to rats. Int J Tissue React. 1996; 18(2-3):67-71. PubMed: 9063768
61. Roberts VH, Pound LD, Thorn SR, Gillingham MB, Thornburg KL, Friedman JE, Frias AE, Grove KL. Beneficial and cautionary outcomes of resveratrol supplementation in pregnant nonhuman primates. FASEB J. 2014; 28(6):2466-2477. DOI: 10.1096/fj.13-245472 PubMed: 24563374
62. Bourque SL, Dolinsky VW, Dyck JRB, Davidge ST. Maternal resveratrol treatment during pregnancy improves adverse fetal outcomes in a rat model of severe hypoxia. Placenta. 2012; 33(5):449-452. DOI: 10.1016/j.placenta.2012.01.012 PubMed: 22321195
63. Menet MC, Baron S, Taghi M, Diestra R, Dargere D, Laprevote O, Nivet-Antoine V, Beaudeux JL, Bedarida T, Cottart CH. Distribution of trans-resveratrol and its metabolites after acute or sustained administration in mouse heart, brain, and liver. Mol Nutr Food Res. 2017; 61(8). DOI: 10.1002/mnfr.201600686 PubMed: 28160405
64. Böhmdorfer M, Szakmary A, Schiestl RH, Vaquero J, Riha J, Brenner S, Thalhammer T, Szekeres T, Jäger W. Involvement of UDP-glucuronosyltransferases and sulfotransferases in the excretion and tissue distribution of resveratrol in mice. Nutrients. 2017; 9(12):1347. DOI: 10.3390/nu9121347 PubMed: 29231856
65. Alberdi G, Rodriguez VM, Miranda J, Macarulla MT, Arias N, Andres-Lacueva C, Portillo MP. Changes in white adipose tissue metabolism induced by resveratrol in rats. Nutr Metab (Lond). 2011; 8(1):29. DOI: 10.1186/1743-7075-8-29 PubMed: 21569266
66. Andres-Lacueva C, Macarulla MT, Rotches-Ribalta M, Boto-Ordonez M, Urpi-Sarda M, Rodriguez VM, Portillo MP. Distribution of resveratrol metabolites in liver, adipose tissue, and skeletal muscle in rats fed different doses of this polyphenol. J Agric Food Chem. 2012; 60(19):4833-4840. DOI: 10.1021/jf3001108 PubMed: 22533982
67. Detampel P, Beck M, Krähenbühl S, Huwyler J. Drug interaction potential of resveratrol. Drug Metab Rev. 2012; 44(3):253-265. DOI: 10.3109/03602532.2012.700715 PubMed: 22788578
68. Vitrac X, Desmouliere A, Brouillaud B, Krisa S, Deffieux G, Barthe N, Rosenbaum J, Merillon JM. Distribution of [14C]-trans-resveratrol, a cancer chemopreventive polyphenol, in mouse tissues after oral administration. Life Sci. 2003; 72(20):2219-2233. DOI: 10.1016/S0024-3205(03)00096-1 PubMed: 12628442
69. El-Mohsen MA, Bayele H, Kuhnle G, Gibson G, Debnam E, Kaila Srai S, Rice-Evans C, Spencer JP. Distribution of [3H]trans-resveratrol in rat tissues following oral administration. Br J Nutr. 2006; 96(1):62-70. DOI: 10.1079/BJN20061810 PubMed: 16869992
70. Murakami I, Chaleckis R, Pluskal T, Ito K, Hori K, Ebe M, Yanagida M, Kondoh H. Metabolism of skin-absorbed resveratrol into its glucuronized form in mouse skin. PLoS One. 2014; 9(12):e115359. DOI: 10.1371/journal.pone.0115359 PubMed: 25506824
71. Maier-Salamon A, Bohmdorfer M, Riha J, Thalhammer T, Szekeres T, Jaeger W. Interplay between metabolism and transport of resveratrol. Ann N Y Acad Sci. 2013; 1290:98-106. DOI: 10.1111/nyas.12198 PubMed: 23855471
72. Muzzio M, Huang Z, Hu SC, Johnson WD, McCormick DL, Kapetanovic IM. Determination of resveratrol and its sulfate and glucuronide metabolites in plasma by LC-MS/MS and their pharmacokinetics in dogs. J Pharm Biomed Anal. 2012; 59:201-208. DOI: 10.1016/j.jpba.2011.10.023 PubMed: 22079044
73. Walle T, Hsieh F, DeLegge MH, Oatis JE Jr, Walle UK. High absorption but very low bioavailability of oral resveratrol in humans. Drug Metab Dispos. 2004; 32(12):1377-1382. DOI: 10.1124/dmd.104.000885 PubMed: 15333514
74. Boocock DJ, Faust GE, Patel KR, Schinas AM, Brown VA, Ducharme MP, Booth TD, Crowell JA, Perloff M, Gescher AJ, et al. Phase I dose escalation pharmacokinetic study in healthy volunteers of resveratrol, a potential cancer chemopreventive agent. Cancer Epidemiol Biomarkers Prev. 2007; 16(6):1246-1252. DOI: 10.1158/1055-9965.EPI-07-0022 PubMed: 17548692
75. Brown VA, Patel KR, Viskaduraki M, Crowell JA, Perloff M, Booth TD, Vasilinin G, Sen A, Schinas AM, Piccirilli G, et al. Repeat dose study of the cancer chemopreventive agent resveratrol in healthy volunteers: Safety, pharmacokinetics, and effect on the insulin-like growth factor axis. Cancer Res. 2010; 70(22):9003-9011. DOI: 10.1158/0008-5472.CAN-10-2364 PubMed: 20935227
76. Nunes T, Almeida L, Rocha JF, Falcao A, Fernandes-Lopes C, Loureiro AI, Wright L, Vaz-da-Silva M, Soares-da-Silva P. Pharmacokinetics of trans-resveratrol following repeated administration in healthy elderly and young subjects. J Clin Pharmacol. 2009; 49(12):1477-1482. DOI: 10.1177/0091270009339191 PubMed: 19797536
77. Bode LM, Bunzel D, Huch M, Cho GS, Ruhland D, Bunzel M, Bub A, Franz CM, Kulling SE. In vivo and in vitro metabolism of trans-resveratrol by human gut microbiota. Am J Clin Nutr. 2013; 97(2):295-309. DOI: 10.3945/ajcn.112.049379 PubMed: 23283496
78. Goldberg DM, Yan J, Soleas GJ. Absorption of three wine-related polyphenols in three different matrices by healthy subjects. Clin Biochem. 2003; 36(1):79-87. DOI: 10.1016/S0009-9120(02)00397-1 PubMed: 12554065
79. Meng X, Maliakal P, Lu H, Lee MJ, Yang CS. Urinary and plasma levels of resveratrol and quercetin in humans, mice, and rats after ingestion of pure compounds and grape juice. J Agric Food Chem. 2004; 52(4):935-942. DOI: 10.1021/jf030582e PubMed: 14969553
80. la Porte C, Voduc N, Zhang G, Seguin I, Tardiff D, Singhal N, Cameron DW. Steady-state pharmacokinetics and tolerability of trans-resveratrol 2000 mg twice daily with food, quercetin and alcohol (ethanol) in healthy human subjects. Clin Pharmacokinet. 2010; 49(7):449-454. DOI: 10.2165/11531820-000000000-00000 PubMed: 20528005
81. Vitaglione P, Sforza S, Galaverna G, Ghidini C, Caporaso N, Vescovi PP, Fogliano V, Marchelli R. Bioavailability of trans-resveratrol from red wine in humans. Mol Nutr Food Res. 2005; 49(5):495-504. DOI: 10.1002/mnfr.200500002 PubMed: 15830336
82. Aumont V, Krisa S, Battaglia E, Netter P, Richard T, Merillon JM, Magdalou J, Sabolovic N. Regioselective and stereospecific glucuronidation of trans- and cis-resveratrol in human. Arch Biochem Biophys. 2001; 393(2):281-289. DOI: 10.1006/abbi.2001.2496 PubMed: 11556815
83. Patel KR, Brown VA, Jones DJ, Britton RG, Hemingway D, Miller AS, West KP, Booth TD, Perloff M, Crowell JA, et al. Clinical pharmacology of resveratrol and its metabolites in colorectal cancer patients. Cancer Res. 2010; 70(19):7392-7399. DOI: 10.1158/0008-5472.CAN-10-2027 PubMed: 20841478
84. Howells LM, Berry DP, Elliott PJ, Jacobson EW, Hoffmann E, Hegarty B, Brown K, Steward WP, Gescher AJ. Phase I randomized, double-blind pilot study of micronized resveratrol (SRT501) in patients with hepatic metastases—safety, pharmacokinetics, and pharmacodynamics. Cancer Prev Res (Phila). 2011; 4(9):1419-1425. DOI: 10.1158/1940-6207.CAPR-11-0148 PubMed: 21680702
85. Williams LD, Burdock GA, Edwards JA, Beck M, Bausch J. Safety studies conducted on high-purity trans-resveratrol in experimental animals. Food Chem Toxicol. 2009; 47(9):2170-2182. DOI: 10.1016/j.fct.2009.06.002 PubMed: 19505523
86. Crowell JA, Korytko PJ, Morrissey RL, Booth TD, Levine BS. Resveratrol-associated renal toxicity. Toxicol Sci. 2004; 82(2):614-619. DOI: 10.1093/toxsci/kfh263 PubMed: 15329443
87. Elliott PJ, Walpole S, Morelli L, Lambert PD, Lunsmann W, Westphal CH, Lavu S. Resveratrol/SRT-501. Drugs Future. 2009; 34(4):291. DOI: 10.1358/dof.2009.034.04.1360696
88. Johnson WD, Morrissey RL, Usborne AL, Kapetanovic I, Crowell JA, Muzzio M, McCormick DL. Subchronic oral toxicity and cardiovascular safety pharmacology studies of resveratrol, a naturally occurring polyphenol with cancer preventive activity. Food Chem Toxicol. 2011; 49(12):3319-3327. DOI: 10.1016/j.fct.2011.08.023 PubMed: 21939727
89. Horn TL, Cwik MJ, Morrissey RL, Kapetanovic I, Crowell JA, Booth TD, McCormick DL. Oncogenicity evaluation of resveratrol in p53(+/-) (p53 knockout) mice. Food Chem Toxicol. 2007; 45(1):55-63. DOI: 10.1016/j.fct.2006.07.015 PubMed: 16965847
90. Chow HHS, Garland LL, Hsu C-H, Vining DR, Chew WM, Miller JA, Perloff M, Crowell JA, Alberts DS. Resveratrol modulates drug- and carcinogen-metabolizing enzymes in a healthy volunteer study. Cancer Prev Res (Phila). 2010; 3(9):1168-1175. DOI: 10.1158/1940-6207.CAPR-09-0155 PubMed: 20716633
91. Cottart CH, Nivet-Antoine V, Beaudeux JL. Review of recent data on the metabolism, biological effects, and toxicity of resveratrol in humans. Mol Nutr Food Res. 2014; 58(1):7-21. DOI: 10.1002/mnfr.201200589 PubMed: 23740855
92. Brâkenhielm E, Cao R, Cao Y. Suppression of angiogenesis, tumor growth, and wound healing by resveratrol, a natural compound in red wine and grapes. FASEB J. 2001; 15(10):1798-1800. DOI: 10.1096/fj.01-0028fje PubMed: 11481234
93. Kyselova V, Peknicova J, Buckiova D, Boubelik M. Effects of p-nonylphenol and resveratrol on body and organ weight and in vivo fertility of outbred CD-1 mice. Reprod Biol Endocrinol. 2003; 1:30. DOI: 10.1186/1477-7827-1-30 PubMed: 12749770
94. Kim IQ, Marikawa Y. Embryoid body test with morphological and molecular endpoints implicates potential developmental toxicity of trans-resveratrol. Toxicol Appl Pharmacol. 2018; 355:211-225. DOI: 10.1016/j.taap.2018.07.006 PubMed: 29990529
95. Juan ME, Gonzalez-Pons E, Munuera T, Ballester J, Rodriguez-Gil JE, Planas JM. trans-Resveratrol, a natural antioxidant from grapes, increases sperm output in healthy rats. J Nutr. 2005; 135(4):757-760. DOI: 10.1093/jn/135.4.757 PubMed: 15795430
96. Bowers JL, Tyulmenkov VV, Jernigan SC, Klinge CM. Resveratrol acts as a mixed agonist/antagonist for estrogen receptors alpha and beta. Endocrinology. 2000; 141(10):3657-3667. DOI: 10.1210/endo.141.10.7721 PubMed: 11014220
97. Gehm BD, McAndrews JM, Chien PY, Jameson JL. Resveratrol, a polyphenolic compound found in grapes and wine, is an agonist for the estrogen receptor. Proc Natl Acad Sci USA. 1997; 94(25):14138-14143. DOI: 10.1073/pnas.94.25.14138 PubMed: 9391166
98. Banu SK, Stanley JA, Sivakumar KK, Arosh JA, Burghardt RC. Resveratrol protects the ovary against chromium-toxicity by enhancing endogenous antioxidant enzymes and inhibiting metabolic clearance of estradiol. Toxicol Appl Pharmacol. 2016; 303:65-78. DOI: 10.1016/j.taap.2016.04.016 PubMed: 27129868
99. Atli M, Engin-Ustun Y, Tokmak A, Caydere M, Hucumenoglu S, Topcuoglu C. Dose dependent effect of resveratrol in preventing cisplatin-induced ovarian damage in rats: An experimental study. Reprod Biol. 2017; 17(3):274-280. DOI: 10.1016/j.repbio.2017.07.001 PubMed: 28716446
100. Alamo A, Condorelli RA, Mongioi LM, Cannarella R, Giacone F, Calabrese V, La Vignera S, Calogero AE. Environment and male fertility: Effects of benzo-alpha-pyrene and resveratrol on human sperm function in vitro. J Clin Med. 2019; 8(4). DOI: 10.3390/jcm8040561 PubMed: 31027257
101. Ourique GM, Pes TS, Saccol EM, Finamor IA, Glanzner WG, Baldisserotto B, Pavanato MA, Goncalves PB, Barreto KP. Resveratrol prevents oxidative damage and loss of sperm motility induced by long-term treatment with valproic acid in Wistar rats. Exp Toxicol Pathol. 2016; 68(8):435-443. DOI: 10.1016/j.etp.2016.07.001 PubMed: 27432062
102. Singh I, Goyal Y, Ranawat P. Potential chemoprotective role of resveratrol against cisplatin induced testicular damage in mice. Chem Biol Interact. 2017; 273:200-211. DOI: 10.1016/j.cbi.2017.05.024 PubMed: 28606469
103. Ortega I, Duleba AJ. Ovarian actions of resveratrol. Ann N Y Acad Sci. 2015; 1348(1):86-96. DOI: 10.1111/nyas.12875 PubMed: 26315293
104. Liu MJ, Sun AG, Zhao SG, Liu H, Ma SY, Li M, Huai YX, Zhao H, Liu HB. Resveratrol improves in vitro maturation of oocytes in aged mice and humans. Fertil Steril. 2018; 109(5):900-907. DOI: 10.1016/j.fertnstert.2018.01.020 PubMed: 29778389
105. Wong DH, Villanueva JA, Cress AB, Duleba AJ. Effects of resveratrol on proliferation and apoptosis in rat ovarian theca-interstitial cells. Mol Hum Reprod. 2010; 16(4):251-259. DOI: 10.1093/molehr/gaq002 PubMed: 20067985
106. Banaszewska B, Wrotynska-Barczynska J, Spaczynski RZ, Pawelczyk L, Duleba AJ. Effects of resveratrol on polycystic ovary syndrome: A double-blind, randomized, placebo-controlled trial. J Clin Endocrinol Metab. 2016; 101(11):4322-4328. DOI: 10.1210/jc.2016-1858 PubMed: 27754722
107. Huang MC, White KL, Elmore SA, Guo TL, Germolec D. Immunotoxicity studies of trans-resveratrol in male B6C3F1/N mice. J Immunotoxicol. 2020; 17(1):194-201. DOI: 10.1080/1547691X.2020.1833113 PubMed: 33213203
108. Espinoza JL, Trung LQ, Inaoka PT, Yamada K, An DT, Mizuno S, Nakao S, Takami A. The repeated administration of resveratrol has measurable effects on circulating T-cell subsets in humans. Oxid Med Cell Longev. 2017; 2017:6781872. DOI: 10.1155/2017/6781872 PubMed: 28546852
109. Moussa C, Hebron M, Huang X, Ahn J, Rissman RA, Aisen PS, Turner RS. Resveratrol regulates neuro-inflammation and induces adaptive immunity in Alzheimer’s disease. J Neuroinflammation. 2017; 14(1):1. DOI: 10.1186/s12974-016-0779-0 PubMed: 28086917
110. Di Renzo L, Marsella LT, Carraro A, Valente R, Gualtieri P, Gratteri S, Tomasi D, Gaiotti F, De Lorenzo A. Changes in LDL oxidative status and oxidative and inflammatory gene expression after red wine intake in healthy people: A randomized trial. Mediators Inflamm. 2015; 2015:317348. DOI: 10.1155/2015/317348 PubMed: 26101461
111. Matsuoka A, Furuta A, Ozaki M, Fukuhara K, Miyata N. Resveratrol, a naturally occurring polyphenol, induces sister chromatid exchanges in a Chinese hamster lung (CHL) cell line. Mutat Res. 2001; 494(1-2):107-113. DOI: 10.1016/S1383-5718(01)00184-X PubMed: 11423350
112. Schmitt E, Lehmann L, Metzler M, Stopper H. Hormonal and genotoxic activity of resveratrol. Toxicol Lett. 2002; 136(2):133-142. DOI: 10.1016/S0378-4274(02)00290-4 PubMed: 12425963
113. Guo X, Ni J, Dai X, Zhou T, Yang G, Xue J, Wang X. Biphasic regulation of spindle assembly checkpoint by low and high concentrations of resveratrol leads to the opposite effect on chromosomal instability. Mutat Res Genet Toxicol Environ Mutagen. 2018; 825:19-30. DOI: 10.1016/j.mrgentox.2017.11.004 PubMed: 29307372
114. Matsuoka A, Takeshita K, Furuta A, Ozaki M, Fukuhara K, Miyata N. The 4′-hydroxy group is responsible for the in vitro cytogenetic activity of resveratrol. Mutat Res. 2002; 521(1-2):29-35. DOI: 10.1016/S1383-5718(02)00211-5 PubMed: 12438001
115. Liu Y, Wu X, Hu X, Chen Z, Liu H, Takeda S, Qing Y. Multiple repair pathways mediate cellular tolerance to resveratrol-induced DNA damage. Toxicol In Vitro. 2017; 42:130-138. DOI: 10.1016/j.tiv.2017.04.017 PubMed: 28431926
116. Fukuhara K, Miyata N. Resveratrol as a new type of DNA-cleaving agent. Bioorg Med Chem Lett. 1998; 8(22):3187-3192. DOI: 10.1016/S0960-894X(98)00585-X PubMed: 9873700
117. Abraham SK, Khandelwal N, Hintzsche H, Stopper H. Antigenotoxic effects of resveratrol: Assessment of in vitro and in vivo response. Mutagenesis. 2016; 31(1):27-33. PubMed: 26152226
118. King-Herbert A, Thayer K. NTP workshop: Animal models for the NTP rodent cancer bioassay: Stocks and strains—should we switch? Toxicol Pathol. 2006; 34(6):802-805. DOI: 10.1080/01926230600935938 PubMed: 17162538
119. King-Herbert AP, Sills RC, Bucher JR. Commentary: Update on animal models for NTP studies. Toxicol Pathol. 2010; 38(1):180-181. DOI: 10.1177/0192623309356450 PubMed: 20019353
120. Hedrich HJ. Taxonomy and stocks and strains. In: Suckow M, Weisbroth S, Franklin C, editors. The Laboratory Rat. Burlington, MA: Elsevier Academic; 2006. p. 71–92. DOI: 10.1016/B978-012074903-4/50006-6
121. Maronpot RR, Boorman GA. Interpretation of rodent hepatocellular proliferative alterations and hepatocellular tumors in chemical safety assessment. Toxicol Pathol. 1982; 10(2):71-78. DOI: 10.1177/019262338201000210 PubMed: 28094716
122. Boorman GA, Haseman JK, Waters MD, Hardisty JF, Sills RC. Quality review procedures necessary for rodent pathology databases and toxicogenomic studies: The National Toxicology Program experience. Toxicol Pathol. 2002; 30(1):88-92. DOI: 10.1080/01926230252824752 PubMed: 11890481
123. Gart JJ, Chu KC, Tarone RE. Statistical issues in interpretation of chronic bioassay tests for carcinogenicity. J Natl Cancer Inst. 1979; 62(4):957-974. PubMed: 285297
124. Armitage P. Statistical Methods in Medical Research. Oxford: Blackwell; 1971.
125. Rao JN, Scott AJ. A simple method for the analysis of clustered binary data. Biometrics. 1992; 48(2):577-585. DOI: 10.2307/2532311 PubMed: 1637980
126. Fung KY, Krewski D, Rao JN, Scott AJ. Tests for trend in developmental toxicity experiments with correlated binary data. Risk Anal. 1994; 14(4):639-648. DOI: 10.1111/j.1539-6924.1994.tb00277.x PubMed: 7972964
127. Dunnett CW. A multiple comparison procedure for comparing several treatments with a control. J Am Stat Assoc. 1955; 50(272):1096-1121. DOI: 10.1080/01621459.1955.10501294
128. Williams DA. A test for differences between treatment means when several dose levels are compared with a zero dose control. Biometrics. 1971; 27(1):103-117. DOI: 10.2307/2528930 PubMed: 5547548
129. Williams DA. The comparison of several dose levels with a zero dose control. Biometrics. 1972; 28(2):519-531. DOI: 10.2307/2556164 PubMed: 5037867
130. Shirley E. A non-parametric equivalent of Williams’ test for contrasting increasing dose levels of a treatment. Biometrics. 1977; 33(2):386-389. DOI: 10.2307/2529789 PubMed: 884197
131. Williams DA. A note on Shirley’s nonparametric test for comparing several dose levels with a zero-doe control. Biometrics. 1986; 42(1):183-186. DOI: 10.2307/2531254 PubMed: 3719054
132. Dunn OJ. Multiple comparisons using rank sums. Technometrics. 1964; 6(3):241-252. DOI: 10.1080/00401706.1964.10490181
133. Jonckheere AR. A distribution-free k-sample test against ordered alternatives. Biometrika. 1954; 41(1-2):133-145. DOI: 10.1093/biomet/41.1-2.133
134. Davison AC, Hinkley DV. Bootstrap methods and their application. Cambridge, UK: Cambridge University Press; 1997. DOI: 10.1017/CBO9780511802843
135. Datta S, Satten GA. Rank-sum tests for clustered data. J Am Stat Assoc. 2005; 100(471):908-915. DOI: 10.1198/016214504000001583
136. Dixon W, Massey F. Introduction to statistical analysis. New York, NY: McGraw Hill Book Company Inc; 1957. DOI: 10.2307/2332898
137. Kalbfleisch JD, Lawless JF. The analysis of panel data under a Markov assumption. J Am Stat Assoc. 1985; 80(392):863-871. DOI: 10.1080/01621459.1985.10478195
138. Code of Federal Regulations (CFR). 21(Part 58).
139. Miller JA, Miller EC. Ultimate chemical carcinogens as reactive mutagenic electrophiles. In: Hiatt HH, Watson JD, Winsten JA, editors. Origins of Human Cancer. Cold Spring Harbor, NY: Cold Spring Harbor Laboratory; 1977. p. 605–627.
140. Straus DS. Somatic mutation, cellular differentiation, and cancer causation. J Natl Cancer Inst. 1981; 67:233-241. DOI: 10.1093/jnci/67.2.233 PubMed: 7021938
141. Crawford BD. Perspectives on the somatic mutation model of carcinogenesis. In: Mehlman MA, Flamm WG, Lorentzen RJ, editors. Advances in Modern Environmental Toxicology Mechanisms and Toxicity of Chemical Carcinogens and Mutagens. Princeton, NJ: Princeton Scientific Publishing Co. Inc; 1985. p. 13–59.
142. Ashby J, Tennant RW. Definitive relationships among chemical structure, carcinogenicity and mutagenicity for 301 chemicals tested by the US NTP. Mutat Res. 1991; 257(3):229-306. DOI: 10.1016/0165-1110(91)90003-E PubMed: 1707500
143. Tennant RW, Margolin BH, Shelby MD, Zeiger E, Haseman JK, Spalding J, Caspary W, Resnick M, Stasiewicz S, Anderson B, et al. Prediction of chemical carcinogenicity in rodents from in vitro genetic toxicity assays. Science. 1987; 236(4804):933-941. DOI: 10.1126/science.3554512 PubMed: 3554512
144. Zeiger E, Haseman JK, Shelby MD, Margolin BH, Tennant RW, Holden H. Evaluation of four in vitro genetic toxicity tests for predicting rodent carcinogenicity: Confirmation of earlier results with 41 additional chemicals. Environ Mol Mutagen. 1990; 16 Suppl 18:1-14. DOI: 10.1002/em.2850160502 PubMed: 2091921
145. Schmid W. The micronucleus test. Mutat Res. 1975; 31(1):9-15. DOI: 10.1016/0165-1161(75)90058-8 PubMed: 48190
146. Heddle JA, Hite M, Kirkhart B, Mavournin K, MacGregor JT, Newell GW, Salamone MF. The induction of micronuclei as a measure of genotoxicity. A report of the U.S. Environmental Protection Agency Gene-Tox Program. Mutat Res. 1983; 123(1):61-118. DOI: 10.1016/0165-1110(83)90047-7 PubMed: 6888413
147. Shelby MD, Erexson GL, Hook GJ, Tice RR. Evaluation of a three-exposure mouse bone marrow micronucleus protocol: Results with 49 chemicals. Environ Mol Mutagen. 1993; 21(2):160-179. DOI: 10.1002/em.2850210210 PubMed: 8444144
148. Shelby MD, Witt KL. Comparison results from mouse bone marrow chromosome aberration and micronucleus tests. Environ Mol Mutagen. 1995; 25:302-313. DOI: 10.1002/em.2850250407 PubMed: 7607185
149. Witt KL, Knapton A, Wehr CM, Hook GJ, Mirsalis J, Shelby MD, MacGregor JT. Micronucleated erythrocyte frequency in peripheral blood of B6C3F(1) mice from short-term, prechronic, and chronic studies of the NTP carcinogenesis bioassay program. Environ Mol Mutagen. 2000; 36(3):163–194. DOI: 10.1002/1098-2280(2000)36:3<163::AID-EM1>3.0.CO;2-P
150. National Toxicology Program (NTP). TOX-102: Toxicity report tables & curves pathology tables, survival and growth curves from NTP short-term and genetic toxicology studies. Research Triangle Park, NC: U.S. Department of Health and Human Services, National Institutes of Health, National Toxicology Program; 2020. DOI: 10.22427/NTP-DATA-TOX-102
151. Reagan-Shaw S, Nihal M, Ahmad N. Dose translation from animal to human studies revisited. FASEB J. 2008; 22(3):659-661. DOI: 10.1096/fj.07-9574LSF PubMed: 17942826
152. Care AS, Sung MM, Panahi S, Gragasin FS, Dyck JRB, Davidge ST, Bourque SL. Perinatal resveratrol supplementation to spontaneously hypertensive rat dams mitigates the development of hypertension in adult offspring. Hypertension. 2016; 67(5):1038-1044. DOI: 10.1161/HYPERTENSIONAHA.115.06793 PubMed: 26928803
153. Chao W, Xuexin Z, Jun S, Ming C, Hua J, Li G, Tan C, Xu W. Effects of resveratrol on cell growth and prolactin synthesis in GH3 cells. Exp Ther Med. 2014; 7(4):923-928. DOI: 10.3892/etm.2014.1544 PubMed: 24669252
154. Moscovitz JE, Aleksunes LM. Establishment of metabolism and transport pathways in the rodent and human fetal liver. Int J Mol Sci. 2013; 14(12):23801-23827. DOI: 10.3390/ijms141223801 PubMed: 24322441
155. National Toxicology Program (NTP). NTP nonneoplastic lesion atlas- Renal, kidney. Research Triangle Park, NC: U.S. Department of Health and Human Services, National Institutes of Health, National Toxicology Program. https://ntp.niehs.nih.gov/nnl/urinary/kidney/necp/index.htm
156. Nolte T, Brander-Weber P, Dangler C, Deschl U, Elwell MR, Greaves P, Hailey R, Leach MW, Pandiri AR, Rogers A, et al. Nonproliferative and proliferative lesions of the gastrointestinal tract, pancreas and salivary glands of the rat and mouse. J Toxicol Pathol. 2016; 29(1 Suppl):1S-125S. DOI: 10.1293/tox.29.1S PubMed: 26973378
157. Boyle MC, Crabbs TA, Wyde ME, Painter JT, Hill GD, Malarkey DE, Lieuallen WG, Nyska A. Intestinal lymphangiectasis and lipidosis in rats following subchronic exposure to indole-3-carbinol via oral gavage. Toxicol Pathol. 2012; 40(4):561-576. DOI: 10.1177/0192623311436178 PubMed: 22328411
158. Friedman HI, Nylund B. Intestinal fat digestion, absorption, and transport. A review. Am J Clin Nutr. 1980; 33(5):1108-1139. DOI: 10.1093/ajcn/33.5.1108 PubMed: 6989228
159. Sells DM, Brix AE, Nyska A, Jokinen MP, Orzech DP, Walker NJ. Respiratory tract lesions in noninhalation studies. Toxicol Pathol. 2007; 35(1):170-177. DOI: 10.1080/01926230601059969 PubMed: 17325986
160. Reed CJ. Drug metabolism in the nasal cavity: Relevance to toxicology. Drug Metab Rev. 1993; 25(1-2):173-205. DOI: 10.3109/03602539308993975 PubMed: 8449146
161. Henry LA, Witt DM. Resveratrol: Phytoestrogen effects on reproductive physiology and behavior in female rats. Horm Behav. 2002; 41(2):220-228. DOI: 10.1006/hbeh.2001.1754 PubMed: 11855907
162. Calabrese EJ, Mattson MP, Calabrese V. Resveratrol commonly displays hormesis: Occurrence and biomedical significance. Hum Exp Toxicol. 2010; 29(12):980-1015. DOI: 10.1177/0960327110383625 PubMed: 21115559
163. Zeiger E, Anderson B, Haworth S, Lawlor T, Mortelmans K. Salmonella mutagenicity tests: V. Results from the testing of 311 chemicals. Environ Mol Mutagen. 1992; 19 Suppl 21:2-141. DOI: 10.1002/em.2850190603 PubMed: 1541260
164. Witt KL, Livanos E, Kissling GE, Torous DK, Caspary W, Tice RR, Recio L. Comparison of flow cytometry- and microscopy-based methods for measuring micronucleated reticulocyte frequencies in rodents treated with nongenotoxic and genotoxic chemicals. Mutat Res. 2008; 649(1-2):101-113. DOI: 10.1016/j.mrgentox.2007.08.004 PubMed: 17869571
165. Dertinger SD, Camphausen K, MacGregor JT, Bishop ME, Torous DK, Avlasevich S, Cairns S, Tometsko CR, Menard C, Muanza T. Three‐color labeling method for flow cytometric measurement of cytogenetic damage in rodent and human blood. Environ Mol Mutagen. 2004; 44(5):427-435. DOI: 10.1002/em.20075 PubMed: 15517570
166. Kissling GE, Dertinger SD, Hayashi M, MacGregor JT. Sensitivity of the erythrocyte micronucleus assay: Dependence on number of cells scored and inter-animal variability. Mutat Res. 2007; 634(1-2):235-240. DOI: 10.1016/j.mrgentox.2007.07.010 PubMed: 17851117
Appendices
Appendix A. Chemical Characterization and Dose Formulation Studies
A.1. Procurement and Characterization
A.1.1. Trans-resveratrol
Trans-resveratrol (RES) was obtained from Bayville Chemical Supply Co. Inc. (Deer Park, NY) in a single lot (156AB). Identity, purity, and stability analyses were conducted by the analytical chemistry lab at RTI International (Research Triangle Park, NC). Reports on analyses performed in support of the RES study are on file at the National Institute of Environmental Health Sciences.
RES lot 156AB is a fine off-white powder with a melting point of 253.5°C. The identity of lot 156AB was evaluated using Fourier transform infrared (FT-IR) spectroscopy and 1H nuclear magnetic resonance (NMR) spectroscopy. Low-resolution mass spectrometry and high-resolution mass spectrometry were conducted by the analytical chemistry laboratory at RTI International (Research Triangle Park, NC) and the University of South Carolina (Columbia, SC), respectively. The FT-IR and 1H NMR spectra (Figure A-1 and Figure A-2) were consistent with the structure of RES, although no reference spectra were available. The low- and high-resolution mass spectra were consistent with the mass and structure of resveratrol.
Purity evaluation using high-performance liquid chromatography (HPLC) with ultraviolet (UV) detection was conducted with two different columns (Table A-1, Systems A and B). No impurities were identified using HPLC/UV, which could indicate that the minor diethyl ether and hexane impurities were eluted in the solvent front. Additionally, the presence of the cis-isomer of RES within the lot was evaluated using HPLC with a photodiode array (PDA) detector (Table A-1, System C). The cis-isomer was not detected with a limit of detection of 0.018% weight basis. Karl Fisher titration performed at Galbraith Laboratories (Knoxville, TN) indicated a water content of 0.24%. The overall purity of lot 156AB was determined to be >99%.
Accelerated stability studies were conducted using the HPLC/UV protocol outlined above (Table A-1, System A). Stability was confirmed when protected from light and stored for 2 weeks at refrigerated (5°C), room (25°C), elevated (60°C), and frozen (−20°C) temperatures. Short-term storage (up to 2 weeks) of RES at room temperature when protected from light was deemed acceptable. The bulk chemical was stored at −20°C and protected from light, per the manufacturer’s recommendations.
A.1.2. Methylcellulose
Methylcellulose used to make the 0.5% aqueous vehicle for gavage formulations was obtained from Spectrum (Gardena, CA) in three lots (UR1026, WL0069, and XB1050). Lot UR1026 was used in the 2-week studies and lots WL0069 and XB1050 were used in the 3-month studies.
The identity of the methylcellulose was confirmed by the study laboratory using FT-IR spectroscopy. Periodic purity analyses were performed by Galbraith Laboratories, Inc (Knoxville, TN) during the 3-month studies to determine the methoxy group content. The August 27, 2008 sample of lot WL0069, used to prepare the first dose formulation, had methoxy group content (32.2%) outside of the acceptance criteria of 27.5%–31.5%. A replacement lot (XB1050) was procured for the remaining formulations and was within the acceptance criteria for methoxy group content (29.3%).
Deionized water was used to make the 0.5% aqueous methylcellulose vehicle for gavage formulations.
A.2. Preparation and Analysis of Dose Formulations
Dose formulations of RES in 0.5% methylcellulose were prepared following the protocols outlined in Table A-2. Formulations of 15.6, 31.2, 62.5, 125, and 250 mg/mL were used in the 2-week study in Fischer 344 (F344/NTac) rats, the 3-month study in Wistar Han rats, and the 2-week and 3-month studies in B6C3F1/N mice (Table A-2). Formulation concentrations and homogeneity were evaluated using HPLC/UV (Table A-1, System A). The method of preparation was validated for concentration ranges of 15−500 mg/mL. The RES formulations were confirmed to be resuspended after overnight storage by using a Polytron blender. Homogeneity was confirmed in 15.6 mg/mL preparations of dose formulation.
Stability of 15.6 mg/mL and 500 mg/mL formulations was confirmed for 42 days when protected from light and stored at room (~25°C), refrigerated (5°C), and freezer (−20°C) temperatures. A dosing simulation study on the 15.6 mg/mL formulation found that it was stable when stored at room temperature in an open amber vessel for 3 hours.
Analyses of preadministration and postadministration dose formulations were conducted throughout the study by the study laboratory (Table A-3, Table A-4, Table A-5, Table A-6). Postadministration samples were collected from the bottles used to dose the animals. Two dose formulations (31.2 and 125 mg/mL) prepared for the 2-week studies were >10% above the target concentrations and were replaced by freshly prepared formulations that met criteria prior to administration. Postadministration samples of the 62.5 mg/mL dose formulation in the 2-week studies for mice and F344/NTac rats were 17.7% and 19.5% above the target concentration, respectively (Table A-3, Table A-4). All preadministration samples from the 3-month studies were within 10% of the target concentrations, except for a 125 mg/mL formulation prepared for the mouse study in September 2008 which was replaced by a freshly prepared formulation that met criteria prior to administration. Postadministration samples of the 125 and 250 mg/mL dose formulations prepared in September 2008 for the 3-month mice studies were 10.9% and 14.3% above the target concentrations, respectively. All other samples were within 10% of the target concentration (Table A-3, Table A-4, Table A-5, Table A-6).
Table A-1. Chromatography Systems Used in the Two-week and Three-month Gavage Studies of Trans-resveratrol
| Chromatography | Detection System | Column | Mobile Phase |
|---|---|---|---|
| System A | |||
| High-performance liquid chromatography | Ultraviolet (300 nm) | Zorbax Rx-C8 (250 mm × 4.6 mm ID) | A: water:methanol, pH ~4 (95:5) B: methanol:water, pH ~4 (90:10) Gradient program: A:B 90:10 for 5 minutes; 90:10 to 10:90 in 25 minutes; 10:90 to 90:10 in 20 minutes; hold at 90:10 for 10 minutes 1.0 mL/minute flow rate |
| System B | |||
| High-performance liquid chromatography | Ultraviolet (300 nm) | Waters Nova-Pak Phenyl 60Å (150 mm × 3.9 mm ID) | A: water:methanol, pH ~4 (95:5) B: methanol:water, pH ~4 (90:10) Gradient program: A:B 90:10 for 5 minutes; 90:10 to 10:90 in 25 minutes; 10:90 to 90:10 in 20 minutes; hold at 90:10 for 20 minutes 1.0 mL/minute flow rate |
| System C | |||
| High-performance liquid chromatography | Photodiode array (220–500 nm, extracted at 305 nm) | Waters Atlantis T3 C18 (100 mm × 2.1 mm ID, 3 μm particle size) with Waters Atlantis HILIC C18 guard (10 mm × 2.1 mm ID, 3 μm particle size) | A: 5 mM ammonium acetate in DI water:2-propanol (98:2, v/v) B: methanol:2-propanol (98:2, v/v) Gradient program: A:B 100:0 to 40:60 in 15 minutes; 40:60 to 0:100 in 0.5 minutes; hold at 0:100 for 2 minutes; 0:100 to 100:0 in 0.5 minutes; hold at 100:0 for 2 minutes 0.3 mL/minute flow rate |
Table A-2. Preparation and Storage of Dose Formulations in the Two-week and Three-month Gavage Studies of Trans-resveratrol
| Preparation |
|---|
| Formulations of trans-resveratrol (lot 156AB) in 0.5% methylcellulose were prepared by transferring an appropriate amount of trans-resveratrol (determined by weight) into a graduated centrifuge tube containing ~4 mL of 0.5% methylcellulose. The contents were mixed by vortex action and sonification, then stored in a refrigerator overnight. The following day, the tube was removed from the refrigerator and sonicated for 20 minutes. The formulations were brought to volume with 0.5% methylcellulose and liquified by mixing with a Polytron blender. |
| Chemical lot number |
| Lot 156AB (Bayville Chemical Supply Co. Inc.) |
| Maximum storage time |
| 42 days |
| Storage conditions |
| Clear glass bottled placed in amber bags stored at ~2°C−8°C (refrigerated) |
| Study laboratory |
| RTI International (Research Triangle Park, NC) |
Table A-3. Results of Analyses of Dose Formulations Administered to Male and Female F344/NTac Rats in the Two-week Gavage Study of Trans-resveratrol
| Date Prepared | Date Analyzed | Target Concentration (mg/mL) | Determined Concentration (mg/mL)a | Difference from Target (%) |
|---|---|---|---|---|
| October 2, 2006 | October 5–11, 2006 | 0 | BLOQ | NA |
| 15.6 | 15.25 ± 0.03 | −2.3 | ||
| 31.2b | 37.00 ± 0.07 | 18.6 | ||
| 62.5 | 68.58 ± 0.49 | 9.7 | ||
| 125b | 143.0 ± 1.0 | 14.4 | ||
| 250 | 270.4 ± 1.2 | 8.2 | ||
| October 12, 2006 | October 12–13, 2006 | 31.2 | 30.53 ± 0.37 | −2.1 |
| 125 | 121.7 ± 2.1 | −2.6 | ||
| Animal room samples | ||||
| October 2, 2006 | November 1–3, 2006 | 0 | BLOQ | NA |
| 15.6 | 15.95 ± 0.18 | 2.2 | ||
| 62.5 | 74.70 ± 0.39 | 19.5 | ||
| 250 | 276.1 ± 1.4 | 10.5 | ||
| October 12, 2006 | November 1–3, 2006 | 31.2 | 30.83 ± 0.17 | −1.2 |
| 125 | 119.2 ± 0.7 | −4.6 | ||
Table A-4. Results of Analyses of Dose Formulations Administered to Male and Female B6C3F1/N Mice in the Two-week Gavage Study of Trans-resveratrol
| Date Prepared | Date Analyzed | Target Concentration (mg/mL) | Determined Concentration (mg/mL)a | Difference from Target (%) |
|---|---|---|---|---|
| October 2, 2006 | October 5–11, 2006 | 0 | BLOQ | NA |
| 15.6 | 15.25 ± 0.03 | −2.3 | ||
| 31.2b | 37.00 ± 0.07 | 18.6 | ||
| 62.5 | 68.58 ± 0.49 | 9.7 | ||
| 125b | 143.0 ± 1.0 | 14.4 | ||
| 250 | 270.4 ± 1.2 | 8.2 | ||
| October 12, 2006 | October 12–13, 2006 | 31.2 | 30.53 ± 0.37 | −2.1 |
| 125 | 121.7 ± 2.1 | −2.6 | ||
| Animal room samples | ||||
| October 2, 2006 | November 1–3, 2006 | 0 | BLOQ | NA |
| 15.6 | 15.71 ± 0.07 | 0.7 | ||
| 62.5 | 73.58 ± 0.61 | 17.7 | ||
| 250 | 272.2 ± 2.0 | 8.9 | ||
| October 12, 2006 | November 1–3, 2006 | 31.2 | 30.61 ± 0.11 | −1.9 |
| 125 | 119.5 ± 3.8 | −4.4 | ||
Table A-5. Results of Analyses of Dose Formulations Administered to Male and Female Wistar Han Rats in the Three-month Gavage Study of Trans-resveratrol
| Date Prepared | Date Analyzed | Target Concentration (mg/mL) | Determined Concentration (mg/mL)a | Difference from Target (%) |
|---|---|---|---|---|
| October 1, 2008 | October 3, 2008 | 0 | BLOQ | NA |
| 15.6 | 16.3 ± 0.1 | 4.5 | ||
| 15.6 | 16.3 ± 0.1 | 4.5 | ||
| 15.6 | 16.1 ± 0.1 | 3.0 | ||
| 31.2 | 32.6 ± 0.1 | 4.4 | ||
| 31.2 | 32.1 ± 0.2 | 2.8 | ||
| 31.2 | 31.6 ± 0.3 | 1.4 | ||
| 62.5 | 65.0 ± 0.8 | 4.0 | ||
| 62.5 | 64.5 ± 0.2 | 3.2 | ||
| 62.5 | 65.4 ± 0.8 | 4.7 | ||
| 125 | 126 ± 1 | 1.1 | ||
| 125 | 130 ± 1 | 4.3 | ||
| 125 | 128 ± 1 | 2.7 | ||
| 250 | 257 ± 3 | 2.9 | ||
| 250 | 257 ± 2 | 2.8 | ||
| 250 | 260 ± 1 | 4.0 | ||
| October 22, 2008 | October 29, 2008 | 0 | BLOQ | NA |
| 15.6 | 15.8 ± 0.1 | 1.5 | ||
| 15.6 | 15.7 ± 0.1 | 0.8 | ||
| 15.6 | 15.6 ± 0.1 | 0.2 | ||
| 31.2 | 31.6 ± 0.3 | 1.4 | ||
| 31.2 | 31.5 ± 0.1 | 1.0 | ||
| 31.2 | 31.1 ± 0.1 | −0.4 | ||
| 62.5 | 63.3 ± 0.5 | 1.3 | ||
| 62.5 | 62.2 ± 0.2 | −0.5 | ||
| 62.5 | 62.9 ± 0.2 | 0.7 | ||
| 125 | 126 ± 0 | 0.8 | ||
| 125 | 125 ± 0 | 0.0 | ||
| 125 | 121 ± 2 | −3.2 | ||
| 250 | 247 ± 5 | −1.3 | ||
| 250 | 252 ± 1 | 0.7 | ||
| 250 | 250 ± NAb | −0.2 | ||
| November 21, 2008 | November 24, 2008 | 0 | BLOQ | NA |
| 15.6 | 15.8 ± 0.1 | 1.1 | ||
| 15.6 | 15.8 ± 0.2 | 1.1 | ||
| 15.6 | 15.5 ± 0.1 | −0.8 | ||
| 31.2 | 31.5 ± 0.1 | 1.0 | ||
| 31.2 | 31.1 ± 0.3 | −0.3 | ||
| 31.2 | 30.9 ± 0.1 | −1.0 | ||
| 62.5 | 62.6 ± 0.5 | 0.1 | ||
| 62.5 | 63.1 ± 0.2 | 1.0 | ||
| 62.5 | 62.8 ± 0.2 | 0.4 | ||
| 125 | 124 ± 1 | −1.1 | ||
| 125 | 124 ± 1 | −1.1 | ||
| 125 | 126 ± 1 | 0.5 | ||
| 250 | 248 ± 1 | −0.8 | ||
| 250 | 247 ± 1 | −1.2 | ||
| 250 | 247 ± 1 | −1.2 | ||
| January 20, 2009 | January 21, 2009 | 0 | BLOQ | NA |
| 15.6 | 15.8 ± 0.2 | 1.5 | ||
| 15.6 | 15.8 ± 0.1 | 1.1 | ||
| 31.2 | 31.6 ± 0.2 | 1.3 | ||
| 31.2 | 31.6 ± 0.2 | 1.3 | ||
| 62.5 | 63.6 ± 0.2 | 1.8 | ||
| 62.5 | 60.5 ± 0.2 | −3.2 | ||
| 125 | 127 ± 0 | 1.6 | ||
| 125 | 126 ± 1 | 0.5 | ||
| 250 | 249 ± 1 | −0.3 | ||
| 250 | 251 ± 1 | 0.5 | ||
| Animal room samples | ||||
| October 1, 2008 | November 10, 2008 | 0 | BLOQ | NA |
| 15.6 | 15.2 ± 0.3 | −2.3 | ||
| 31.2 | 30.5 ± 0.8 | −2.2 | ||
| 62.5 | 63.2 ± 0.1 | 1.1 | ||
| 125 | 126 ± 1 | 0.8 | ||
| 250 | 248 ± 2 | −0.7 | ||
| October 22, 2008 | December 4, 2008 | 0 | BLOQ | NA |
| 15.6 | 15.8 ± 0.2 | 1.5 | ||
| 31.2 | 31.8 ± 0.2 | 1.8 | ||
| 62.5 | 62.6 ± 0.5 | 0.1 | ||
| 125 | 124 ± 1 | −1.1 | ||
| 250 | 244 ± 6 | −2.5 | ||
| November 21, 2008 | January 5, 2009 | 0 | BLOQ | NA |
| 15.6 | 15.7 ± 0.0 | 0.6 | ||
| 31.2 | 30.8 ± 0.4 | −1.3 | ||
| 62.5 | 62.4 ± 0.2 | −0.2 | ||
| 125 | 124 ± 1 | −0.5 | ||
| 250 | 249 ± 1 | −0.4 | ||
| January 20, 2009 | March 2, 2009 | 0 | BLOQ | NA |
| 15.6 | 15.9 ± 0.1 | 2.1 | ||
| 31.2 | 31.8 ± 0.1 | 1.8 | ||
| 62.5 | 61.6 ± 0.1 | −1.5 | ||
| 125 | 127 ± 0 | 1.6 | ||
| 250 | 254 ± 1 | 1.7 | ||
Table A-6. Results of Analyses of Dose Formulations Administered to Male and Female B6C3F1/N Mice in the Three-month Gavage Study of Trans-resveratrol
| Date Prepared | Date Analyzed | Target Concentration (mg/mL) | Determined Concentration (mg/mL)a | Difference from Target (%) |
|---|---|---|---|---|
| September 10, 2008 | September 12, 2008 | 0 | BLOQ | NA |
| 15.6 | 15.3 ± 0.1 | −1.9 | ||
| 31.2 | 30.5 ± 1.2 | −2.1 | ||
| 62.5 | 62.8 ± 0.4 | 0.5 | ||
| 125 | 140 ± 1 | 11.7 | ||
| 125b | 128 ± 3 | 2.4 | ||
| 250 | 266 ± 1 | 6.4 | ||
| October 1, 2008 | October 3, 2008 | 0 | BLOQ | NA |
| 15.6 | 16.3 ± 0.1 | 4.5 | ||
| 15.6 | 16.3 ± 0.1 | 4.5 | ||
| 15.6 | 16.1 ± 0.1 | 3.0 | ||
| 31.2 | 32.6 ± 0.1 | 4.4 | ||
| 31.2 | 32.1 ± 0.2 | 2.8 | ||
| 31.2 | 31.6 ± 0.3 | 1.4 | ||
| 62.5 | 65.0 ± 0.8 | 4.0 | ||
| 62.5 | 64.5 ± 0.2 | 3.2 | ||
| 62.5 | 65.4 ± 0.8 | 4.7 | ||
| 125 | 126 ± 1 | 1.1 | ||
| 125 | 130 ± 1 | 4.3 | ||
| 125 | 128 ± 1 | 2.7 | ||
| 250 | 257 ± 3 | 2.9 | ||
| 250 | 257 ± 2 | 2.8 | ||
| 250 | 260 ± 1 | 4.0 | ||
| October 22, 2008 | October 29, 2008 | 0 | BLOQ | NA |
| 15.6 | 15.8 ± 0.1 | 1.5 | ||
| 15.6 | 15.7 ± 0.1 | 0.8 | ||
| 15.6 | 15.6 ± 0.1 | 0.2 | ||
| 31.2 | 31.6 ± 0.3 | 1.4 | ||
| 31.2 | 31.5 ± 0.1 | 1.0 | ||
| 31.2 | 31.1 ± 0.1 | −0.4 | ||
| 62.5 | 63.3 ± 0.5 | 1.3 | ||
| 62.5 | 62.2 ± 0.2 | −0.5 | ||
| 62.5 | 62.9 ± 0.2 | 0.7 | ||
| 125 | 126 ± 0 | 0.8 | ||
| 125 | 125 ± 0 | 0.0 | ||
| 125 | 121 ± 2 | −3.2 | ||
| 250 | 247 ± 5 | −1.3 | ||
| 250 | 252 ± 1 | 0.7 | ||
| 250 | 250 ± NAc | −0.2 | ||
| November 21, 2008 | November 24, 2008 | 0 | BLOQ | NA |
| 15.6 | 15.8 ± 0.1 | 1.1 | ||
| 15.6 | 15.8 ± 0.2 | 1.1 | ||
| 15.6 | 15.5 ± 0.1 | −0.8 | ||
| 31.2 | 31.5 ± 0.1 | 1.0 | ||
| 31.2 | 31.1 ± 0.3 | −0.3 | ||
| 31.2 | 30.9 ± 0.1 | −1.0 | ||
| 62.5 | 62.6 ± 0.5 | 0.1 | ||
| 62.5 | 63.1 ± 0.2 | 1.0 | ||
| 62.5 | 62.8 ± 0.2 | 0.4 | ||
| 125 | 124 ± 1 | −1.1 | ||
| 125 | 124 ± 1 | −1.1 | ||
| 125 | 126 ± 1 | 0.5 | ||
| 250 | 248 ± 1 | −0.8 | ||
| 250 | 247 ± 1 | −1.2 | ||
| 250 | 247 ± 1 | −1.2 | ||
| Animal room samples | ||||
| September 10, 2008 | October 22, 2008 | 0 | BLOQ | NA |
| 15.6 | 16.1 ± 0.0 | 3.2 | ||
| 31.2 | 32.2 ± 0.3 | 3.3 | ||
| 62.5 | 67.0 ± 0.6 | 7.2 | ||
| 125b | 139 ± 1 | 10.9 | ||
| 250 | 286 ± 3 | 14.3 | ||
| October 22, 2008 | December 4, 2008 | 0 | BLOQ | NA |
| 15.6 | 15.8 ± 0.1 | 1.3 | ||
| 31.2 | 31.8 ± 0.2 | 1.9 | ||
| 62.5 | 64.6 ± 0.4 | 3.4 | ||
| 125 | 125 ± 1 | 0 | ||
| 250 | 245 ± 1 | −2.0 | ||
| November 21, 2008 | January 5, 2009 | 0 | BLOQ | NA |
| 15.6 | 15.6 ± 0.1 | −0.2 | ||
| 31.2 | 31.1 ± 0.1 | −0.4 | ||
| 62.5 | 62.9 ± 0.2 | 0.6 | ||
| 125 | 126 ± 1 | 1.1 | ||
| 250 | 247 ± 2 | −1.3 | ||
Figure A-1. Infrared Absorption Spectrum of Trans-resveratrol
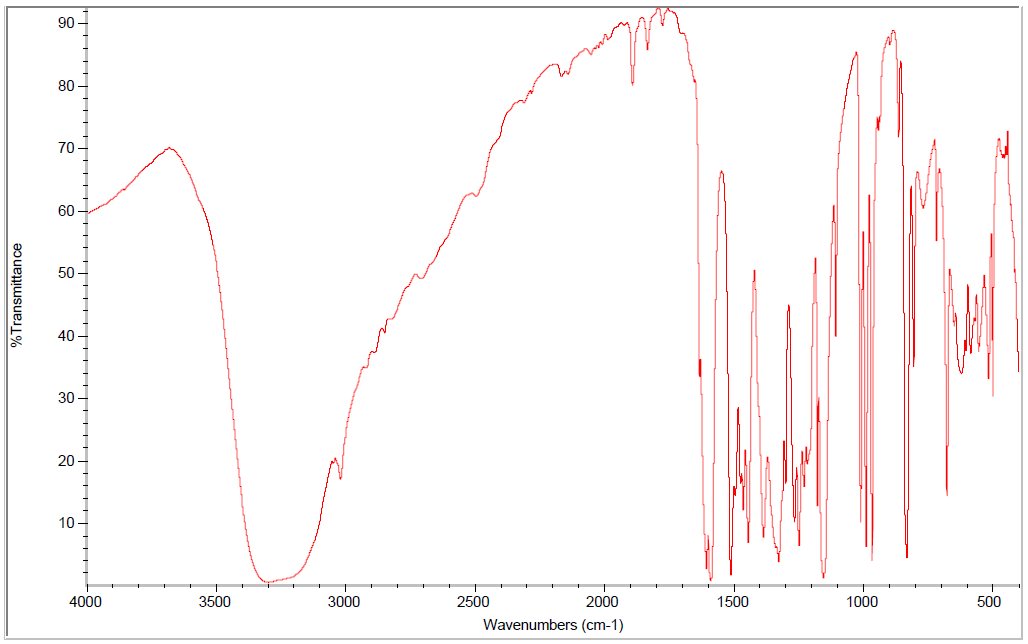
Figure A-2. 1H Nuclear Magnetic Resonance Spectrum of Reference Sample of Trans-resveratrol
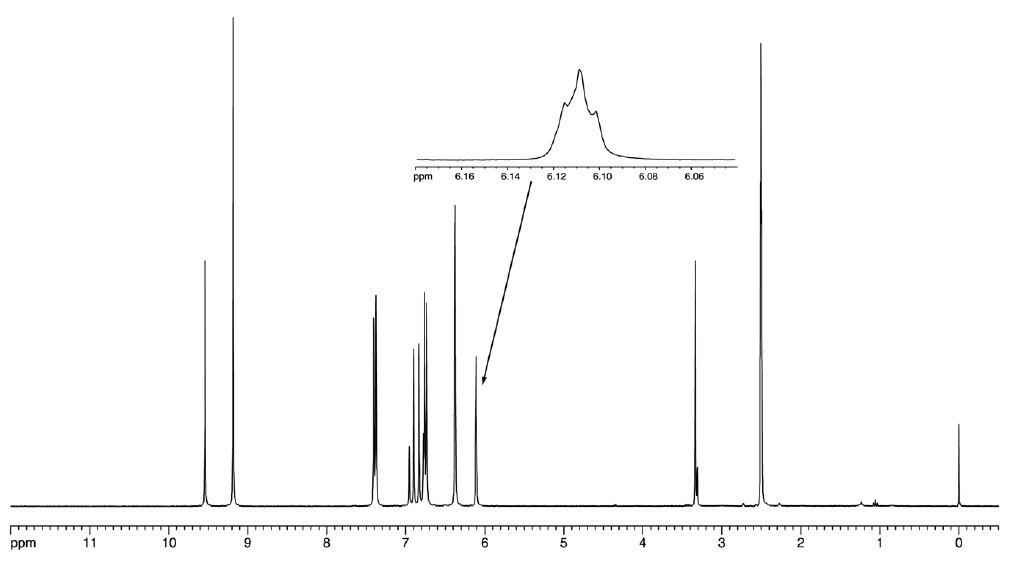
Appendix B. Ingredients, Nutrient Composition, and Contaminant Levels in NIH-07 Rat and NTP-2000 Rat and Mouse Ration
Table B-1. Ingredients of NIH-07 Rat Ration
| Ingredients | Percent by Weight |
|---|---|
| Ground hard winter wheat | 23.00 |
| Ground #2 yellow shelled corn | 24.25 |
| Wheat middlings | 10.0 |
| Oat hulls | 0.0 |
| Alfalfa meal (dehydrated, 17% protein) | 4.0 |
| Purified cellulose | 0.0 |
| Soybean meal (47% protein) | 12.0 |
| Fish meal (62% protein) | 10.0 |
| Corn oil (without preservatives) | 0.0 |
| Soy oil (without preservatives) | 2.5 |
| Dried brewer’s yeast | 2.0 |
| Calcium carbonate (USP) | 0.5 |
| Vitamin premixa | 0.25 |
| Mineral premixb | 0.15 |
| Calcium phosphate, dibasic (USP) | 1.25 |
| Sodium chloride | 0.5 |
| Choline chloride (70% choline) | 0.10 |
| Dried skim milk | 5.00 |
| Dried molasses | 1.50 |
| Corn gluten meal (60% protein) | 3.00 |
| Methionine | 0.0 |
Table B-1. Ingredients of NIH-07 Rat Ration
| Ingredients | Percent by Weight |
|---|---|
| Ground hard winter wheat | 23.00 |
| Ground #2 yellow shelled corn | 24.25 |
| Wheat middlings | 10.0 |
| Oat hulls | 0.0 |
| Alfalfa meal (dehydrated, 17% protein) | 4.0 |
| Purified cellulose | 0.0 |
| Soybean meal (47% protein) | 12.0 |
| Fish meal (62% protein) | 10.0 |
| Corn oil (without preservatives) | 0.0 |
| Soy oil (without preservatives) | 2.5 |
| Dried brewer’s yeast | 2.0 |
| Calcium carbonate (USP) | 0.5 |
| Vitamin premixa | 0.25 |
| Mineral premixb | 0.15 |
| Calcium phosphate, dibasic (USP) | 1.25 |
| Sodium chloride | 0.5 |
| Choline chloride (70% choline) | 0.10 |
| Dried skim milk | 5.00 |
| Dried molasses | 1.50 |
| Corn gluten meal (60% protein) | 3.00 |
| Methionine | 0.0 |
Table B-2. Vitamins and Minerals in NIH-07 Rat Ration
| Amounta | Source | |
|---|---|---|
| Vitamins | ||
| Vitamin A | 6,062 IU | Stabilized vitamin A palmitate or acetate |
| Vitamin D | 5,070 IU | D-activated animal sterol |
| Vitamin K | 3.1 mg | Menadione sodium bisulfite complex |
| Vitamin E | 22 IU | α-Tocopheryl acetate |
| Niacin | 33 mg | – |
| Folic acid | 2.4 mg | – |
| d-Pantothenic acid | 19.8 mg | d-Calcium pantothenate |
| Riboflavin | 3.8 mg | – |
| Thiamine | 11 mg | Thiamine mononitrate |
| B12 | 50 µg | – |
| Pyridoxine | 6.5 mg | Pyridoxine hydrochloride |
| Biotin | 0.15 mg | d-Biotin |
| Minerals | ||
| Iron | 132 mg | Iron sulfate |
| Zinc | 18 mg | Zinc oxide |
| Manganese | 66 mg | Manganese oxide |
| Copper | 4.4 mg | Copper sulfate |
| Iodine | 2.0 mg | Calcium iodate |
| Cobalt | 0.44 mg | Cobalt carbonate |
Table B-2. Vitamins and Minerals in NIH-07 Rat Ration
| Amounta | Source | |
|---|---|---|
| Vitamins | ||
| Vitamin A | 6,062 IU | Stabilized vitamin A palmitate or acetate |
| Vitamin D | 5,070 IU | D-activated animal sterol |
| Vitamin K | 3.1 mg | Menadione sodium bisulfite complex |
| Vitamin E | 22 IU | α-Tocopheryl acetate |
| Niacin | 33 mg | – |
| Folic acid | 2.4 mg | – |
| d-Pantothenic acid | 19.8 mg | d-Calcium pantothenate |
| Riboflavin | 3.8 mg | – |
| Thiamine | 11 mg | Thiamine mononitrate |
| B12 | 50 µg | – |
| Pyridoxine | 6.5 mg | Pyridoxine hydrochloride |
| Biotin | 0.15 mg | d-Biotin |
| Minerals | ||
| Iron | 132 mg | Iron sulfate |
| Zinc | 18 mg | Zinc oxide |
| Manganese | 66 mg | Manganese oxide |
| Copper | 4.4 mg | Copper sulfate |
| Iodine | 2.0 mg | Calcium iodate |
| Cobalt | 0.44 mg | Cobalt carbonate |
Table B-3. Nutrient Composition of NIH-07 Rat Ration
| Nutrient | Mean ± Standard Deviation | Range | Number of Samples |
|---|---|---|---|
| Protein (% by weight) | 24 | – | 1 |
| Crude fat (% by weight) | 5 | – | 1 |
| Crude fiber (% by weight) | 3.6 | – | 1 |
| Ash (% by weight) | 6.77 | – | 1 |
| Amino acids (% of total diet) | |||
| Arginine | 1.380 ± 0.06 | 1.3–1.49 | 10 |
| Cystine | 0.322 ± 0.031 | 0.274–0.372 | 10 |
| Glycine | 1.150 ± 0.070 | 1.06–1.31 | 10 |
| Histidine | 0.518 ± 0.024 | 0.497–0.553 | 10 |
| Isoleucine | 0.984 ± 0.024 | 0.952–1.03 | 10 |
| Leucine | 2.018 ± 0.067 | 1.93–2.13 | 10 |
| Lysine | 1.243 ± 0.051 | 1.13–1.32 | 10 |
| Methionine | 0.488 ± 0.016 | 0.468–0.515 | 10 |
| Phenylalanine | 1.097 ± 0.022 | 1.07–1.12 | 10 |
| Threonine | 0.918 ± 0.031 | 0.883–0.961 | 10 |
| Tryptophan | 0.277 ± 0.020 | 0.265–0.326 | 10 |
| Tyrosine | 0.860 ± 0.037 | 0.785–0.894 | 10 |
| Valine | 1.134 ± 0.025 | 1.11–1.17 | 10 |
| Essential fatty acids (% of total diet) | |||
| Linoleic | 2.30 ± 0.219 | 1.99–2.59 | 10 |
| Linolenic | 0.25 ± 0.275 | 0.217–0.296 | 10 |
| Vitamins | |||
| Vitamin A (IU/kg) | 4,640 | – | 1 |
| α-Tocopherol (ppm) | 6,704 ± 21,045 | 40.3–66,600 | 10 |
| Thiamine (ppm)a | 10.6 | – | 1 |
| Riboflavin (ppm) | 14.47 ± 3.352 | 10.0–19.8 | 10 |
| Niacin (ppm) | 99.33 ± 8.235 | 87.0–112.0 | 10 |
| Pantothenic acid (ppm) | 44.38 ± 3.806 | 38.2–51.1 | 10 |
| Pyridoxine (ppm)a | 12.876 ± 3.171 | 9.63–19.7 | 10 |
| Folic acid (ppm) | 2.482 ± 0.487 | 1.68–3.09 | 10 |
| Biotin (ppm) | 0.3283 ± 0.172 | 0.0–0.638 | 10 |
| B12 (ppb) | 49.4 ± 6.83 | 41.8–61.6 | 10 |
| Choline (as chloride) (ppm) | 1,821.0 ± 197.5 | 1,570–2,200 | 10 |
| Minerals | |||
| Calcium (%) | 1.150 | – | 1 |
| Phosphorus (%) | 0.930 | – | 1 |
| Potassium (%) | 0.830 ± 0.036 | 0.769–0.88 | 10 |
| Chloride (%) | 0.652 ± 0.106 | 0.441–0.8 | 10 |
| Sodium (%) | 0.378 ± 0.46 | 0.318–0.469 | 10 |
| Magnesium (%) | 0.187 ± 0.014 | 0.17–0.218 | 10 |
| Iron (ppm) | 385.1 ± 54.9 | 276.0–469.0 | 10 |
| Manganese (ppm) | 90.81 ± 7.566 | 80.7–104.0 | 10 |
| Zinc (ppm) | 64.15 ± 10.07 | 52.4–89.2 | 10 |
| Copper (ppm) | 14.13 ± 2.57 | 11.9–21.1 | 10 |
| Iodine (ppm) | 1.811 ± 0.992 | 0.54–3.45 | 10 |
| Chromium (ppm) | 1.422 ± 0.934 | 0.277–3.89 | 10 |
| Cobalt (ppm) | 0.5155 ± 0.267 | 0.01–0.963 | 10 |
Table B-3. Nutrient Composition of NIH-07 Rat Ration
| Nutrient | Mean ± Standard Deviation | Range | Number of Samples |
|---|---|---|---|
| Protein (% by weight) | 24 | – | 1 |
| Crude fat (% by weight) | 5 | – | 1 |
| Crude fiber (% by weight) | 3.6 | – | 1 |
| Ash (% by weight) | 6.77 | – | 1 |
| Amino acids (% of total diet) | |||
| Arginine | 1.380 ± 0.06 | 1.3–1.49 | 10 |
| Cystine | 0.322 ± 0.031 | 0.274–0.372 | 10 |
| Glycine | 1.150 ± 0.070 | 1.06–1.31 | 10 |
| Histidine | 0.518 ± 0.024 | 0.497–0.553 | 10 |
| Isoleucine | 0.984 ± 0.024 | 0.952–1.03 | 10 |
| Leucine | 2.018 ± 0.067 | 1.93–2.13 | 10 |
| Lysine | 1.243 ± 0.051 | 1.13–1.32 | 10 |
| Methionine | 0.488 ± 0.016 | 0.468–0.515 | 10 |
| Phenylalanine | 1.097 ± 0.022 | 1.07–1.12 | 10 |
| Threonine | 0.918 ± 0.031 | 0.883–0.961 | 10 |
| Tryptophan | 0.277 ± 0.020 | 0.265–0.326 | 10 |
| Tyrosine | 0.860 ± 0.037 | 0.785–0.894 | 10 |
| Valine | 1.134 ± 0.025 | 1.11–1.17 | 10 |
| Essential fatty acids (% of total diet) | |||
| Linoleic | 2.30 ± 0.219 | 1.99–2.59 | 10 |
| Linolenic | 0.25 ± 0.275 | 0.217–0.296 | 10 |
| Vitamins | |||
| Vitamin A (IU/kg) | 4,640 | – | 1 |
| α-Tocopherol (ppm) | 6,704 ± 21,045 | 40.3–66,600 | 10 |
| Thiamine (ppm)a | 10.6 | – | 1 |
| Riboflavin (ppm) | 14.47 ± 3.352 | 10.0–19.8 | 10 |
| Niacin (ppm) | 99.33 ± 8.235 | 87.0–112.0 | 10 |
| Pantothenic acid (ppm) | 44.38 ± 3.806 | 38.2–51.1 | 10 |
| Pyridoxine (ppm)a | 12.876 ± 3.171 | 9.63–19.7 | 10 |
| Folic acid (ppm) | 2.482 ± 0.487 | 1.68–3.09 | 10 |
| Biotin (ppm) | 0.3283 ± 0.172 | 0.0–0.638 | 10 |
| B12 (ppb) | 49.4 ± 6.83 | 41.8–61.6 | 10 |
| Choline (as chloride) (ppm) | 1,821.0 ± 197.5 | 1,570–2,200 | 10 |
| Minerals | |||
| Calcium (%) | 1.150 | – | 1 |
| Phosphorus (%) | 0.930 | – | 1 |
| Potassium (%) | 0.830 ± 0.036 | 0.769–0.88 | 10 |
| Chloride (%) | 0.652 ± 0.106 | 0.441–0.8 | 10 |
| Sodium (%) | 0.378 ± 0.46 | 0.318–0.469 | 10 |
| Magnesium (%) | 0.187 ± 0.014 | 0.17–0.218 | 10 |
| Iron (ppm) | 385.1 ± 54.9 | 276.0–469.0 | 10 |
| Manganese (ppm) | 90.81 ± 7.566 | 80.7–104.0 | 10 |
| Zinc (ppm) | 64.15 ± 10.07 | 52.4–89.2 | 10 |
| Copper (ppm) | 14.13 ± 2.57 | 11.9–21.1 | 10 |
| Iodine (ppm) | 1.811 ± 0.992 | 0.54–3.45 | 10 |
| Chromium (ppm) | 1.422 ± 0.934 | 0.277–3.89 | 10 |
| Cobalt (ppm) | 0.5155 ± 0.267 | 0.01–0.963 | 10 |
Table B-4. Contaminant Levels in NIH-07 Rat Ration
| Level | Number of Samples | |
|---|---|---|
| Contaminants | ||
| Arsenic (ppm) | 0.46 | 1 |
| Cadmium (ppm) | 0.11 | 1 |
| Lead (ppm) | 0.11 | 1 |
| Mercury (ppm) | 0.01 | 1 |
| Selenium (ppm) | 0.46 | 1 |
| Aflatoxins (ppb)a | 5 | 1 |
| Nitrate nitrogen (ppm)b | 14.2 | 1 |
| Nitrite nitrogen (ppm)a,b | <0.61 | 1 |
| BHA (ppm)a,c | <1.0 | 1 |
| BHT (ppm)a,c | <1.0 | 1 |
| Aerobic plate count (CFU/gm) | <10 | 1 |
| Coliform (MPN/gm) | <3 | 1 |
| Escherichia coli (MPN/gm) | <10 | 1 |
| Salmonella sp. (MPN/gm) | negative | 1 |
| Total nitrosamines (ppb)d | 8.7 | 1 |
| N-Ndimethylamine (ppb)d | 4.4 | 1 |
| N-Npyrrolidine (ppb)d | 4.3 | 1 |
| Pesticides (ppm) | ||
| α-BHCa | <0.01 | 1 |
| β-BHCa | <0.02 | 1 |
| γ-BHCa | <0.01 | 1 |
| δ-BHCa | <0.01 | 1 |
| Heptachlora | <0.01 | 1 |
| Aldrina | <0.01 | 1 |
| Heptachlor epoxidea | <0.01 | 1 |
| DDEa | <0.01 | 1 |
| DDDa | <0.01 | 1 |
| DDTa | <0.01 | 1 |
| HCBa | <0.01 | 1 |
| Mirexa | <0.01 | 1 |
| Methoxychlora | <0.05 | 1 |
| Dieldrina | <0.01 | 1 |
| Endrina | <0.01 | 1 |
| Telodrina | <0.01 | 1 |
| Chlordanea | <0.05 | 1 |
| Toxaphenea | <0.10 | 1 |
| Estimated PCBsa | <0.20 | 1 |
| Ronnela | <0.01 | 1 |
| Ethiona | <0.02 | 1 |
| Trithiona | <0.05 | 1 |
| Diazinona | <0.10 | 1 |
| Methyl chlorpyrifos | 0.0335 | 1 |
| Methyl parathiona | <0.02 | 1 |
| Ethyl parathiona | <0.02 | 1 |
| Malathion | 0.043 | 1 |
| Endosulfan Ia | <0.01 | 1 |
| Endosulfan IIa | <0.01 | 1 |
| Endosulfane Sulfatea | <0.03 | 1 |
Table B-4. Contaminant Levels in NIH-07 Rat Ration
| Level | Number of Samples | |
|---|---|---|
| Contaminants | ||
| Arsenic (ppm) | 0.46 | 1 |
| Cadmium (ppm) | 0.11 | 1 |
| Lead (ppm) | 0.11 | 1 |
| Mercury (ppm) | 0.01 | 1 |
| Selenium (ppm) | 0.46 | 1 |
| Aflatoxins (ppb)a | 5 | 1 |
| Nitrate nitrogen (ppm)b | 14.2 | 1 |
| Nitrite nitrogen (ppm)a,b | <0.61 | 1 |
| BHA (ppm)a,c | <1.0 | 1 |
| BHT (ppm)a,c | <1.0 | 1 |
| Aerobic plate count (CFU/gm) | <10 | 1 |
| Coliform (MPN/gm) | <3 | 1 |
| Escherichia coli (MPN/gm) | <10 | 1 |
| Salmonella sp. (MPN/gm) | negative | 1 |
| Total nitrosamines (ppb)d | 8.7 | 1 |
| N-Ndimethylamine (ppb)d | 4.4 | 1 |
| N-Npyrrolidine (ppb)d | 4.3 | 1 |
| Pesticides (ppm) | ||
| α-BHCa | <0.01 | 1 |
| β-BHCa | <0.02 | 1 |
| γ-BHCa | <0.01 | 1 |
| δ-BHCa | <0.01 | 1 |
| Heptachlora | <0.01 | 1 |
| Aldrina | <0.01 | 1 |
| Heptachlor epoxidea | <0.01 | 1 |
| DDEa | <0.01 | 1 |
| DDDa | <0.01 | 1 |
| DDTa | <0.01 | 1 |
| HCBa | <0.01 | 1 |
| Mirexa | <0.01 | 1 |
| Methoxychlora | <0.05 | 1 |
| Dieldrina | <0.01 | 1 |
| Endrina | <0.01 | 1 |
| Telodrina | <0.01 | 1 |
| Chlordanea | <0.05 | 1 |
| Toxaphenea | <0.10 | 1 |
| Estimated PCBsa | <0.20 | 1 |
| Ronnela | <0.01 | 1 |
| Ethiona | <0.02 | 1 |
| Trithiona | <0.05 | 1 |
| Diazinona | <0.10 | 1 |
| Methyl chlorpyrifos | 0.0335 | 1 |
| Methyl parathiona | <0.02 | 1 |
| Ethyl parathiona | <0.02 | 1 |
| Malathion | 0.043 | 1 |
| Endosulfan Ia | <0.01 | 1 |
| Endosulfan IIa | <0.01 | 1 |
| Endosulfane Sulfatea | <0.03 | 1 |
Table B-5. Ingredients of NTP-2000 Rat and Mouse Ration
| Ingredients | Percent by Weight |
|---|---|
| Ground hard winter wheat | 23.00 |
| Ground #2 yellow shelled corn | 22.44 |
| Wheat middlings | 15.0 |
| Oat hulls | 8.5 |
| Alfalfa meal (dehydrated, 17% protein) | 7.5 |
| Purified cellulose | 5.5 |
| Soybean meal (49% protein) | 4.0 |
| Fish meal (60% protein) | 4.0 |
| Corn oil (without preservatives) | 3.0 |
| Soy oil (without preservatives) | 3.0 |
| Dried brewer’s yeast | 1.0 |
| Calcium carbonate (USP) | 0.9 |
| Vitamin premixa | 0.5 |
| Mineral premixb | 0.5 |
| Calcium phosphate, dibasic (USP) | 0.4 |
| Sodium chloride | 0.3 |
| Choline chloride (70% choline) | 0.26 |
| Methionine | 0.2 |
Table B-5. Ingredients of NTP-2000 Rat and Mouse Ration
| Ingredients | Percent by Weight |
|---|---|
| Ground hard winter wheat | 23.00 |
| Ground #2 yellow shelled corn | 22.44 |
| Wheat middlings | 15.0 |
| Oat hulls | 8.5 |
| Alfalfa meal (dehydrated, 17% protein) | 7.5 |
| Purified cellulose | 5.5 |
| Soybean meal (49% protein) | 4.0 |
| Fish meal (60% protein) | 4.0 |
| Corn oil (without preservatives) | 3.0 |
| Soy oil (without preservatives) | 3.0 |
| Dried brewer’s yeast | 1.0 |
| Calcium carbonate (USP) | 0.9 |
| Vitamin premixa | 0.5 |
| Mineral premixb | 0.5 |
| Calcium phosphate, dibasic (USP) | 0.4 |
| Sodium chloride | 0.3 |
| Choline chloride (70% choline) | 0.26 |
| Methionine | 0.2 |
Table B-6. Vitamins and Minerals in NTP-2000 Rat and Mouse Ration
| Amounta | Source | |
|---|---|---|
| Vitamins | ||
| Vitamin A | 4,000 IU | Stabilized vitamin A palmitate or acetate |
| Vitamin D | 1,000 IU | D-activated animal sterol |
| Vitamin K | 1.0 mg | Menadione sodium bisulfite complex |
| α-Tocopheryl acetate | 100 IU | – |
| Niacin | 23 mg | – |
| Folic acid | 1.1 mg | – |
| d-Pantothenic acid | 10 mg | d-Calcium pantothenate |
| Riboflavin | 3.3 mg | – |
| Thiamine | 4 mg | Thiamine mononitrate |
| B12 | 52 µg | – |
| Pyridoxine | 6.3 mg | Pyridoxine hydrochloride |
| Biotin | 0.2 mg | d-Biotin |
| Minerals | ||
| Magnesium | 514 mg | Magnesium oxide |
| Iron | 35 mg | Iron sulfate |
| Zinc | 12 mg | Zinc oxide |
| Manganese | 10 mg | Manganese oxide |
| Copper | 2.0 mg | Copper sulfate |
| Iodine | 0.2 mg | Calcium iodate |
| Chromium | 0.2 mg | Chromium acetate |
Table B-6. Vitamins and Minerals in NTP-2000 Rat and Mouse Ration
| Amounta | Source | |
|---|---|---|
| Vitamins | ||
| Vitamin A | 4,000 IU | Stabilized vitamin A palmitate or acetate |
| Vitamin D | 1,000 IU | D-activated animal sterol |
| Vitamin K | 1.0 mg | Menadione sodium bisulfite complex |
| α-Tocopheryl acetate | 100 IU | – |
| Niacin | 23 mg | – |
| Folic acid | 1.1 mg | – |
| d-Pantothenic acid | 10 mg | d-Calcium pantothenate |
| Riboflavin | 3.3 mg | – |
| Thiamine | 4 mg | Thiamine mononitrate |
| B12 | 52 µg | – |
| Pyridoxine | 6.3 mg | Pyridoxine hydrochloride |
| Biotin | 0.2 mg | d-Biotin |
| Minerals | ||
| Magnesium | 514 mg | Magnesium oxide |
| Iron | 35 mg | Iron sulfate |
| Zinc | 12 mg | Zinc oxide |
| Manganese | 10 mg | Manganese oxide |
| Copper | 2.0 mg | Copper sulfate |
| Iodine | 0.2 mg | Calcium iodate |
| Chromium | 0.2 mg | Chromium acetate |
Table B-7. Nutrient Composition of NTP-2000 Rat and Mouse Ration
| Nutrient | Mean ± Standard Deviation | Range | Number of Samples |
|---|---|---|---|
| Protein (% by weight) | 15.05 ± 0.794 | 13.9–15.9 | 5 |
| Crude fat (% by weight) | 8.32 ± 0.172 | 8.0–8.5 | 5 |
| Crude fiber (% by weight) | 9.05 ± 0.400 | 8.64–9.73 | 5 |
| Ash (% by weight) | 5.24 ± 0.170 | 5.0–5.43 | 5 |
| Amino acids (% of total diet) | |||
| Arginine | 0.805 ± 0.075 | 0.67–0.97 | 29 |
| Cystine | 0.220 ± 0.021 | 0.15–0.25 | 29 |
| Glycine | 0.702 ± 0.038 | 0.62–0.8 | 29 |
| Histidine | 0.342 ± 0.070 | 0.27–0.68 | 29 |
| Isoleucine | 0.549 ± 0.040 | 0.43–0.66 | 29 |
| Leucine | 1.100 ± 0.063 | 0.96–1.24 | 29 |
| Lysine | 0.700 ± 0.104 | 0.31–0.86 | 29 |
| Methionine | 0.409 ± 0.042 | 0.26–0.49 | 29 |
| Phenylalanine | 0.623 ± 0.047 | 0.471–0.72 | 29 |
| Threonine | 0.513 ± 0.041 | 0.43–0.61 | 29 |
| Tryptophan | 0.155 ± 0.027 | 0.11–0.2 | 29 |
| Tyrosine | 0.422 ± 0.066 | 0.28–0.54 | 29 |
| Valine | 0.666 ± 0.040 | 0.55–0.73 | 29 |
| Essential fatty acids (% of total diet) | |||
| Linoleic | 3.94 ± 0.235 | 3.49–4.55 | 29 |
| Linolenic | 0.30 ± 0.064 | 0.005–0.368 | 29 |
| Vitamins | |||
| Vitamin A (IU/kg) | 2,965 ± 40 | 2,350–3,510 | 5 |
| Vitamin D (IU/kg)a | 1,000 | – | – |
| α-Tocopherol (ppm) | 2,456 ± 12,817 | 13.6–69,100 | 29 |
| Thiamine (ppm)b | 6.83 ± 1.329 | 5.3–9.0 | 5 |
| Riboflavin (ppm) | 8.17 ± 2.841 | 4.2–17.5 | 29 |
| Niacin (ppm) | 78.66 ± 8.11 | 66.4–98.2 | 29 |
| Pantothenic acid (ppm) | 26.42 ± 11.05 | 17.4–81.0 | 29 |
| Pyridoxine (ppm)b | 9.75 ± 2.045 | 6.44–14.3 | 29 |
| Folic acid (ppm) | 1.58 ± 0.43 | 1.15–3.27 | 29 |
| Biotin (ppm) | 0.323 ± 0.093 | 0.2–0.704 | 29 |
| B12 (ppb) | 50.41 ± 34.89 | 18.3–174 | 29 |
| Choline (as chloride) (ppm) | 2,593 ± 633.8 | 1,160–3,790 | 29 |
| Minerals | |||
| Calcium (%) | 0.926 ± 0.024 | 0.898–0.969 | 5 |
| Phosphorus (%) | 0.570 ± 0.026 | 0.504–0.606 | 5 |
| Potassium (%) | 0.668 ± 0.029 | 0.626–0.733 | 29 |
| Chloride (%) | 0.392 ± 0.044 | 0.3–0.517 | 29 |
| Sodium (%) | 0.195 ± 0.027 | 0.16–0.283 | 29 |
| Magnesium (%) | 0.217 ± 0.054 | 0.185–0.49 | 29 |
| Iron (ppm) | 191.6 ± 36.18 | 135–311 | 29 |
| Manganese (ppm) | 50.11 ± 9.42 | 21–73.1 | 29 |
| Zinc (ppm) | 57.3 ± 25.54 | 43.3–184 | 29 |
| Copper (ppm) | 7.57 ± 2.49 | 3.21–16.3 | 29 |
| Iodine (ppm) | 0.513 ± 0.221 | 0–0.972 | 29 |
| Chromium (ppm) | 1.02 ± 1.04 | 0.33–3.97 | 28 |
| Cobalt (ppm) | 0.222 ± 0.152 | 0.0857–0.864 | 27 |
Table B-7. Nutrient Composition of NTP-2000 Rat and Mouse Ration
| Nutrient | Mean ± Standard Deviation | Range | Number of Samples |
|---|---|---|---|
| Protein (% by weight) | 15.05 ± 0.794 | 13.9–15.9 | 5 |
| Crude fat (% by weight) | 8.32 ± 0.172 | 8.0–8.5 | 5 |
| Crude fiber (% by weight) | 9.05 ± 0.400 | 8.64–9.73 | 5 |
| Ash (% by weight) | 5.24 ± 0.170 | 5.0–5.43 | 5 |
| Amino acids (% of total diet) | |||
| Arginine | 0.805 ± 0.075 | 0.67–0.97 | 29 |
| Cystine | 0.220 ± 0.021 | 0.15–0.25 | 29 |
| Glycine | 0.702 ± 0.038 | 0.62–0.8 | 29 |
| Histidine | 0.342 ± 0.070 | 0.27–0.68 | 29 |
| Isoleucine | 0.549 ± 0.040 | 0.43–0.66 | 29 |
| Leucine | 1.100 ± 0.063 | 0.96–1.24 | 29 |
| Lysine | 0.700 ± 0.104 | 0.31–0.86 | 29 |
| Methionine | 0.409 ± 0.042 | 0.26–0.49 | 29 |
| Phenylalanine | 0.623 ± 0.047 | 0.471–0.72 | 29 |
| Threonine | 0.513 ± 0.041 | 0.43–0.61 | 29 |
| Tryptophan | 0.155 ± 0.027 | 0.11–0.2 | 29 |
| Tyrosine | 0.422 ± 0.066 | 0.28–0.54 | 29 |
| Valine | 0.666 ± 0.040 | 0.55–0.73 | 29 |
| Essential fatty acids (% of total diet) | |||
| Linoleic | 3.94 ± 0.235 | 3.49–4.55 | 29 |
| Linolenic | 0.30 ± 0.064 | 0.005–0.368 | 29 |
| Vitamins | |||
| Vitamin A (IU/kg) | 2,965 ± 40 | 2,350–3,510 | 5 |
| Vitamin D (IU/kg)a | 1,000 | – | – |
| α-Tocopherol (ppm) | 2,456 ± 12,817 | 13.6–69,100 | 29 |
| Thiamine (ppm)b | 6.83 ± 1.329 | 5.3–9.0 | 5 |
| Riboflavin (ppm) | 8.17 ± 2.841 | 4.2–17.5 | 29 |
| Niacin (ppm) | 78.66 ± 8.11 | 66.4–98.2 | 29 |
| Pantothenic acid (ppm) | 26.42 ± 11.05 | 17.4–81.0 | 29 |
| Pyridoxine (ppm)b | 9.75 ± 2.045 | 6.44–14.3 | 29 |
| Folic acid (ppm) | 1.58 ± 0.43 | 1.15–3.27 | 29 |
| Biotin (ppm) | 0.323 ± 0.093 | 0.2–0.704 | 29 |
| B12 (ppb) | 50.41 ± 34.89 | 18.3–174 | 29 |
| Choline (as chloride) (ppm) | 2,593 ± 633.8 | 1,160–3,790 | 29 |
| Minerals | |||
| Calcium (%) | 0.926 ± 0.024 | 0.898–0.969 | 5 |
| Phosphorus (%) | 0.570 ± 0.026 | 0.504–0.606 | 5 |
| Potassium (%) | 0.668 ± 0.029 | 0.626–0.733 | 29 |
| Chloride (%) | 0.392 ± 0.044 | 0.3–0.517 | 29 |
| Sodium (%) | 0.195 ± 0.027 | 0.16–0.283 | 29 |
| Magnesium (%) | 0.217 ± 0.054 | 0.185–0.49 | 29 |
| Iron (ppm) | 191.6 ± 36.18 | 135–311 | 29 |
| Manganese (ppm) | 50.11 ± 9.42 | 21–73.1 | 29 |
| Zinc (ppm) | 57.3 ± 25.54 | 43.3–184 | 29 |
| Copper (ppm) | 7.57 ± 2.49 | 3.21–16.3 | 29 |
| Iodine (ppm) | 0.513 ± 0.221 | 0–0.972 | 29 |
| Chromium (ppm) | 1.02 ± 1.04 | 0.33–3.97 | 28 |
| Cobalt (ppm) | 0.222 ± 0.152 | 0.0857–0.864 | 27 |
Table B-8. Contaminant Levels in NTP-2000 Rat and Mouse Ration
| Mean ± Standard Deviation | Range | Number of Samples | |
|---|---|---|---|
| Contaminants | |||
| Arsenic (ppm) | 0.251 ± 0.020 | 0.220–0.277 | 5 |
| Cadmium (ppm) | 0.064 ± 0.016 | 0.055–0.096 | 5 |
| Lead (ppm) | 0.084 ± 0.006 | 0.075–0.090 | 5 |
| Mercury (ppm) | 0.014 ± 0.005 | 0.01–0.02 | 5 |
| Selenium (ppm) | 0.181 ± 0.014 | 0.165–0.198 | 5 |
| Aflatoxins (ppb)a | <5.0 | – | 5 |
| Nitrate nitrogen (ppm)b | 19.13 ± 5.641 | 11.2–26.5 | 5 |
| Nitrite nitrogen (ppm)a,b | <0.61 | – | 5 |
| BHA (ppm)a,c | <1.00 | – | 5 |
| BHT (ppm)a,c | <1.00 | – | 5 |
| Aerobic plate count (CFU/gm) | <10.00 | – | 5 |
| Coliform (MPN/gm) | <3.00 | – | 5 |
| Escherichia coli (MPN/gm) | <10.0 | – | 5 |
| Salmonella sp. (MPN/gm) | Negative | – | 5 |
| Total nitrosamines (ppb)d | 6.9 ± 4.72 | 2.0–13.9 | 5 |
| N-Ndimethylamine (ppb)d | 1.7 ± 1.7 | 1.0–5.1 | 5 |
| N-Npyrrolidine (ppb)d | 5.4 ± 3.7 | 1.0–9.3 | 5 |
| Pesticides (ppm) | |||
| α-BHCa | <0.01 | – | 5 |
| β-BHCa | <0.02 | – | 5 |
| γ-BHCa | <0.01 | – | 5 |
| δ-BHCa | <0.01 | – | 5 |
| Heptachlora | <0.01 | – | 5 |
| Aldrina | <0.01 | – | 5 |
| Heptachlor epoxidea | <0.01 | – | 5 |
| DDEa | <0.01 | – | 5 |
| DDDa | <0.01 | – | 5 |
| DDTa | <0.01 | – | 5 |
| HCBa | <0.01 | – | 5 |
| Mirexa | <0.01 | – | 5 |
| Methoxychlora | <0.05 | – | 5 |
| Dieldrina | <0.01 | – | 5 |
| Endrina | <0.01 | – | 5 |
| Telodrina | <0.01 | – | 5 |
| Chlordanea | <0.05 | – | 5 |
| Toxaphenea | <0.10 | – | 5 |
| Estimated PCBsa | <0.20 | – | 5 |
| Ronnela | <0.01 | – | 5 |
| Ethiona | <0.02 | – | 5 |
| Trithiona | <0.05 | – | 5 |
| Diazinona | <0.10 | – | 5 |
| Methyl chlorpyrifos | 0.074 ± 0.054 | 0.020–0.170 | 5 |
| Methyl parathiona | <0.02 | – | 5 |
| Ethyl parathiona | <0.02 | – | 5 |
| Malathion | 0.065 ± 0.025 | 0.020–0.094 | 5 |
| Endosulfan Ia | <0.01 | – | 5 |
| Endosulfan IIa | <0.01 | – | 5 |
| Endosulfane sulfatea | <0.03 | – | 5 |
Table B-8. Contaminant Levels in NTP-2000 Rat and Mouse Ration
| Mean ± Standard Deviation | Range | Number of Samples | |
|---|---|---|---|
| Contaminants | |||
| Arsenic (ppm) | 0.251 ± 0.020 | 0.220–0.277 | 5 |
| Cadmium (ppm) | 0.064 ± 0.016 | 0.055–0.096 | 5 |
| Lead (ppm) | 0.084 ± 0.006 | 0.075–0.090 | 5 |
| Mercury (ppm) | 0.014 ± 0.005 | 0.01–0.02 | 5 |
| Selenium (ppm) | 0.181 ± 0.014 | 0.165–0.198 | 5 |
| Aflatoxins (ppb)a | <5.0 | – | 5 |
| Nitrate nitrogen (ppm)b | 19.13 ± 5.641 | 11.2–26.5 | 5 |
| Nitrite nitrogen (ppm)a,b | <0.61 | – | 5 |
| BHA (ppm)a,c | <1.00 | – | 5 |
| BHT (ppm)a,c | <1.00 | – | 5 |
| Aerobic plate count (CFU/gm) | <10.00 | – | 5 |
| Coliform (MPN/gm) | <3.00 | – | 5 |
| Escherichia coli (MPN/gm) | <10.0 | – | 5 |
| Salmonella sp. (MPN/gm) | Negative | – | 5 |
| Total nitrosamines (ppb)d | 6.9 ± 4.72 | 2.0–13.9 | 5 |
| N-Ndimethylamine (ppb)d | 1.7 ± 1.7 | 1.0–5.1 | 5 |
| N-Npyrrolidine (ppb)d | 5.4 ± 3.7 | 1.0–9.3 | 5 |
| Pesticides (ppm) | |||
| α-BHCa | <0.01 | – | 5 |
| β-BHCa | <0.02 | – | 5 |
| γ-BHCa | <0.01 | – | 5 |
| δ-BHCa | <0.01 | – | 5 |
| Heptachlora | <0.01 | – | 5 |
| Aldrina | <0.01 | – | 5 |
| Heptachlor epoxidea | <0.01 | – | 5 |
| DDEa | <0.01 | – | 5 |
| DDDa | <0.01 | – | 5 |
| DDTa | <0.01 | – | 5 |
| HCBa | <0.01 | – | 5 |
| Mirexa | <0.01 | – | 5 |
| Methoxychlora | <0.05 | – | 5 |
| Dieldrina | <0.01 | – | 5 |
| Endrina | <0.01 | – | 5 |
| Telodrina | <0.01 | – | 5 |
| Chlordanea | <0.05 | – | 5 |
| Toxaphenea | <0.10 | – | 5 |
| Estimated PCBsa | <0.20 | – | 5 |
| Ronnela | <0.01 | – | 5 |
| Ethiona | <0.02 | – | 5 |
| Trithiona | <0.05 | – | 5 |
| Diazinona | <0.10 | – | 5 |
| Methyl chlorpyrifos | 0.074 ± 0.054 | 0.020–0.170 | 5 |
| Methyl parathiona | <0.02 | – | 5 |
| Ethyl parathiona | <0.02 | – | 5 |
| Malathion | 0.065 ± 0.025 | 0.020–0.094 | 5 |
| Endosulfan Ia | <0.01 | – | 5 |
| Endosulfan IIa | <0.01 | – | 5 |
| Endosulfane sulfatea | <0.03 | – | 5 |
Appendix C. Sentinel Animal Program
C.1. Methods
Rodents used in the National Toxicology Program are produced in optimally clean facilities to eliminate potential pathogens that might affect study results. The Sentinel Animal Program is part of the periodic monitoring of animal health that occurs during the toxicological evaluation of test compounds. Under this program, the disease state of the rodents is monitored via sera or feces from extra (sentinel) or dosed animals in the study rooms. The sentinel animals and the study animals are subject to identical environmental conditions. Furthermore, the sentinel animals are from the same production source and weanling groups as the animals used for the studies of test compounds.
In these toxicity studies, blood samples were collected from each sentinel animal, allowed to clot and the serum was separated. All samples were processed appropriately with serology testing performed by BioReliance Corp., Rockville, MD for the 2-week studies and IDEXX BioResearch (formerly Rodent Animal Diagnostic Laboratory (RADIL), University of Missouri), Columbia, MO, for the 3-month studies, for determination of the presence of pathogens. Evaluation for endo- and ectoparasites was performed in-house by the testing laboratory.
The laboratory methods and agents for which testing was performed are tabulated below; the times at which samples were collected during the studies are also listed (Table C-1, Table C-2).
Table C-1. Methods and Results for Sentinel Animal Testing in Male and Female Rats
| Collection Time Points | Two-week Study (F344/NTac Rats) | Three-month Study (Wistar Han Rats) | ||
|---|---|---|---|---|
| End of Quarantine | Quarantinea | 4 Weeksb | End of Study | |
| Number examined (males/females) | 5/5 | 0/10 | 0/10 | 5/5 |
| Method/test | ||||
| Enzyme-linked immunosorbent assay (ELISA) | ||||
Pneumonia virus of mice (PVM) | – | NT | NT | NT |
Rat coronavirus/sialodacryoadenitis virus (RCV/SDA) | – | NT | NT | NT |
Sendai | – | NT | NT | NT |
| Multiplex fluorescent immunoassay (MFI) | ||||
Kilham rat virus (KRV) | NT | – | – | – |
Mycoplasma pulmonis | NT | – | – | – |
Parvo NS-1 | NT | – | – | – |
Pneumonia virus of mice (PVM) | NT | – | – | – |
Rat coronavirus/sialodacryoadenitis virus (RCV/SDA) | NT | – | – | – |
Rat minute virus (RMV) | NT | – | – | – |
Rat parvo virus (RPV) | NT | – | – | – |
Rat theilovirus (RTV) | NT | – | NT | – |
Sendai | NT | – | – | – |
Theiler’s murine encephalomyelitis virus (TMEV) | NT | – | – | – |
Toolan’s H-1 | NT | – | – | – |
| Immunofluorescence assay (IFA) | ||||
Parvovirus | – | NT | NT | NT |
Table C-2. Methods and Results for Sentinel Animal Testing in Male and Female B6C3F1/N Mice
| Collection Time Points | Two-week Study | Three-month Study | |
|---|---|---|---|
| Quarantine | 1 Month | End of Study | |
| Number examined (males/females) | 5/5 | 5/5 | 5/5 |
| Method/test | |||
| Enzyme-linked immunosorbent assay (ELISA) | |||
| Ectromelia virus | – | NT | NT |
| Epizootic diarrhea of infant mice (EDIM) | – | NT | NT |
| Lymphocytic choriomeningitis virus (LCMV) | – | NT | NT |
| Mouse adenovirus (MAd-1) | – | NT | NT |
| Mouse hepatitis virus (MHV) | – | NT | NT |
| Mouse parvovirus (MPV) | – | NT | NT |
| Mouse minute virus (MMV) | – | NT | NT |
| Pneumonia virus of mice (PVM) | – | NT | NT |
| Reovirus type 3 (Reo-3) | – | NT | NT |
| Sendai | – | NT | NT |
| Theiler’s encephalomyelitis virus (TMEV GD VII) | – | NT | NT |
| Multiplex fluorescent immunoassay (MFI) | |||
| Ectromelia virus | NT | – | – |
| Epizootic diarrhea of infant mice (EDIM) | NT | – | – |
| Lymphocytic choriomeningitis virus | NT | – | – |
| Mycoplasma pulmonis | NT | – | – |
| Mouse hepatitis virus (MHV) | NT | – | – |
| Mouse norovirus (MNV) | NT | – | – |
| Parvo NS-1 | NT | – | – |
| Mouse parvovirus (MPV) | NT | – | – |
| Minute virus of mice (MVM) | NT | – | – |
| Pneumonia virus of mice (PVM) | NT | – | – |
| Reovirus (REO3) | NT | – | – |
| Sendai | NT | – | – |
| Theiler’s murine encephalomyelitis virus (TMEV) GDVII | NT | – | – |
C.2. Results
F344/NTac Rats: All test results were negative.
Wistar Han Rats: All test results were negative.
B6C3F1/N Mice: All test results were negative.
Appendix D. Trans-resveratrol Internal Dose Assessment
D.1. Sample Collection
Biological samples were collected from Wistar Han rats in the 0, 78, 312.5, and 1,250 mg/kg/day trans-resveratrol (RES) dose groups and stored at approximately −20°C before shipment on dry ice to RTI International (Research Triangle Park, NC) for analysis to confirm internal concentration. On gestation day (GD) 18, blood was collected from the retroorbital sinus of three randomly selected dams from each dose group at 30 minutes, 60 minutes, or 90 minutes after RES administration (nine dams per dose group in total). Animals were anesthetized with a carbon dioxide/oxygen mixture and blood was collected into tubes containing sodium heparin, centrifuged, and the plasma harvested. The dams were then humanely euthanized with carbon dioxide, and the fetuses were removed and individually flash frozen in liquid nitrogen. On postnatal day (PND) 4, 10 male and 10 female randomly selected standardized pups for each dose group were humanely euthanized by decapitation, placed into individual vials (one pup per vial), and flash frozen in liquid nitrogen. On PND 21, blood was collected via cardiac puncture from five male and five female randomly selected, standardized pups for each dose group. Animals were first anesthetized with a carbon dioxide/oxygen mixture and blood was then collected into tubes containing lithium heparin, centrifuged, and the plasma harvested. After blood collection, the pups were humanely euthanized by carbon dioxide inhalation overdose and were disposed of without further evaluation. At study termination, blood was collected from the retroorbital site of five randomly selected animals per sex for each dose group. Animals were anesthetized with a carbon dioxide/oxygen mixture and blood was collected into tubes containing sodium heparin, centrifuged, and the plasma harvested.
D.2. Sample Analysis
Concentrations of RES in rat blood plasma and homogenized fetal tissues were quantified using a validated analytical method; method validation data are given in Table D-1. All sample handling and analysis was performed under yellow light to minimize the conversion of trans-resveratrol to the cis- form.
Plasma samples were allowed to equilibrate to room temperature and were mixed well prior to removing sample aliquots for analysis. A 50 μL aliquot was transferred from each sample to a 1.5 mL microcentrifuge tube to which 50 μL of methanol was added, followed by 20 μL of internal standard (IS) solution (100 ng 2′,4′-dihydroxypropiophenone/mL methanol) and 200 μL of acetonitrile. All tubes were mixed, then centrifuged for approximately 20 minutes at 0°C. Aliquots of supernatant were transferred to glass autosampler vials for analysis.
Fetuses were removed from freezer storage, and a weight was recorded for a single representative fetus sample in each litter. The samples were pooled by litter into wide-mouth glass bottles, allowed to equilibrate to room temperature, and then homogenized. From each pooled sample an approximately 0.5 g aliquot was transferred to a 20 mL scintillation vial to which a 20 μL aliquot of methanol was added followed by 20 µL of IS solution and 300 μL of deionized water. A 1 mL aliquot of methanol was added to each vial. The vials were mixed, sonicated for approximately 5 minutes, and then centrifuged for approximately 30 minutes. Each supernatant was decanted and filtered into 1.5-mL microcentrifuge tubes, equilibrated in liquid nitrogen, and then centrifuged for approximately 20 minutes at approximately −9°C. Aliquots of supernatant were transferred to glass autosampler vials for analysis.
Each pup sample was removed from freezer storage and the weights of individual samples were recorded. Each sample was then equilibrated in liquid nitrogen, placed into double plastic bags, shattered, transferred to an individual wide-mouth glass bottle, allowed to thaw to room temperature, and then homogenized. For each pup sample, an approximately 0.5 g aliquot of homogenate was transferred to a 20 mL scintillation vial to which was added a 20 μL aliquot of methanol followed by 20 µL of IS solution and 300 μL of deionized water. A 1 mL aliquot of methanol was added to each vial. The vials were mixed, sonicated for approximately 5 minutes, and then centrifuged for approximately 30 minutes. Each supernatant was decanted and filtered into 1.5 mL microcentrifuge tubes, equilibrated in liquid nitrogen, then centrifuged for approximately 20 minutes at approximately −9°C. Aliquots of supernatant were transferred to glass autosampler vials for analysis.
D.3. Instrumentation and Quantitation
Samples were analyzed using a Waters Acquity (Milford, MA) ultra-performance liquid chromatograph (UPLC) coupled with a 4000 QTRAP hybrid triple quadrupole/linear ion trap mass spectrometer with a TurboSpray source (Sciex, Framingham, MA). Chromatographic analysis was performed using a Waters Acquity UPLC HSS T3 column (100 mm × 2.1 mm internal diameter [ID], 1.8 µm particle size) with guard column (5 mm × 2.1 mm ID, 1.8 µm particle size). Two μL of sample were injected onto the column and elution was achieved at ambient temperature using a binary gradient and a flow rate of 0.3 mL/minute. The mobile phases consisted of: (A) 5 mM ammonium acetate in water with 2% (v/v) isopropyl alcohol (pH unadjusted) and (B) methanol with 2% (v/v) isopropyl alcohol. The gradient was 15% B for 2 minutes, 15% to 65% B from 2 to 15 minutes, then to 95% B for 0.5 minutes. The electrospray ion source was operated in negative ion mode with a voltage of −3,700 V and source temperature of 600°C. The collision gas was high, the curtain gas was 15 psi, the nebulizer gas was 60 psi, the auxiliary gas was 40 psi, and the interface heater was on. The selected multiple reaction monitoring (MRM) transitions were m/z 227 → 185 for RES, and m/z 165 → 109 for 2′,4′-dihydroxypropiophenone (IS). The optimized compound-dependent parameters for RES were: declustering potential (DP) = −65 V; entrance potential (EP) = −10 V; collision energy (CE) = −26 V; and collision cell exit potential (CXP) = −15 V.
The performance of the calibration curve was evaluated prior to the analysis of each sample set. A successful calibration was indicated by the following: correlation coefficient (r) ≥ 0.99; relative standard deviation (RSD) less than or equal to ±15% (except at the limit of quantitation [LOQ] where RSD is less than or equal to ±20%); relative error (RE) less than or equal to ±15% (except at the LOQ where RE is less than or equal to ±20%).
Analytical method validation data for resveratrol-3-O-B-D-glucuronide (trans-R3G) and resveratrol-3-O-sulfate (trans-R3S) are given in Table D-2 and Table D-3, respectively. Samples were prepared and analyzed as above for RES except that the selected MRM transitions used for trans-R3G was m/z 403 → 227 and for trans-R3S was m/z 307 → 227. The optimized compound-dependent mass spectrometer parameters for trans-R3G and trans-R3S were: DP = −55 V; EP = −10 V; CE = −34 V; and CXP = −11 V.
Table D-1. Analytical Method Validation and Stability Data for Trans-resveratrol in Wistar Han Plasma, Pup Homogenate, and Fetuses
| Validation Parameter | Rat Plasmaa | Rat Pupa |
|---|---|---|
| Matrix concentration range (ng/mL or ng/g) | 5–5,000 | 10–2,500 |
| LOQ (ng/mL or ng/g) | 5.06 | 10.0 |
| LOD (ng/mL or ng/g) | 1.70 | 2.25 |
| Correlation coefficient (r) | ≥0.99 | ≥0.99 |
| Recovery (%)b | 105 | 70.4 |
| Precision and accuracyc,d | ||
| Intra-day % RSD | ≤7.5 | ≤2.0 |
| Intra-day % RE | ≤ ± 6.2 | ≤ ± 7.3 |
| Inter-day % RSD | ≤7.9 | ≤8.4 |
| Inter-day % RE | ≤ ± 5.8 | ≤ ± 5.2 |
| Dilution verificatione | ||
| % RSD | NA | NA |
| % RE | NA | NA |
| Extract stability (average % RE)c,d | ||
| Ambient storage (RT, ~7 days) | −10.0 to −4.5 | −2.8 to 0.0 |
| Refrigerated storage (4°C, ~7 days) | −4.9 to 4.9 | −8.6 to −1.9 |
| Matrix stability (average % RE)c,f | ||
| Freeze-thaw (3 cycles, over 5–7 days) | −8.7 to −0.1 | −12 to −4.6 |
| Frozen matrix (−80°C for up to ~60 days) | 1.0 | 0.7 |
| Secondary matrix evaluation | Male Rat Plasma | Fetus Homogenate |
| Precision (% RSD)c | ≤7.3 | ≤3.0 |
| Accuracy (% RE)c | ≤ ± 14.5 | ≤ ± 9.6 |
Table D-2. Analytical Method Validation and Stability Data for Trans-resveratrol-3-O-B-D-glucuronide in Wistar Han Plasma, Pup Homogenate, and Fetuses
| Validation Parameter | Rat Plasmaa | Rat Pupa |
|---|---|---|
| Matrix concentration range (ng/mL or ng/g) | 96.5–11,600 | 96.0–12,000 |
| LOQ (ng/mL or ng/g) | 96.5 | 96.0 |
| LOD (ng/mL or ng/g) | 30.7 | 27.3 |
| Correlation coefficient (r) | ≥0.99 | ≥0.99 |
| Recovery (%)b | 111 | 76.8 |
| Precision and accuracyc,d | ||
| Intra-day % RSD | ≤5.7 | ≤8.6 |
| Intra-day % RE | ≤ ± 5.0 | ≤ ± 3.3 |
| Inter-day % RSD | ≤8.9 | ≤5.7 |
| Inter-day % RE | ≤ ± 3.9 | ≤ ± 3.0 |
| Dilution verification | ||
| % RSD | 6.8 | 10 |
| % RE | −12.3 | −20 |
| Extract stability (average % RE)c,d,e | ||
| Ambient storage (RT, ~7 days) | NA | NA |
| Refrigerated storage (4°C, ~7 days) | NA | NA |
| Matrix stability (average % RE)c,f | ||
| Freeze-thaw (3 cycles, over 5–7 days) | −18.2 to −3.3 | −12 to 12 |
| Frozen matrix (−80°C for up to ~60 days) | −10.2 | NAe |
| Secondary matrix evaluation | Male Rat Plasmae | Fetus Homogenate |
| Precision (% RSD)c | NA | ≤4.1 |
| Accuracy (% RE)c | NA | ≤ ± 13 |
Table D-3. Analytical Method Validation and Stability Data for Trans-resveratrol-3-O-sulfate in Wistar Han Plasma, Pup Homogenate, and Fetuses
| Validation Parameter | Rat Plasmaa | Rat Pupa |
|---|---|---|
| Matrix concentration range (ng/mL or ng/g) | 5.03–12,100 | 99.2–12,400 |
| LOQ (ng/mL or ng/g) | 5.03 | 99.2 |
| LOD (ng/mL or ng/g) | 1.48 | 17.5 |
| Correlation coefficient (r) | ≥0.99 | ≥0.99 |
| Recovery (%)b | 115 | 109 |
| Precision and accuracyc,d | ||
| Intra-day % RSD | ≤12 | ≤4.3 |
| Intra-day % RE | ≤ ± 11.1 | ≤ ± 5.2 |
| Inter-day % RSD | ≤12 | ≤9.4 |
| Inter-day % RE | ≤ ± 10.3 | ≤ ± 4.3 |
| Dilution verification | ||
| % RSD | 11 | NAe |
| % RE | −3.0 | NAe |
| Extract stability (average % RE)c,d,e | ||
| Ambient storage (RT, ~7 days) | NA | NA |
| Refrigerated storage (4°C, ~7 days) | NA | NA |
| Matrix stability (average % RE)c,f | ||
| Freeze-thaw (3 cycles, over 5–7 days) | −5.7 to 4.1 | −6.0 to 2.3 |
| Frozen matrix (−80°C for up to ~60 days) | 0.7 | −10 |
| Secondary matrix evaluation | Male Rat Plasmae | Fetus Homogenate |
| Precision (% RSD)c | NA | ≤3.4 |
| Accuracy (% RE)c | NA | ≤ ± 17 |
Appendix E. Genetic Toxicology
E.1. Bacterial Mutagenicity
E.1.1. Bacterial Mutagenicity Test Protocol
Testing procedures were those reported by Zeiger et al.163 Briefly, a commercially obtained sample of trans-resveratrol (RES) (lot number 02-18090-601 from ChromaDex) was sent to the laboratory under code. It was incubated with each of the Salmonella typhimurium tester strains (TA98, TA100, and TA102) either in buffer or S9 mix (metabolic activation enzymes and cofactors from Aroclor 1254-induced male Sprague Dawley rat liver) for 20 minutes at 37°C. Top agar supplemented with L-histidine and d-biotin was added, and the contents of the tubes were mixed and poured onto the surfaces of minimal glucose agar plates. Histidine-independent mutant colonies arising on these plates were counted after incubation for 2 days at 37°C.
163. Zeiger E, Anderson B, Haworth S, Lawlor T, Mortelmans K. Salmonella mutagenicity tests: V. Results from the testing of 311 chemicals. Environ Mol Mutagen. 1992; 19 Suppl 21:2-141. DOI: 10.1002/em.2850190603 PubMed: 1541260
Each trial consisted of triplicate plates of concurrent positive and negative controls and at least five doses of RES. RES was tested up to 3,333 μg per plate for each tester strain in the presence or absence of S9 mix.
In this assay, a positive response is defined as a reproducible, dose-related increase in histidine-independent (revertant) colonies in any one strain/activation combination. An equivocal response is defined as an increase in revertants that is not related to dose, is not reproducible, or is not of sufficient magnitude to support a determination of mutagenicity. A negative response is obtained when no increase in revertant colonies is observed after chemical treatment. No minimum percentage or fold increase is required for a chemical to be judged positive or weakly positive, although positive calls are typically reserved for increases in mutant colonies that are at least twofold over background.
E.1.2. Results
RES (33 to 3,333 µg/plate) was not mutagenic in S. typhimurium strains TA98, TA100, or TA102 when tested with or without exogenous metabolic activation provided by Aroclor 1254-induced rat liver S9 and cofactors (Table E-1).
Table E-1. Mutagenicity of Trans-resveratrol in Bacterial Tester Strainsa
| Strain | Concentration (μg/plate) | Without S9 | With 10% Rat S9 |
|---|---|---|---|
| TA98 | |||
| 0 | 15 ± 1 | 43 ± 3 | |
| 33 | 13 ± 2 | 25 ± 2 | |
| 100 | 19 ± 1 | 33 ± 2 | |
| 333 | 19 ± 1 | 38 ± 1 | |
| 1,000 | 16 ± 2 | 31 ± 3 | |
| 3,333 | 14 ± 1 | 34 ± 3 | |
| Trial summary | Negative | Negative | |
| Positive controlb | 97 ± 4 | 594 ± 29 | |
| TA100 | |||
| 0 | 126 ± 9 | 147 ± 2 | |
| 33 | 149 ± 3 | 139 ± 5 | |
| 100 | 141 ± 6 | 148 ± 5 | |
| 333 | 137 ± 1 | 136 ± 5 | |
| 1,000 | 133 ± 5 | 108 ± 4 | |
| 3,333 | 51 ± 14 | 74 ± 21 | |
| Trial summary | Negative | Negative | |
| Positive controlc | 434 ± 21 | 929 ± 43 | |
| TA102 | |||
| 0 | 286 ± 14 | 384 ± 15 | |
| 34 | 288 ± 4 | 389 ± 18 | |
| 102 | 299 ± 8 | 386 ± 12 | |
| 340 | 304 ± 11 | 397 ± 19 | |
| 1,019 | 272 ± 29 | 365 ± 43 | |
| 3,333 | 132 ± 17 | 180 ± 21 | |
| Trial summary | Negative | Negative | |
| Positive controld | 930 ± 64 | 1,310 ± 22 | |
E.2. Micronucleus Assay
E.2.1. Peripheral Blood Micronucleus Test Protocol
At termination of the 3-month toxicity studies of RES, blood samples were collected from male and female Wistar Han rats and B6C3F1/N mice, placed in ethylenediaminetetraacetic acid (EDTA)-coated tubes, fixed in ultracold methanol, and frozen at −80°C until analysis. Thawed blood samples were analyzed for frequency of micronucleated immature erythrocytes (polychromatic erythrocytes [PCEs], reticulocytes) and mature erythrocytes (normochromatic erythrocytes [NCEs]) using a flow cytometer164; both the mature and immature reticulocyte population can be analyzed separately by employing special cell surface markers to differentiate the two cell types. Because the very young reticulocyte subpopulation (CD71+ cells) can be targeted using this technique, rat blood samples can be analyzed for damage in the bone marrow that occurred within the past 24 to 48 hours, before the rat spleen appreciably alters the percentage of PCEs in circulation.165 In mice, both the mature and immature erythrocyte populations can be evaluated for micronucleus frequency because the mouse spleen does not sequester and eliminate damaged erythrocytes. Damaged erythrocytes achieve steady state in the peripheral blood of mice after four weeks of continuous exposure. Approximately 20,000 PCEs and 1 × 10⁶ NCEs were analyzed per animal for frequency of micronucleated cells, and the percentage of immature erythrocytes (% PCE) was calculated as a measure of bone marrow toxicity resulting from chemical exposure.
164. Witt KL, Livanos E, Kissling GE, Torous DK, Caspary W, Tice RR, Recio L. Comparison of flow cytometry- and microscopy-based methods for measuring micronucleated reticulocyte frequencies in rodents treated with nongenotoxic and genotoxic chemicals. Mutat Res. 2008; 649(1-2):101-113. DOI: 10.1016/j.mrgentox.2007.08.004 PubMed: 17869571
165. Dertinger SD, Camphausen K, MacGregor JT, Bishop ME, Torous DK, Avlasevich S, Cairns S, Tometsko CR, Menard C, Muanza T. Three‐color labeling method for flow cytometric measurement of cytogenetic damage in rodent and human blood. Environ Mol Mutagen. 2004; 44(5):427-435. DOI: 10.1002/em.20075 PubMed: 15517570
Prior experience with the large number of cells scored using flow cytometric scoring techniques166 suggests it is reasonable to assume the proportion of micronucleated reticulocytes is approximately normally distributed. The statistical tests selected for trend and for pairwise comparisons with the vehicle control group depend on whether the variances among the groups are equal. The Levene test at α = 0.05 is used to test for equal variances. In the case of equal variances, linear regression is used to test for a linear trend with dose and the Williams test is used to test for pairwise differences between each dosed group and the vehicle control group. In the case of unequal variances, the Jonckheere test is used to test for linear trend and the Dunn test is used for pairwise comparisons of each dosed group with the vehicle control group. To correct for multiple pairwise comparisons, the p value for each comparison with the vehicle control group is multiplied by the number of comparisons made. If this product is >1.00, it is replaced with 1.00. Trend tests and pairwise comparisons with the vehicle control groups are considered statistically significant at p ≤ 0.025.
166. Kissling GE, Dertinger SD, Hayashi M, MacGregor JT. Sensitivity of the erythrocyte micronucleus assay: Dependence on number of cells scored and inter-animal variability. Mutat Res. 2007; 634(1-2):235-240. DOI: 10.1016/j.mrgentox.2007.07.010 PubMed: 17851117
In the micronucleus test, it is preferable to base a positive result on the presence of both a positive trend as well as at least one significantly elevated dosed group compared with the corresponding vehicle control group. The presence of either a positive trend or a single significant dosed group generally results in an equivocal call. The absence of both a trend and a significant dosed group results in a negative call. Ultimately, the scientific staff determines the final call after considering the results of statistical analyses, reproducibility of any effects observed (in acute studies), and the magnitudes of those effects.
E.2.2. Evaluation Protocol
These are the basic guidelines for arriving at an overall result for assays performed by the National Toxicology Program. Statistical as well as biological factors are considered. For an individual assay, the statistical procedures for data analysis are described in the preceding protocols. There have been instances, however, in which multiple samples of a chemical were tested in the same assay, and different results were obtained among the samples and/or among laboratories. Results from more than one aliquot or from more than one laboratory are not simply combined into an overall result. Rather, all the data are critically evaluated, particularly those concerning pertinent protocol variations, in determining the weight of evidence for an overall conclusion of chemical activity in an assay. In addition to multiple aliquots, the in vitro assays have another variable that must be considered in arriving at an overall test result. In vitro assays are conducted with and without exogenous metabolic activation. Results obtained in the absence of activation are not combined with results obtained in the presence of activation; each testing condition is evaluated separately. The summary table in the abstract of this toxicity report presents a scientific judgment of the overall evidence for activity of the chemical in an assay.
E.2.3. Results
In rats, the reticulocyte population is the only red blood cell population that can be accurately assessed for micronucleus frequency in peripheral blood due to efficient splenic scavenging of damaged erythrocytes soon after they emerge from the bone marrow. In both sexes of Wistar Han rats in the 3-month study, there were no significant increases in the frequencies of micronucleated PCEs (Table E-2). A positive trend in the percentage of PCEs was observed in female rats; however, the absolute increase (0.38%) in the 1,250 mg RES/kg body weight/day (mg/kg/day) group compared to the vehicle control group was very small and was not considered to be biologically relevant. No increases in the frequency of micronucleated erythrocytes (either immature or mature) were seen in the peripheral blood of female mice in the 3-month study (Table E-3). Significant increases in micronucleated NCEs were observed for every dosed group in male mice; however, the absolute difference in micronucleated NCEs in the dosed groups relative to the vehicle control group ranged from 0.06% to 0.16%. These very small increases were not considered to be biologically relevant.
Table E-2. Frequency of Micronuclei in Peripheral Blood Erythrocytes of Male and Female Wistar Han Rats in the Perinatal and Three-month Gavage Study of Trans-resveratrola
| Micronucleated PCEs/1,000 PCEsb | P Valuec | Micronucleated NCEs/1,000 NCEsb | P Valuec | PCEs (%)b | P Valuec | |
|---|---|---|---|---|---|---|
| n | 5 | 5 | 5 | |||
| Male | ||||||
| Dose (mg/kg/day) | ||||||
| 0 | 0.890 ± 0.108 | 0.138 ± 0.018 | 0.937 ± 0.129 | |||
| 78 | 0.760 ± 0.144 | 1.000 | 0.106 ± 0.022 | 1.000 | 0.982 ± 0.062 | 0.616 |
| 156 | 1.610 ± 0.360 | 0.503 | 0.281 ± 0.053 | 0.555 | 1.506 ± 0.115 | 0.115 |
| 312.5 | 0.820 ± 0.041 | 1.000 | 0.173 ± 0.073 | 1.000 | 1.134 ± 0.118 | 0.122 |
| 625 | 0.795 ± 0.104 | 1.000 | 0.082 ± 0.011 | 1.000 | 0.997 ± 0.142 | 0.125 |
| 1,250 | 0.720 ± 0.075 | 1.000 | 0.134 ± 0.039 | 1.000 | 1.126 ± 0.085 | 0.125 |
| Trendd | p = 0.878 | p = 0.907 | p = 0.872 | |||
| Female | ||||||
| Dose (mg/kg/day) | ||||||
| 0 | 0.708 ± 0.092 | 0.073 ± 0.007 | 0.814 ± 0.024 | |||
| 78 | 0.680 ± 0.150 | 0.531 | 0.063 ± 0.008 | 1.000 | 0.867 ± 0.095 | 0.761 |
| 156 | 0.750 ± 0.175 | 0.595 | 0.074 ± 0.010 | 1.000 | 1.027 ± 0.126 | 0.284 |
| 312.5 | 0.780 ± 0.102 | 0.629 | 0.081 ± 0.015 | 1.000 | 0.971 ± 0.088 | 0.305 |
| 625 | 0.670 ± 0.115 | 0.649 | 0.077 ± 0.010 | 1.000 | 0.936 ± 0.063 | 0.314 |
| 1,250 | 0.610 ± 0.151 | 0.661 | 0.091 ± 0.018 | 1.000 | 1.198 ± 0.132 | 0.018 |
| Trendd | p = 0.770 | p = 0.168 | p = 0.016 | |||
Table E-3. Frequency of Micronuclei in Peripheral Blood Erythrocytes of Male and Female B6C3F1/N Mice in the Three-month Gavage Study of Trans-resveratrola
| Micronucleated PCEs/1,000 PCEsb | P Valuec | Micronucleated NCEs/1,000 NCEsb | P Valuec | PCEs (%)b | P Valuec | |
|---|---|---|---|---|---|---|
| n | 5 | 5 | 5 | |||
| Male | ||||||
| Dose (mg/kg/day) | ||||||
| 0 | 2.610 ± 0.185 | 1.429 ± 0.035 | 1.367 ± 0.046 | |||
| 156 | 2.839 ± 0.142 | 0.416 | 1.576 ± 0.029 | 0.014 | 1.458 ± 0.087 | 0.546 |
| 312 | 2.570 ± 0.213 | 0.489 | 1.584 ± 0.035 | 0.016 | 1.417 ± 0.066 | 0.652 |
| 625 | 2.600 ± 0.168 | 0.520 | 1.488 ± 0.023 | 0.016 | 1.387 ± 0.053 | 0.695 |
| 1,250 | 2.780 ± 0.244 | 0.356 | 1.546 ± 0.051 | 0.016 | 1.487 ± 0.029 | 0.202 |
| 2,500 | 2.790 ± 0.185 | 0.349 | 1.577 ± 0.036 | 0.005 | 1.518 ± 0.066 | 0.114 |
| Trendd | p = 0.259 | p = 0.090 | p = 0.073 | |||
| Female | ||||||
| Dose (mg/kg/day) | ||||||
| 0 | 2.730 ± 0.362 | 1.209 ± 0.061 | 1.699 ± 0.246 | |||
| 156 | 2.389 ± 0.193 | 0.869 | 1.181 ± 0.061 | 1.000 | 2.004 ± 0.208 | 0.463 |
| 312 | 2.630 ± 0.295 | 0.927 | 1.132 ± 0.043 | 1.000 | 1.799 ± 0.206 | 0.555 |
| 625 | 2.518 ± 0.102 | 0.944 | 1.120 ± 0.046 | 1.000 | 1.762 ± 0.109 | 0.594 |
| 1,250 | 1.900 ± 0.208 | 0.952 | 1.085 ± 0.015 | 1.000 | 1.905 ± 0.171 | 0.467 |
| 2,500 | 1.930 ± 0.146 | 0.958 | 1.170 ± 0.020 | 1.000 | 2.059 ± 0.146 | 0.175 |
| Trendd | p = 0.996 | p = 0.813 | p = 0.197 | |||
Appendix F. Supplemental Data
Tables with supplemental data can be found here: https://doi.org/10.22427/NTP-DATA-TOX-102.
About This Report
Foreword
The National Toxicology Program (NTP), established in 1978, is an interagency program within the Public Health Service of the U.S. Department of Health and Human Services. Its activities are executed through a partnership of the National Institute for Occupational Safety and Health (part of the Centers for Disease Control and Prevention), the Food and Drug Administration (primarily at the National Center for Toxicological Research), and the National Institute of Environmental Health Sciences (part of the National Institutes of Health), where the program is administratively located. NTP offers a unique venue for the testing, research, and analysis of agents of concern to identify toxic and biological effects, provide information that strengthens the science base, and inform decisions by health regulatory and research agencies to safeguard public health. NTP also works to develop and apply new and improved methods and approaches that advance toxicology and better assess health effects from environmental exposures.
The Toxicity Report series began in 1991. The studies described in the NTP Toxicity Report series are designed and conducted to characterize and evaluate the toxicological potential of selected substances in laboratory animals (usually two species, rats and mice). Substances (e.g., chemicals, physical agents, and mixtures) selected for NTP toxicity studies are chosen primarily on the basis of human exposure, level of commercial production, and chemical structure. The interpretive conclusions presented in the Toxicity Reports are derived solely from the results of these NTP studies, and extrapolation of these results to other species, including characterization of hazards and risks to humans, requires analyses beyond the intent of these reports. Selection for study per se is not an indicator of a substance’s toxic potential.
NTP conducts its studies in compliance with its laboratory health and safety guidelines and Food and Drug Administration Good Laboratory Practice Regulations and meets or exceeds all applicable federal, state, and local health and safety regulations. Animal care and use are in accordance with the Public Health Service Policy on Humane Care and Use of Laboratory Animals. Studies are subjected to retrospective quality assurance audits before they are presented for public review. Draft reports undergo external peer review before they are finalized and published.
The NTP Toxicity Reports are available free of charge on the NTP website and cataloged in PubMed, a free resource developed and maintained by the National Library of Medicine (part of the National Institutes of Health). Data for these studies are included in NTP’s Chemical Effects in Biological Systems database.
For questions about the reports and studies, please email NTP or call 984-287-3211.
Collaborators
Division of the National Toxicology Program, National Institute of Environmental Health Sciences, Research Triangle Park, North Carolina, USA
Designed studies, evaluated and interpreted results, and reported findings
M.C. Huang, Ph.D., Study Scientist
S.A. Elmore, D.V.M., M.S., Study Pathologist
C.R. Blystone, Ph.D.
B.J. Collins, M.S.
M.C. Cora, D.V.M.
D. Germolec, Ph.D.
M.J. Hooth, Ph.D.
A.P. King-Herbert, D.V.M.
D.E. Malarkey, D.V.M., Ph.D.
B.S. McIntyre, Ph.D.
G.K. Roberts, Ph.D.
K.A. Shipkowski, Ph.D.
K.R. Shockley, Ph.D.
S.L. Smith-Roe, Ph.D.
M.D. Stout, Ph.D.
G.S. Travlos, D.V.M.
S. Waidyanatha, Ph.D.
N.J. Walker, Ph.D.
K.L. Witt, M.S.
Provided oversight for data management
J.M. Fostel, Ph.D.
Battelle, Columbus, Ohio, USA
Conducted studies and evaluated pathology findings
M.R. Hejtmancik, Ph.D., Principal Investigator
C.A. Colleton, D.V.M.
R.R. Dalefield, Ph.D.
L.M. Fomby, D.V.M., Ph.D.
K.A.B. Knostman, D.V.M., Ph.D.
M.J. Ryan, D.V.M., Ph.D.
A.J. Skowronek, D.V.M., Ph.D.
D.Y. Vasconcelos, D.V.M., Ph.D.
Conducted prestart chemistry activities and dose formulations
W.M. Black, B.S.
B.L. Burback, Ph.D.
K.A. Carrico, B.A.
D.A. Contos, M.S.
RTI International, Research Triangle Park, North Carolina, USA
Conducted preliminary chemistry activities, dose formulations, and biological sample chemistry analyses
R.A. Fernando, Ph.D., Principal Investigator
J.C. Blake, B.A.
S.D. Cooper, M.S.
J.W. Lodge, M.A.
M. Silinski, Ph.D.
Provided sperm count and vaginal cytology evaluation (SCVCE) analysis
C.S. Sloan, M.S.
R.W. Tyl, Ph.D.
Pathology Associates, Charles River Laboratories, Inc., Research Triangle Park, North Carolina, USA
Coordinated NTP Pathology Peer Review on rats and mice (3-month studies) (January 13, 2011)
C.L. Johnson, D.V.M.
Experimental Pathology Laboratories, Inc., Research Triangle Park, North Carolina, USA
Provided pathology review
E.T. Adams, D.V.M., Ph.D. (Mice)
R.R. Moore, D.V.M., Ph.D. (Rats)
Contributors
Division of the National Toxicology Program, National Institute of Environmental Health Sciences, Research Triangle Park, North Carolina, USA
Provided oversight for external peer review
E.A. Maull, Ph.D.
S.L. Scruggs, Ph.D.
M.S. Wolfe, Ph.D.
NTP Pathology Peer Review, National Institute of Environmental Health Sciences, Research Triangle Park, North Carolina, USA
Participated in NTP Pathology Peer Review on rats and mice (3-month studies) (January 13, 2011)
M.F. Cesta, D.V.M., Ph.D., National Institute of Environmental Health Sciences
S.A. Elmore, D.V.M., M.S., National Institute of Environmental Health Sciences
D.E. Malarkey, D.V.M., Ph.D., National Institute of Environmental Health Sciences
NTP Pathology Peer Review, National Institute of Environmental Health Sciences, Research Triangle Park, North Carolina, USA
Participated in NTP Pathology Peer Review on rats and mice (3-month studies) (February 17, 2011)
S.A. Elmore, D.V.M., M.S., National Institute of Environmental Health Sciences
G.P. Flake, M.D., National Institute of Environmental Health Sciences
Integrated Laboratory Systems, LLC, Research Triangle Park, North Carolina, USA
Conducted micronucleus assays
L. Recio, Ph.D., Principal Investigator
C.A. Hobbs, Ph.D.
C.D. Swartz, D.V.M., Ph.D.
BioReliance Corporation, Rockville, Maryland, USA Conducted bacterial mutagenicity assays
M. Wenk, Ph.D., Principal Investigator
CSS Corporation, Research Triangle Park, North Carolina, USA
Prepared quality assessment audits
S. Brecher, Ph.D., Principal Investigator
S. Iyer, B.S.
V.S. Tharakan, D.V.M.
ASRC Federal, Research Triangle Park, North Carolina, USA
Prepared data for report
P. Brown, B.S.
H. Gong, M.S.
C. Martini, B.S.
C. Myers, M.S.
N. Sayers, B.S.
M. Shaw, B.S.
R. Whittlesey, M.S.
Social & Scientific Systems, a DLH Company, Research Triangle Park, North Carolina, USA
Provided statistical analyses
S.J. McBride, Ph.D., Principal Investigator
L.J. Betz, M.S.
S.F. Harris, M.S.
J.D. Krause, Ph.D.
ICF, Fairfax, Virginia, USA
Provided contract oversight
D. Burch, M.E.M., Principal Investigator
J.A. Wignall, M.S.P.H.
Prepared and edited report K.S. Duke, Ph.D.
S.R. Gunnels, M.A.
T. Hamilton, M.S.
J. Luh, Ph.D.
K.L. McKinley, M.E.M.
M.E. McVey, Ph.D.
J.I. Powers, M.A.P.
J.R. Rochester, Ph.D.
K.E. Setty, Ph.D.
R. Shin, M.H.S.
K.A. Shipkowski, Ph.D.
S.J. Snow, Ph.D.
J.W. Tracy, M.H.S.
Supported external peer review
C.N. Byrd, B.S.
L.M. West, B.S.
Peer Review
The National Toxicology Program (NTP) conducted a peer review of the draft NTP Technical Report on the Toxicity Studies of Trans-resveratrol (CASRN 501-36-0) Administered by Gavage for Two Weeks or Three Months to F344/NTac Rats, Wistar Han [Crl:WI(Han)] Rats, and B6C3F1/N Mice by letter in March and April 2021 by the experts listed below. Reviewer selection and document review followed established NTP practices. The reviewers were charged to:
Peer review the draft NTP Technical Report on the Toxicity Studies of Trans-resveratrol.
Comment on NTP’s interpretations of the data.
NTP carefully considered reviewer comments in finalizing this report.
Peer Reviewers
Devon Andres, Ph.D., DABT
Biologist
Biomedical Advanced Research Development Authority
Washington, District of Columbia, USA
Kevin Pearson, Ph.D.
Professor, Department of Pharmacology and Nutritional Sciences
University of Kentucky College of Medicine
Lexington, Kentucky, USA
Publication Details
Publisher: National Toxicology Program
Publishing Location: Research Triangle Park, NC
ISSN: 2378-8992
DOI: https://doi.org/10.22427/NTP-TOX-102
Report Series: NTP Toxicity Report Series
Report Series Number: 102
Official citation: National Toxicology Program (NTP). 2021. NTP technical report on the toxicity studies of trans-resveratrol (CASRN 501-36-0) administered by gavage for two weeks or three months to F344/NTac rats, Wister Han [Crl:WI(Han)] rats, and B6C3F1/N mice. Research Triangle Park, NC: National Toxicology Program. Toxicity Report 102.
Acknowledgments
This work was supported by the Intramural Research Program (ES103316, ES103318, and ES103319) at the National Institute of Environmental Health Sciences, National Institutes of Health and performed for the National Toxicology Program, Public Health Service, U.S. Department of Health and Human Services under contracts HHSN273201800006C, HHSN273201600011C, GS00Q14OADU417 (Order No. HHSN273201600015U), HHSN273201600020C, HHSN273201500006C, HHSN273201500012C, HHSN273201500014C, HHSN273201400022C, HHSN273201400004C, HHSN273201300009C, HHSN316201200054W, HHSN273201100003C, N01-ES-65554, N01-ES-55541, N01-ES-05455, N01-ES-45517, N01-ES-65557, and N01-ES-75408-21-0-1.