Note on Accessibility: Persons using mobile devices may find some tables are not fully accessible. Note that you can view tables on a larger screen or in the PDF version of the report/monograph. If you need additional assistance, email us or use our contact form and identify the tables for which access is required. We will assist you in accessing the content. NIH has helpful information on accessibility.
Toxicity Report 103
NTP Technical Report on the Toxicity Studies of Select Ionic Liquids (1-Ethyl-3-Methylimidazolium Chloride, 1-Butyl-3-Methylimidazolium Chloride, 1-Butyl-1-Methylpyrrolidinium Chloride, and N-Butylpyridinium Chloride) Administered in Drinking Water to Sprague Dawley (Hsd:Sprague Dawley SD) Rats and B6C3F1/N Mice
Abstract
Ionic liquids (ILs) are synthetic solvents with applications in a variety of industrial and chemical industries. Human exposure to this diverse chemical class is primarily through dermal or oral routes. Research suggests toxicity may be associated with IL structural characteristics, including the type of cation base or alkyl chain substitutions associated with the cation. To further investigate this hypothesis, the National Toxicology Program (NTP) conducted 3-month toxicity studies in male and female Sprague Dawley (Hsd:Sprague Dawley SD) rats and B6C3F1/N mice (n = 10/sex/exposure group; 3 exposure concentrations per IL) to compare the relative toxicities of four ILs administered via drinking water—1-ethyl-3-methylimidazolium chloride (Emim-Cl),1-butyl-3-methylimidazolium chloride (Bmim-Cl), 1-butyl-1-methylpyrrolidinium chloride (Bmpy-Cl), and n-butylpyridinium chloride (NBuPy-Cl).
To select exposure concentrations for the 3-month studies, 2-week drinking water studies in rats and mice were conducted to assess palatability and toxicity of each IL. Informed by the literature and preliminary palatability studies, exposure concentrations in the 2-week studies ranged from 0 to 100 mg/mL. Clinical observations (e.g., thinness and ruffled fur), lower water consumption, and lower mean body weights were associated with higher IL exposure concentrations. At the end of the 2-week exposure period, a range of organ weight changes and histological lesions was observed in rats and mice exposed to ILs. These observations were considered secondary to body weight changes and/or stress, rather than a direct toxic effect from 2-week IL exposure.
Exposure concentrations (ranging from 0 to 30 mg/mL) were selected for the 3-month studies because of the observed relative decreases in mean body weight (≤10%) and water consumption (<25%) in the 2-week studies. Rats were exposed to lower concentrations than mice for Emim-Cl, Bmim-Cl, and NBuPy-Cl. Bmpy-Cl exposure concentrations differed by sex and species. Like the 2-week studies, a general pattern of lower water consumption at higher IL exposure concentrations was observed among rats and mice. Estimated average IL compound consumption indicated that mice consumed more IL per unit of body weight than rats at comparable drinking water concentrations for all ILs.
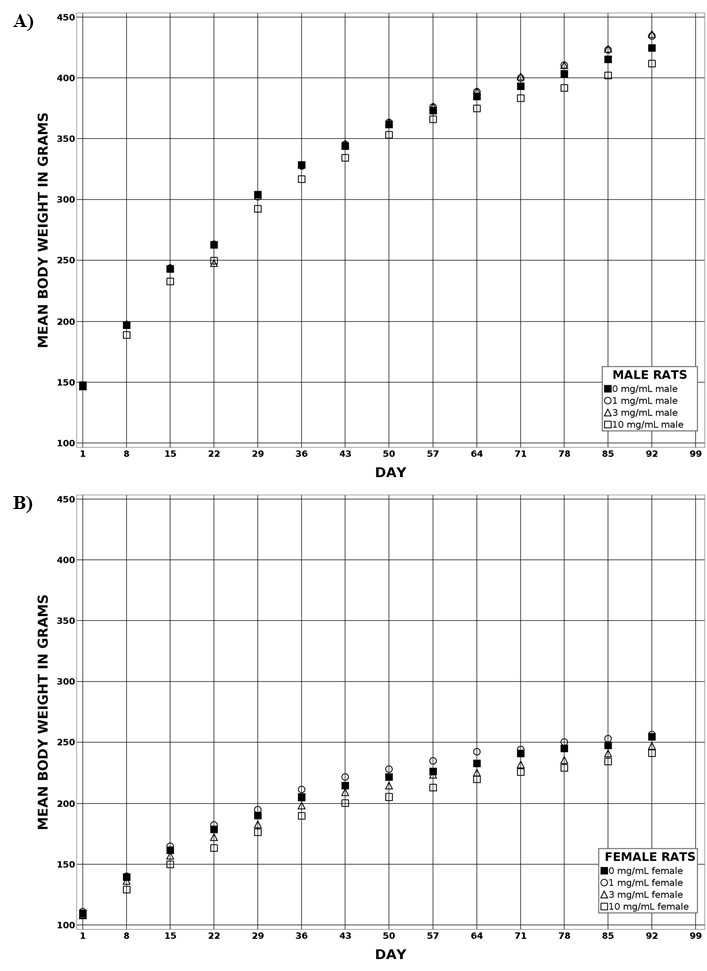
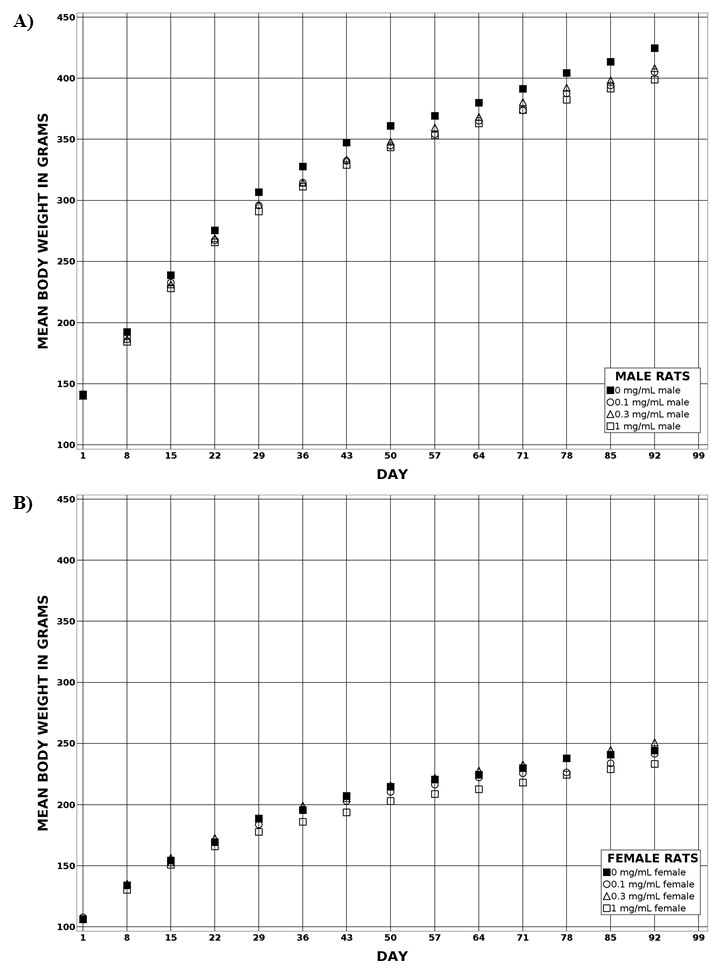
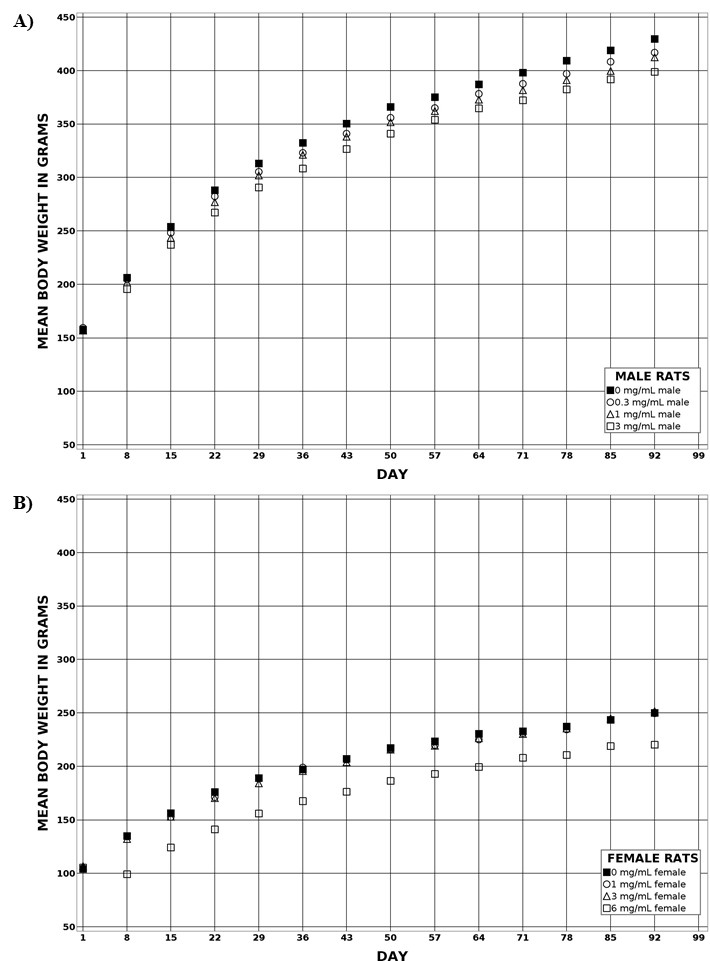
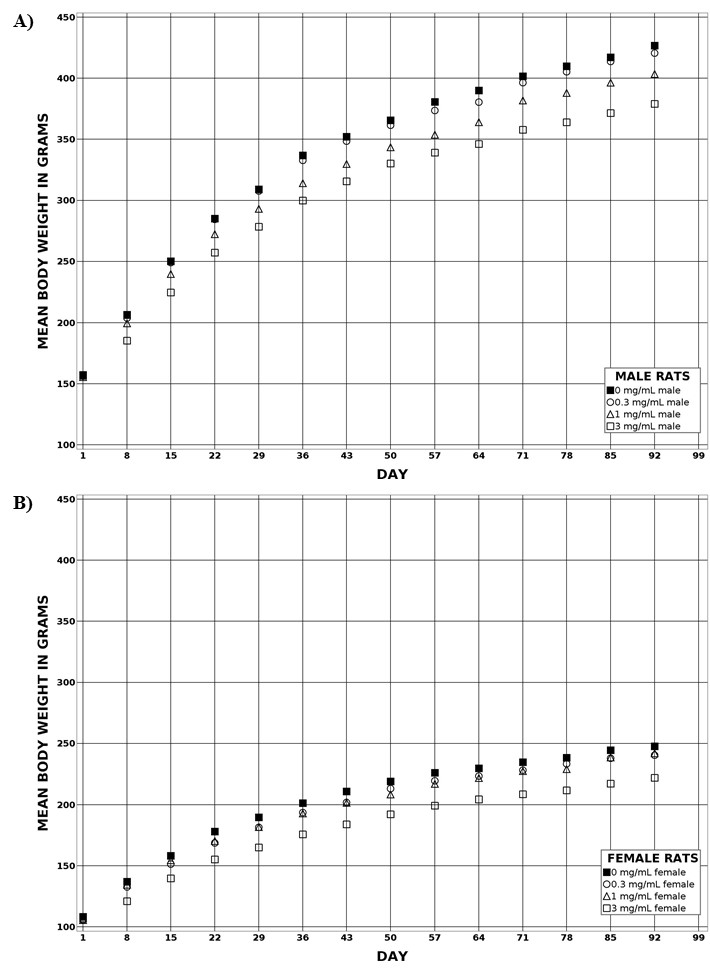
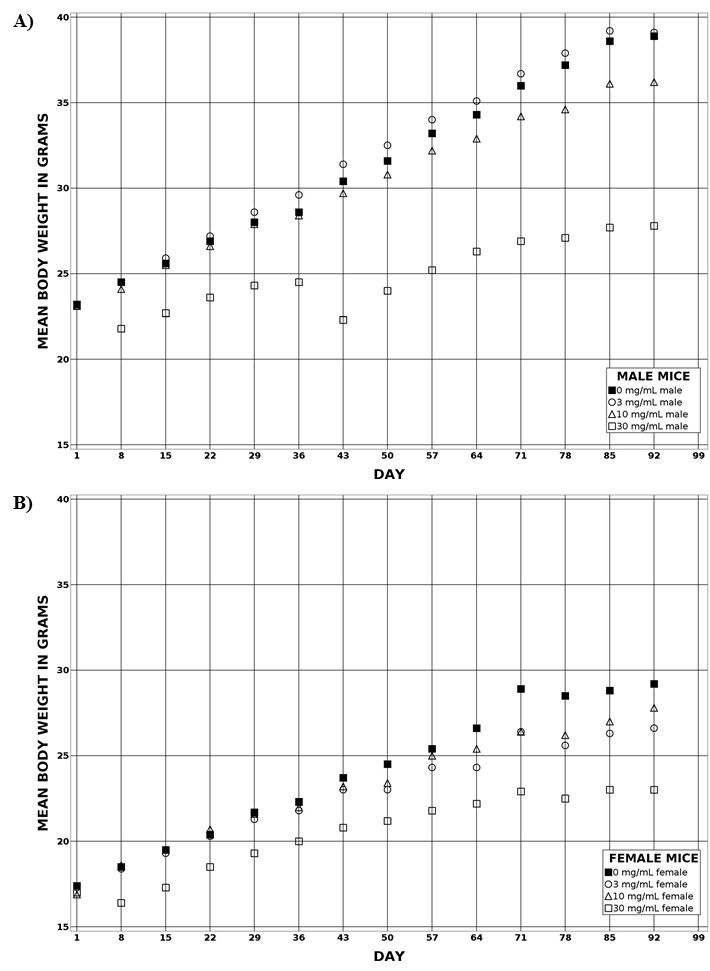
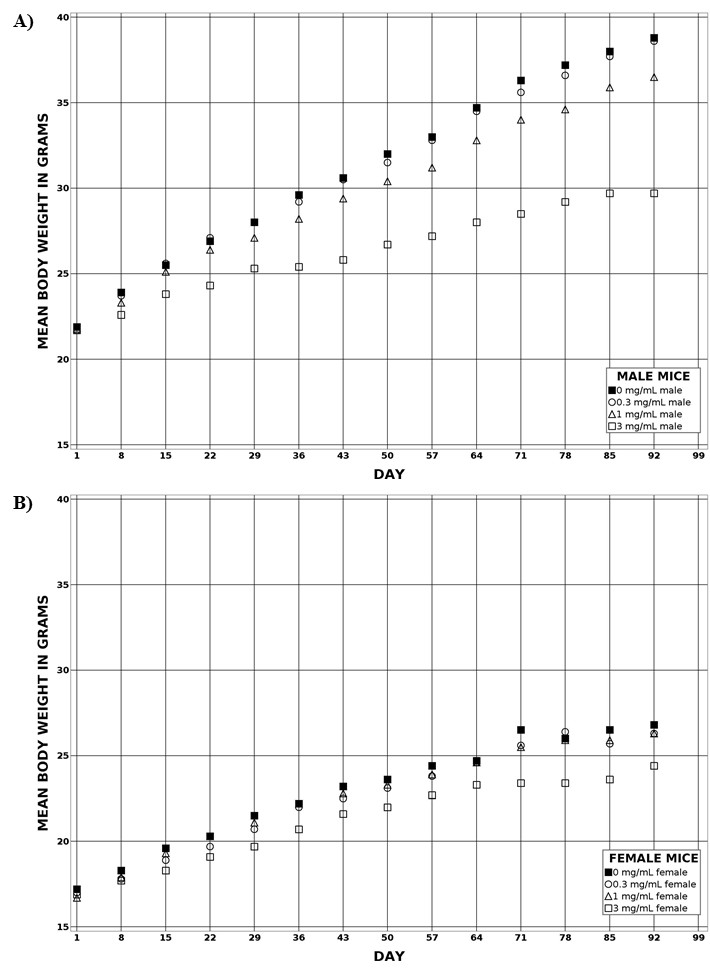
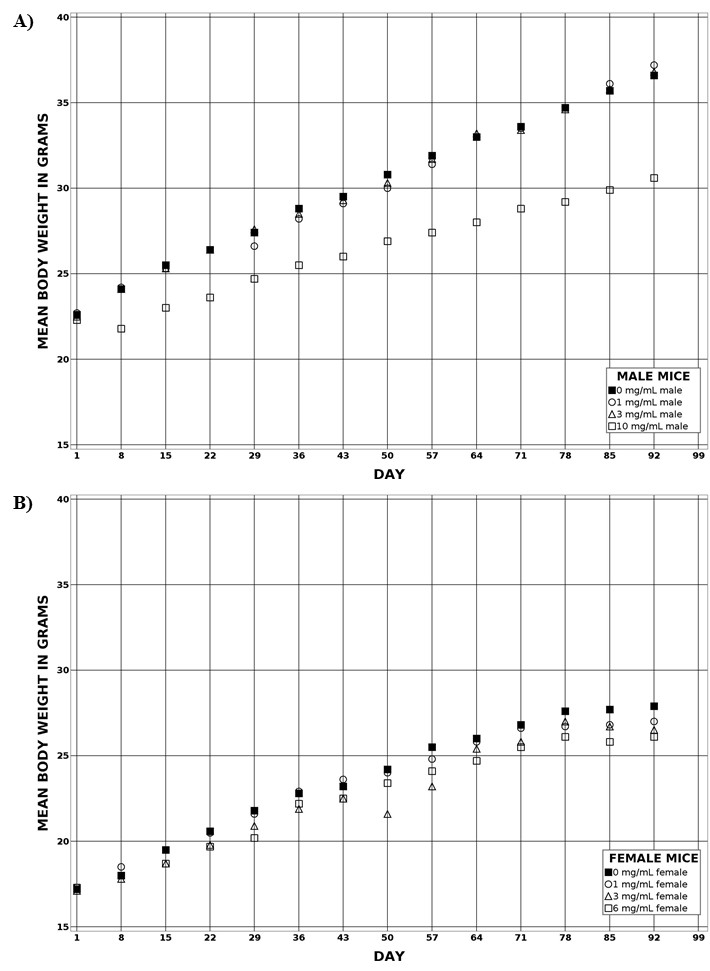
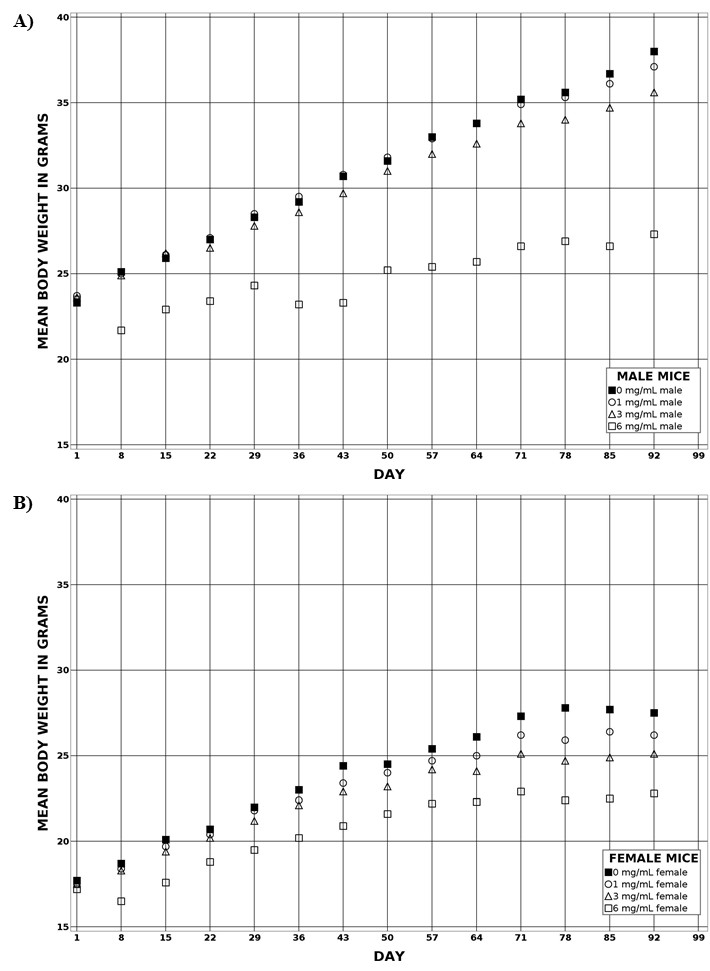
Rats exposed to Emim-Cl and Bmim-Cl for 3 months had similar terminal mean body weights compared to the control group at all exposure concentrations. Rats exposed to Bmpy-Cl and NBuPy-Cl, however, had significantly decreased terminal mean body weights at high exposure concentrations. Mice exposed to all ILs had significantly decreased terminal mean body weights, and male mice typically showed greater body weight differences than female mice at comparable concentrations. Several organ weight changes occurred in male and female mice, but most of these changes were considered secondary effects of decreased body weight and/or water consumption.
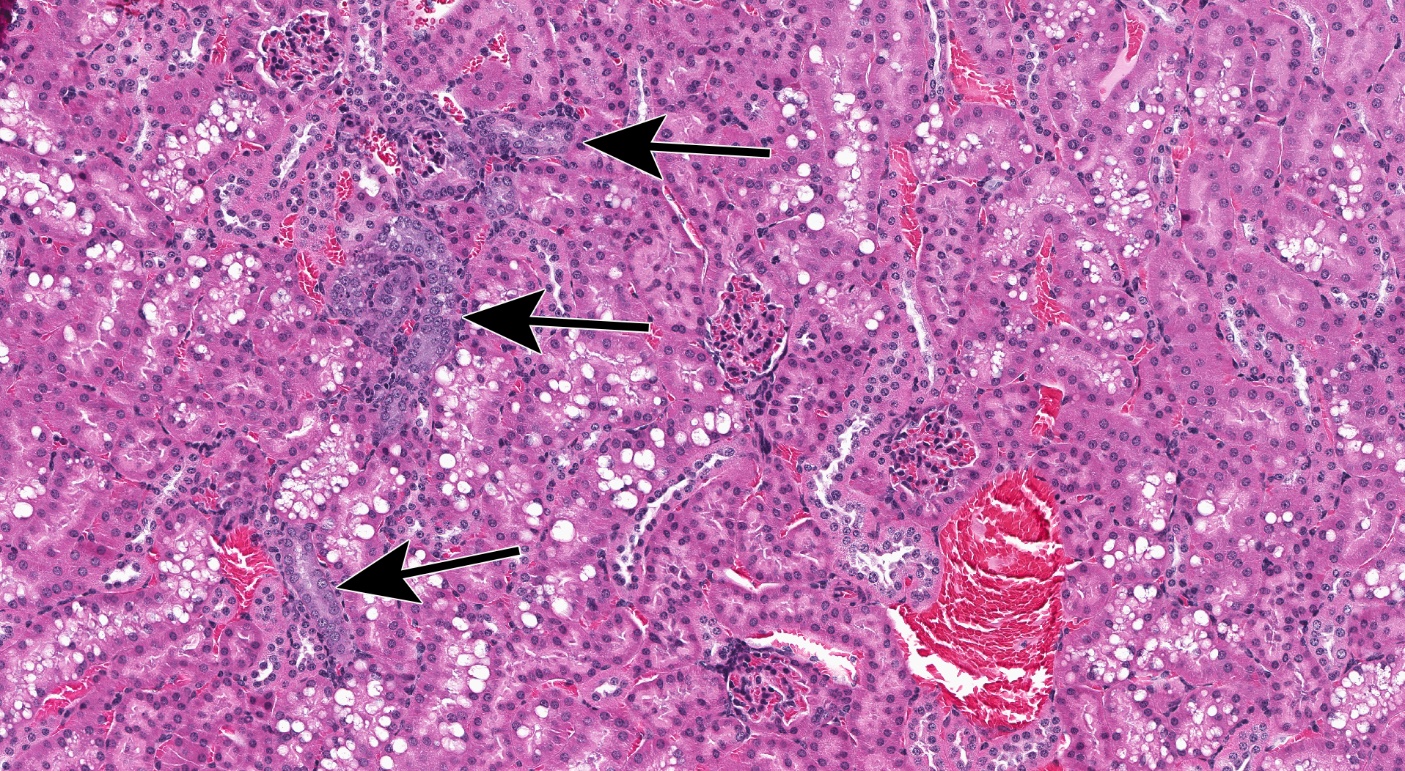
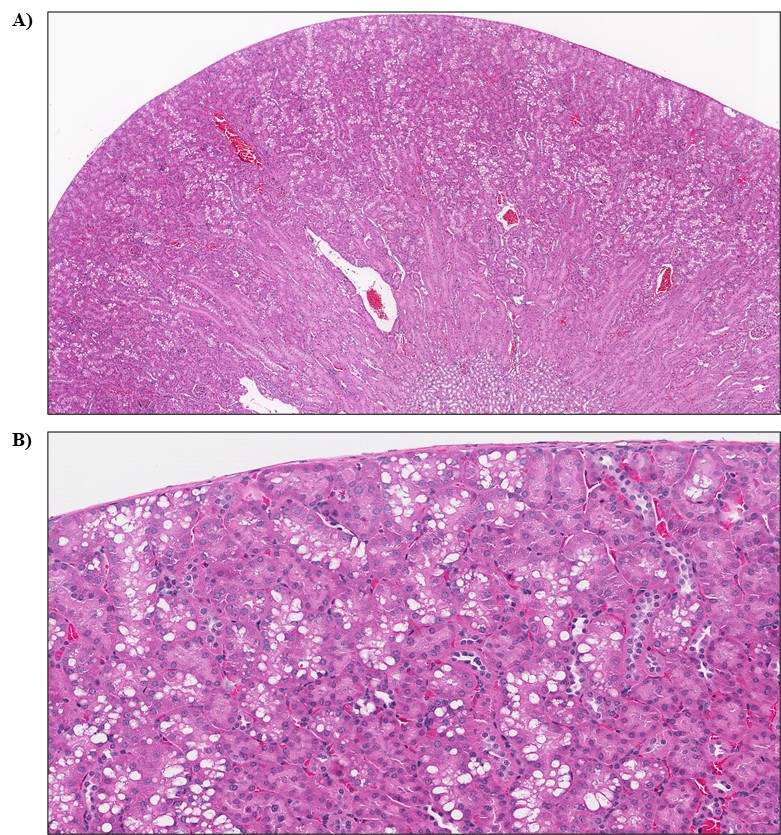
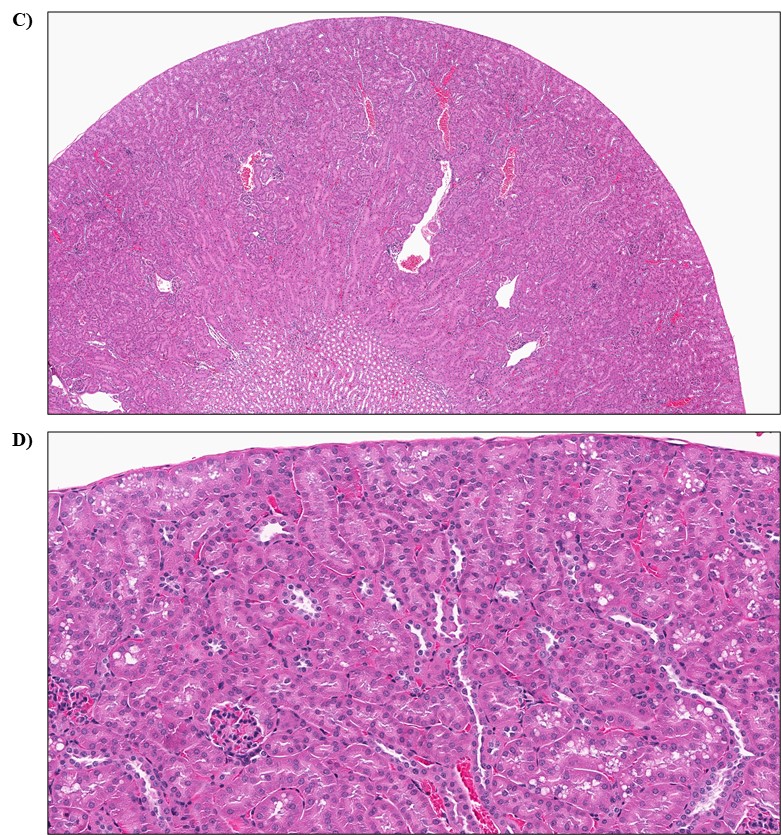
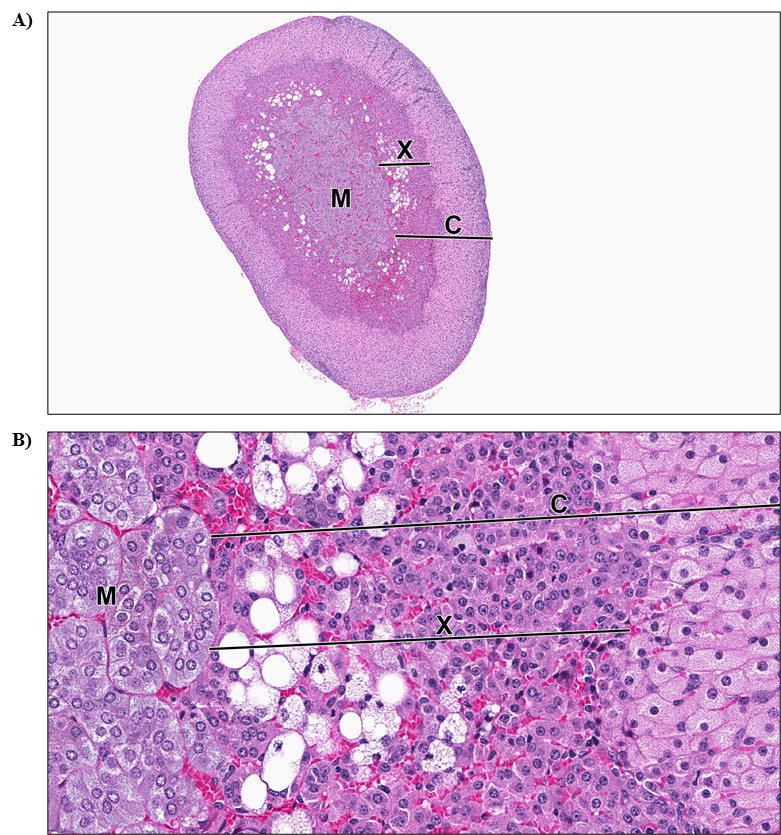
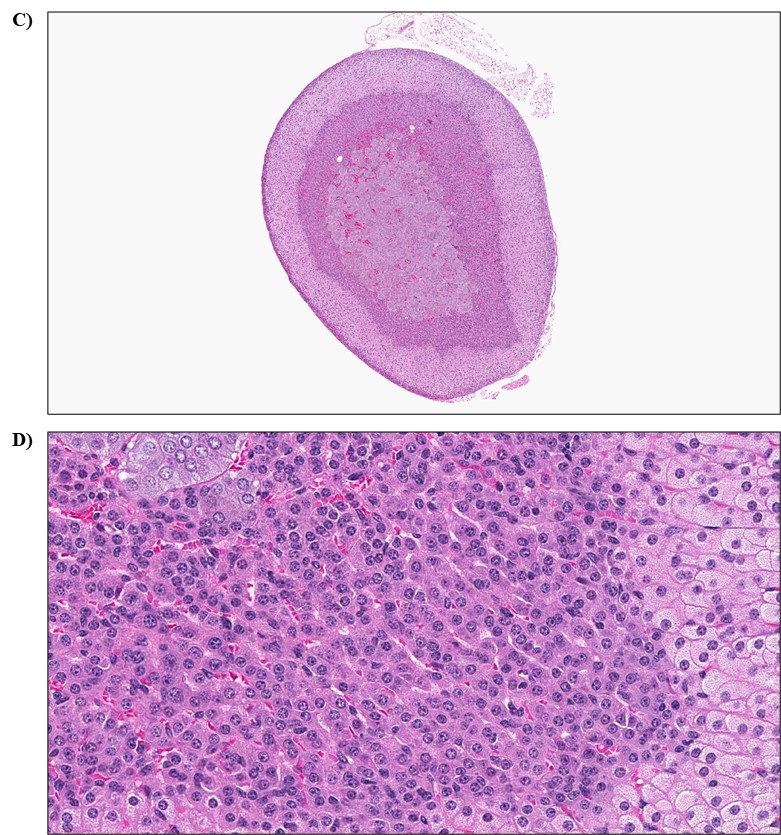
Rats exposed to ILs did not display an increase in histological changes; however, mice exposed to ILs displayed a significant increase in the incidences of nonneoplastic kidney and adrenal gland lesions. Incidences of chronic progressive nephropathy were significantly increased in male mice at the highest exposure concentrations of Emim-Cl and NBuPy-Cl. A positive trend for this lesion was observed in male mice exposed to Emim-Cl, Bmim-Cl, and NBuPy-Cl, as well as in female mice exposed to Bmim-Cl and NBuPy-Cl. Additionally, significantly increased incidences of renal tubule cytoplasmic alteration occurred in male mice exposed to the highest concentrations of Emim-Cl, Bmpy-Cl, or NBuPy-Cl. In female mice, the incidences of a persistent X-zone in the adrenal cortex were significantly increased for all four ILs at the highest exposure concentrations.
Additional data collected from this study suggest IL exposure has minimal effects on hematological or clinical chemistry parameters, does not influence overall survival or the female reproductive cycle, and is generally not genotoxic.
Overall, the results from this comparative study suggest that Emim-Cl, Bmim-Cl, Bmpy-Cl, and NBuPy-Cl in drinking water have minimal effects on rats and mice at low exposure concentrations (<3 mg/mL). Exposure to higher IL concentrations (≥3 mg/mL) results in lower body weights and nonneoplastic lesions in the kidneys of male and female mice and in the adrenal glands of female mice. The lowest-observed-effect levels (LOELs) were determined using these data. The LOELs were assigned as 10 mg/mL for Emim-Cl-exposed male mice, 3 mg/mL for Bmim-Cl-exposed male mice, 10 mg/mL for Bmpy-Cl-exposed male mice, and 6 mg/mL for NBuPy-Cl-exposed male mice. The LOELs for female mice differed slightly. The LOELs were 30 mg/mL for Emim-Cl-exposed female mice, 3 mg/mL for Bmim-Cl-exposed female mice (the same as for Bmim-Cl-exposed male mice), 3 mg/mL for Bmpy-Cl-exposed female mice, and 3 mg/mL for NBuPy-Cl-exposed female mice. These studies indicate that IL-induced toxicity may be attributable to alkyl chain length and cation type. ILs with longer alkyl chains typically exhibit increased toxicity compared to ILs with shorter alkyl chains. In this report, mice exposed to Bmim-Cl (an IL with a 4-carbon alkyl chain) had a lower LOEL than did mice exposed to Emim-Cl (an IL with a 2-carbon alkyl chain). The difference in toxicity among cations (imidiazolium vs. pyrrolidinium vs. pyridinium), however, is less clear and is both sex- and endpoint-dependent.
Synonyms:
1-ethyl-3-methylimidazolium chloride: 1-ethyl-3-methyl-1H-imidazol-3-ium chloride; 1H-imidazolium, 1-ethyl-3-methyl-, chloride (1:1)
1-butyl-3-methylimidazolium chloride: 1-butyl-3-methyl-1H-imidazol-3-ium chloride; 1H-imidazolium, 3-butyl-1-methyl-, chloride (1:1); 1-n-butyl-3-methylimidazolium chloride; 3-butyl-1-methyl-1H-imidazol-3-ium chloride
1-butyl-1-methylpyrrolidinium chloride: 1-butyl-1-methylpyrrolidin-1-ium chloride; n-butyl-N-methylpyrrolidinium chloride; pyrrolidinium, 1-butyl-1-methyl-, chloride (1:1)
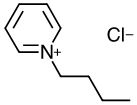
N-butylpyridinium chloride: 1-butylpyridin-1-ium chloride
Summary of Findings Considered Toxicologically Relevant in Male and Female Rats and Mice Exposed to Ionic Liquids in Drinking Water for Three Months
| Male Sprague Dawley Rats | Female Sprague Dawley Rats | Male B6C3F1/N Mice | Female B6C3F1/N Mice | |
|---|---|---|---|---|
| Concentrations in water (mg/mL) | ||||
| Emim-Cl | 0, 1, 3, or 10 | 0, 1, 3, or 10 | 0, 3, 10, or 30 | 0, 3, 10, or 30 |
| Bmim-Cl | 0, 0.1, 0.3, or 1 | 0, 0.1, 0.3, or 1 | 0, 0.3, 1, or 3 | 0, 0.3, 1, or 3 |
| Bmpy-Cl | 0, 0.3, 1, or 3 | 0, 1, 3, or 6 | 0, 1, 3, or 10 | 0, 1, 3, or 6 |
| NBuPy-Cl | 0, 0.3, 1, or 3 | 0, 0.3, 1, or 3 | 0, 1, 3, or 6 | 0, 1, 3, or 6 |
| Survival ratesa | No effectb,c | No effect | No effect | No effect |
| Terminal mean body weightsd | ||||
| Emim-Cl | No effect | No effect | ↓ | ↓ |
| Bmim-Cl | No effect | No effect | ↓ | ↓ |
| Bmpy-Cl | ↓ | ↓ | ↓ | No effect |
| NBuPy-Cl | ↓ | ↓ | ↓ | ↓ |
| Clinical findingsa | No effect | No effect | No effect | No effect |
| Water consumptiond | ↓ | ↓ | ↓ | ↓ |
| Organ weightsd | ||||
| Emim-Cl | No effect | ↑ Relative kidney weight | No effect | No effect |
| Bmim-Cl | ↓ Absolute heart weight | ↓ Absolute lung weight | No effect | No effect |
| Bmpy-Cl | No effect | ↓ Absolute and relative liver weight | ↑ Relative liver weight | ↑ Relative kidney weight |
| NBuPy-Cl | No effect | No effect | ↓ Absolute and ↑ relative kidney weight ↓ Absolute and ↑ relative liver weight | No effect |
| Nonneoplastic findings | ||||
| Emim-Cl | No effect | No effect | Kidney: infarct, (0/10, 0/10, 0/10, 2/10); chronic progressive nephropathy (1/10, 1/10, 2/10, 8/10); renal tubule, cytoplasmic alteration (0/10, 0/10, 0/10, 9/10) | Adrenal gland: adrenal cortex, X-zone, persistent (0/10, 1/10, 0/10, 8/10) |
| Bmim-Cl | No effect | No effect | Kidney: chronic progressive nephropathy (1/10, 3/10, 0/10, 5/10) | Kidney: chronic progressive nephropathy (0/10, 0/10, 1/10, 3/10) Adrenal gland: adrenal cortex, X-zone, persistent (0/10, 1/10, 0/10, 5/10) |
| Bmpy-Cl | No effect | No effect | Kidney: renal tubule, cytoplasmic alteration (0/10, 0/10, 0/10, 5/10) | Adrenal gland: adrenal cortex, X-zone, persistent (0/10, 1/10, 4/10, 4/10) |
| NBuPy-Cl | No effect | No effect | Kidney: chronic progressive nephropathy (2/10, 0/10, 4/10, 8/10); renal tubule, cytoplasmic alteration (0/10, 0/10, 0/10, 10/10) | Kidney: chronic progressive nephropathy (2/10, 0/10, 2/10, 5/10) Adrenal gland: adrenal cortex, X-zone, persistent (0/10, 2/10, 3/10, 9/10) |
| Clinical pathologya | No effect | No effect | No effect | No effect |
| Reproductive findingsa | No effect | No effect | No effect | No effect |
| Genetic toxicology | ||||
| Bacterial mutagenicitya | Negative in Salmonella typhimurium strains TA98 and TA100 and Escherichia coli strain WP2 uvrA (pKM101), with and without S9 | |||
| Micronucleated erythrocytes (in vivo) | ||||
| Rat peripheral blood | Emim-Cl and Bmim-Cl: negative in males and females Bmpy-Cl: positive in males and negative in females NBuPy-Cl: equivocal in males and negative in females | |||
| Mouse peripheral blood | Emim-Cl, Bmim-Cl, Bmpy-Cl, and NBuPy-Cl: negative in males and females | |||
Summary of Findings Considered Toxicologically Relevant in Male and Female Rats and Mice Exposed to Ionic Liquids in Drinking Water for Three Months
| Male Sprague Dawley Rats | Female Sprague Dawley Rats | Male B6C3F1/N Mice | Female B6C3F1/N Mice | |
|---|---|---|---|---|
| Concentrations in water (mg/mL) | ||||
| Emim-Cl | 0, 1, 3, or 10 | 0, 1, 3, or 10 | 0, 3, 10, or 30 | 0, 3, 10, or 30 |
| Bmim-Cl | 0, 0.1, 0.3, or 1 | 0, 0.1, 0.3, or 1 | 0, 0.3, 1, or 3 | 0, 0.3, 1, or 3 |
| Bmpy-Cl | 0, 0.3, 1, or 3 | 0, 1, 3, or 6 | 0, 1, 3, or 10 | 0, 1, 3, or 6 |
| NBuPy-Cl | 0, 0.3, 1, or 3 | 0, 0.3, 1, or 3 | 0, 1, 3, or 6 | 0, 1, 3, or 6 |
| Survival ratesa | No effectb,c | No effect | No effect | No effect |
| Terminal mean body weightsd | ||||
| Emim-Cl | No effect | No effect | ↓ | ↓ |
| Bmim-Cl | No effect | No effect | ↓ | ↓ |
| Bmpy-Cl | ↓ | ↓ | ↓ | No effect |
| NBuPy-Cl | ↓ | ↓ | ↓ | ↓ |
| Clinical findingsa | No effect | No effect | No effect | No effect |
| Water consumptiond | ↓ | ↓ | ↓ | ↓ |
| Organ weightsd | ||||
| Emim-Cl | No effect | ↑ Relative kidney weight | No effect | No effect |
| Bmim-Cl | ↓ Absolute heart weight | ↓ Absolute lung weight | No effect | No effect |
| Bmpy-Cl | No effect | ↓ Absolute and relative liver weight | ↑ Relative liver weight | ↑ Relative kidney weight |
| NBuPy-Cl | No effect | No effect | ↓ Absolute and ↑ relative kidney weight ↓ Absolute and ↑ relative liver weight | No effect |
| Nonneoplastic findings | ||||
| Emim-Cl | No effect | No effect | Kidney: infarct, (0/10, 0/10, 0/10, 2/10); chronic progressive nephropathy (1/10, 1/10, 2/10, 8/10); renal tubule, cytoplasmic alteration (0/10, 0/10, 0/10, 9/10) | Adrenal gland: adrenal cortex, X-zone, persistent (0/10, 1/10, 0/10, 8/10) |
| Bmim-Cl | No effect | No effect | Kidney: chronic progressive nephropathy (1/10, 3/10, 0/10, 5/10) | Kidney: chronic progressive nephropathy (0/10, 0/10, 1/10, 3/10) Adrenal gland: adrenal cortex, X-zone, persistent (0/10, 1/10, 0/10, 5/10) |
| Bmpy-Cl | No effect | No effect | Kidney: renal tubule, cytoplasmic alteration (0/10, 0/10, 0/10, 5/10) | Adrenal gland: adrenal cortex, X-zone, persistent (0/10, 1/10, 4/10, 4/10) |
| NBuPy-Cl | No effect | No effect | Kidney: chronic progressive nephropathy (2/10, 0/10, 4/10, 8/10); renal tubule, cytoplasmic alteration (0/10, 0/10, 0/10, 10/10) | Kidney: chronic progressive nephropathy (2/10, 0/10, 2/10, 5/10) Adrenal gland: adrenal cortex, X-zone, persistent (0/10, 2/10, 3/10, 9/10) |
| Clinical pathologya | No effect | No effect | No effect | No effect |
| Reproductive findingsa | No effect | No effect | No effect | No effect |
| Genetic toxicology | ||||
| Bacterial mutagenicitya | Negative in Salmonella typhimurium strains TA98 and TA100 and Escherichia coli strain WP2 uvrA (pKM101), with and without S9 | |||
| Micronucleated erythrocytes (in vivo) | ||||
| Rat peripheral blood | Emim-Cl and Bmim-Cl: negative in males and females Bmpy-Cl: positive in males and negative in females NBuPy-Cl: equivocal in males and negative in females | |||
| Mouse peripheral blood | Emim-Cl, Bmim-Cl, Bmpy-Cl, and NBuPy-Cl: negative in males and females | |||
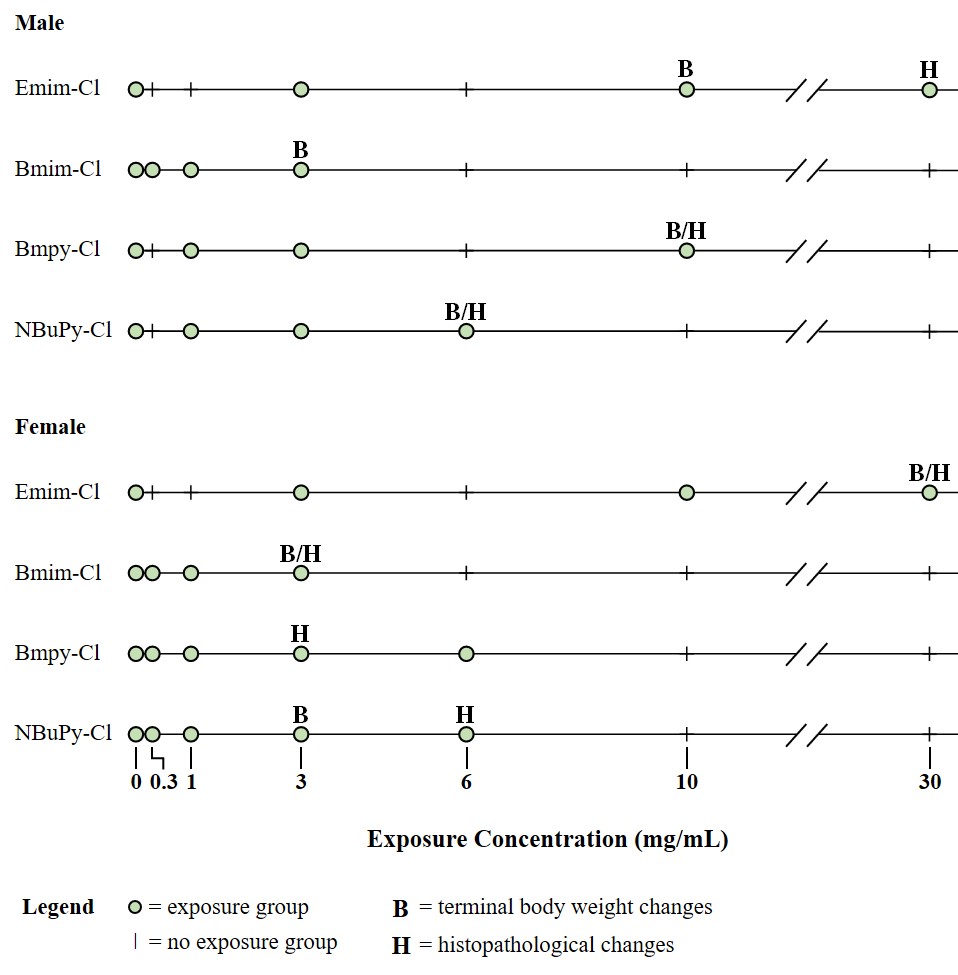
Emim-Cl = 1-ethyl-3-methylimidazolium chloride; Bmim-Cl = 1-butyl-3-methylimidazolium chloride; Bmpy-Cl = 1-butyl-1-methylpyrrolidinium chloride; NBuPy-Cl = n-butylpyridinium chloride.
Emim-Cl = 1-ethyl-3-methylimidazolium chloride; Bmim-Cl = 1-butyl-3-methylimidazolium chloride; Bmpy-Cl = 1-butyl-1-methylpyrrolidinium chloride; NBuPy-Cl = n-butylpyridinium chloride.
Introduction
Chemical and Physical Properties
Structurally, ionic liquids (ILs) consist of a cation with an alkyl side chain and an anion. ILs’ chemical and physical properties are widely documented in published manuscripts, review articles, and book chapters. Most ILs are liquid at room temperature (although some are solid) and have low vapor pressure.1,6-8 Other properties can be diverse, but most have low volatility and flammability, a melting point below 100°C, high thermal stability, and the ability to act as solvents for a range of polar and nonpolar compounds. Their solubility and other physical-chemical properties allow for formation of application-specific ILs; therefore, this chemical class is often referred to as “designer solvents.”1,7,9-11 Some “designer” ILs improve industrial processes by reducing wastes and increasing the efficiency of product extraction.12
1. Baker GA, Baker SN, Pandey S, Bright FV. An analytical view of ionic liquids. Analyst. 2005; 130(6):800-808. DOI: 10.1039/b500865b PubMed: 15912225
6. Endres F, Zein El Abedin S. Air and water stable ionic liquids in physical chemistry. Phys Chem Chem Phys. 2006; 8(18):2101-2116. DOI: 10.1039/b600519p PubMed: 16751868
8. Cvjetko Bubalo M, Radošević K, Redovniković IR, Halambek J, Srček VG. A brief overview of the potential environmental hazards of ionic liquids. Ecotoxicol Environ Saf. 2014; 99:1-12. DOI: 10.1016/j.ecoenv.2013.10.019 PubMed: 24210364
1. Baker GA, Baker SN, Pandey S, Bright FV. An analytical view of ionic liquids. Analyst. 2005; 130(6):800-808. DOI: 10.1039/b500865b PubMed: 15912225
7. Castner EW Jr, Margulis CJ, Maroncelli M, Wishart JF. Ionic liquids: Structure and photochemical reactions. Annu Rev Phys Chem. 2011; 62:85-105. DOI: 10.1146/annurev-physchem-032210-103421 PubMed: 21091193
9. Freemantle M. Designer solvents-ionic liquids may boost clean technology development. Chem Eng News. 1998; 76(13):32-37. DOI: 10.1021/cen-v076n013.p032
11. Plechkova NV, Seddon KR. Applications of ionic liquids in the chemical industry. Chem Soc Rev. 2008; 37(1):123-150. DOI: 10.1039/B006677J PubMed: 18197338
12. Holbrey JD, Seddon KR. Ionic liquids. Clean Products and Processes. 1999; 1(4):223-236. DOI: 10.1007/s100980050036
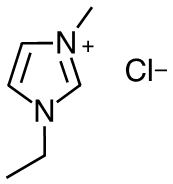
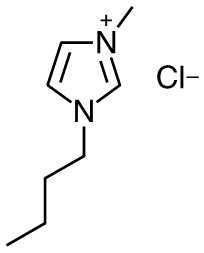
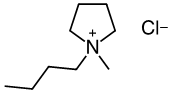
The ILs assessed in this report are chlorides of 1-ethyl-3-methylimidazolium (Emim-Cl), 1-butyl-3-methylimidazolium (Bmim-Cl), 1-butyl-1-methylpyrrolidinium (Bmpy-Cl), and n-butylpyridinium (NBuPy-Cl) cations. All are solid at room temperature with relatively low melting points (predicted averages from 56.7ºC to 107ºC) and a pH ranging from 7 to 8.13-16 Table 1 provides basic information for the ILs evaluated in the present studies.
13. U.S. Environmental Protection Agency (USEPA). CompTox Chemicals Dashboard: 1-Ethyl-3-methylimidazolium chloride 65039-09-0 | DTXSID1041180. https://comptox.epa.gov/dashboard/dsstoxdb/results?search=DTXSID1041180#properties
16. U.S. Environmental Protection Agency (USEPA). CompTox Chemicals Dashboard: N-Butylpyridinium chloride 1124-64-7 | DTXSID1031462. https://comptox.epa.gov/dashboard/dsstoxdb/results?search=1124-64-7#properties
Production, Use, and Human Exposure
The history of IL use and production is well documented.5,11,19-21 A market analysis published in 2016 noted, “the global ionic liquids market was valued at USD 20.36 million in 2015,” and “North America contributed to over 30% of the total global ionic liquids market.”22 IL production volumes in the United States are not readily available, but several U.S.-based companies (e.g., Ionic Liquid Chemicals LLC; NanoTechLabs, Inc.; Strem Chemicals, Inc.; and TCI America) are currently producing and/or selling these compounds in bulk or smaller quantities. In 2020 PubChem vendor lists, Emim-Cl, Bmim-Cl, Bmpy-Cl, and NBuPy-Cl were available from many suppliers.23-26
5. Heckenbach ME, Romero FN, Green MD, Halden RU. Meta-analysis of ionic liquid literature and toxicology. Chemosphere. 2016; 150:266-274. DOI: 10.1016/j.chemosphere.2016.02.029 PubMed: 26907595
11. Plechkova NV, Seddon KR. Applications of ionic liquids in the chemical industry. Chem Soc Rev. 2008; 37(1):123-150. DOI: 10.1039/B006677J PubMed: 18197338
19. Wilkes JS. A short history of ionic liquids—from molten salts to neoteric solvents. Green Chem. 2002; 4(2):73-80. DOI: 10.1039/b110838g
21. Welton T. Ionic liquids: A brief history. Biophys Rev. 2018; 10(3):691-706. DOI: 10.1007/s12551-018-0419-2 PubMed: 29700779
22. Grand View Research. Ionic liquids market size, share & trends analysis report by application (solvents & catalysts, extractions & separations, bio-refineries, energy storage), by region, and segment forecasts, 2018 - 2025. 2016. https://www.grandviewresearch.com/industry-analysis/ionic-liquids-market
23. National Center for Biotechnology Information (NCBI). PubChem Compound Summary for CID 2734160, 1-Ethyl-3-methylimidazolium chloride: 6. Chemical Vendors. Bethesda, MD: National Library of Medicine; 2020. [12/14/2020]. https://pubchem.ncbi.nlm.nih.gov/compound/2734160#section=Chemical-Vendors
26. National Center for Biotechnology Information (NCBI). PubChem Compound Summary for CID 2734171, n-Butylpyridinium chloride: 6. Chemical Vendors. Bethesda, MD: National Library of Medicine; 2020. [12/14/2020]. https://pubchem.ncbi.nlm.nih.gov/compound/2734171#section=Chemical-Vendors
ILs are synthetic solvents with applications in the chemical, pharmaceutical, and energy industries. Certain physiochemical properties make these compounds favorable for use in catalysis, synthesis, separation, and polymerization processes.8 ILs may also be effective in medical applications such as drug delivery systems27,28 or antimicrobial agents.3,29 Some identified uses of Emim-Cl, Bmpy-Cl, and NBuPy-Cl include catalysis and synthesis reactions, battery electrolysis, and other electrochemical uses. Bmim-Cl uses include biomass conversion stabilization30 and biocatalysis processes,31,32 as well as extraction methods for biomolecules33,34 due to its nondenaturing properties.
8. Cvjetko Bubalo M, Radošević K, Redovniković IR, Halambek J, Srček VG. A brief overview of the potential environmental hazards of ionic liquids. Ecotoxicol Environ Saf. 2014; 99:1-12. DOI: 10.1016/j.ecoenv.2013.10.019 PubMed: 24210364
27. Goindi S, Arora P, Kumar N, Puri A. Development of novel ionic liquid-based microemulsion formulation for dermal delivery of 5-Fluorouracil. AAPS PharmSciTech. 2014; 15(4):810-821. DOI: 10.1208/s12249-014-0103-1 PubMed: 24668136
28. Wang C, Zhu J, Zhang D, Yang Y, Zheng L, Qu Y, Yang X, Cui X. Ionic liquid - microemulsions assisting in the transdermal delivery of Dencichine: Preparation, in-vitro and in-vivo evaluations, and investigation of the permeation mechanism. Int J Pharm. 2018; 535(1-2):120-131. DOI: 10.1016/j.ijpharm.2017.10.024 PubMed: 29104058
3. Miskiewicz A, Ceranowicz P, Szymczak M, Bartuś K, Kowalczyk P. The use of liquids ionic fluids as pharmaceutically active substances helpful in combating nosocomial infections induced by Klebsiella Pneumoniae New Delhi strain, Acinetobacter Baumannii and Enterococcus species. Int J Mol Sci. 2018; 19(9). DOI: 10.3390/ijms19092779 PubMed: 30223584
29. Dobler D, Schmidts T, Zinecker C, Schlupp P, Schäfer J, Runkel F. Hydrophilic ionic liquids as ingredients of gel-based dermal formulations. AAPS PharmSciTech. 2016; 17(4):923-931. DOI: 10.1208/s12249-015-0421-y PubMed: 27435197
30. Wang P, Yu H, Zhan S, Wang S. Catalytic hydrolysis of lignocellulosic biomass into 5-hydroxymethylfurfural in ionic liquid. Bioresour Technol. 2011; 102(5):4179-4183. DOI: 10.1016/j.biortech.2010.12.073 PubMed: 21232942
31. Nordwald EM, Kaar JL. Mediating electrostatic binding of 1-butyl-3-methylimidazolium chloride to enzyme surfaces improves conformational stability. J Phys Chem B. 2013; 117(30):8977-8986. DOI: 10.1021/jp404760w PubMed: 23822219
32. Tavares APM, Pinho B, Rodriguez O, Macedo EA. Biocatalysis in ionic liquid: Degradation of phenol by laccase. Procedia Eng. 2012; 42:226-230. DOI: 10.1016/j.proeng.2012.07.413
33. Ventura SP, Neves CM, Freire MG, Marrucho IM, Oliveira J, Coutinho JA. Evaluation of anion influence on the formation and extraction capacity of ionic-liquid-based aqueous biphasic systems. J Phys Chem B. 2009; 113(27):9304-9310. DOI: 10.1021/jp903286d PubMed: 19518115
34. Du Z, Yu YL, Wang JH. Extraction of proteins from biological fluids by use of an ionic liquid/aqueous two-phase system. Chemistry. 2007; 13(7):2130-2137. DOI: 10.1002/chem.200601234 PubMed: 17136782
Human exposure to ILs, including the four assessed in this report, is expected to occur primarily through the dermal and oral routes.35 Occupational handling of ILs for a variety of applications can result in dermal exposure.36-38 Handling (e.g., drumming and bagging) the powdered materials also can result in ocular and inhalation exposures. For the general population, direct exposure could result from use and disposal of consumer products, and indirect exposure could occur via drinking water (i.e., where source waters are affected by industrial discharges). Consumer products such as batteries, electrochromic devices, fuel cells, plastics, and surgical implants may contain ILs.4,7,10,39 Some ILs, including Bmim-Cl, have been used in cosmetics, fragrances, hair care products, and household cleaning products.35,39,40 Insufficient data exist to define the potential for human exposure and environmental contamination from these compounds. Bubalo and colleagues have proposed, however, that more hydrophobic ILs could become persistent contaminants in the environment, while less adsorbent, more mobile ILs could be transported to surface and groundwater, possibly contaminating aquatic ecosystems or drinking water supplies.8 Oral exposures through drinking water are anticipated because many ILs are soluble in water and challenging to remove from wastewater.41,42
35. National Toxicology Program (NTP). Ionic liquids: 1-Butyl-3-methylimidazolium chloride (CAS No. 79917-90-1), 1-butyl-1-methylpyrrolidinium chloride (CAS No. 479500-35-1), n-butylpyridinium chloride (CAS No. 1124-64-7). Review of toxicological literature. Research Triangle Park, NC: Prepared by: Integrated Laboratory Systems, Inc.; 2004. https://ntp.niehs.nih.gov/ntp/htdocs/chem_background/exsumpdf/ionic_liquids_508.pdf
36. Wang C, Wang Y, Lu Y, He H, Huo F, Dong K, Wei N, Zhang S. Height-driven structure and thermodynamic properties of confined ionic liquids inside carbon nanochannels from molecular dynamics study. Phys Chem Chem Phys. 2019; 21(24):12767-12776. DOI: 10.1039/C9CP00732F PubMed: 31020276
38. Hwang JH, Park H, Choi DW, Nam KT, Lim KM. Investigation of dermal toxicity of ionic liquids in monolayer-cultured skin cells and 3D reconstructed human skin models. Toxicol In Vitro. 2018; 46:194-202. DOI: 10.1016/j.tiv.2017.09.025 PubMed: 28958837
4. Pham TP, Cho C-W, Yun Y-S. Environmental fate and toxicity of ionic liquids: A review. Water Res. 2010; 44(2):352-372. DOI: 10.1016/j.watres.2009.09.030 PubMed: 19854462
7. Castner EW Jr, Margulis CJ, Maroncelli M, Wishart JF. Ionic liquids: Structure and photochemical reactions. Annu Rev Phys Chem. 2011; 62:85-105. DOI: 10.1146/annurev-physchem-032210-103421 PubMed: 21091193
10. Freemantle M. Eyes on ionic liquids. Chem Eng News. 2000; 78(20):37-50. DOI: 10.1021/cen-v078n020.p037
39. Kohli R. Applications of ionic liquids in removal of surface contaminants. In: Kohli R, Mittal KL, editors. Developments in Surface Contamination and Cleaning: Applications of Cleaning Techniques. Elsevier; 2019. p. 619-680. DOI: 10.1016/B978-0-12-815577-6.00016-5
35. National Toxicology Program (NTP). Ionic liquids: 1-Butyl-3-methylimidazolium chloride (CAS No. 79917-90-1), 1-butyl-1-methylpyrrolidinium chloride (CAS No. 479500-35-1), n-butylpyridinium chloride (CAS No. 1124-64-7). Review of toxicological literature. Research Triangle Park, NC: Prepared by: Integrated Laboratory Systems, Inc.; 2004. https://ntp.niehs.nih.gov/ntp/htdocs/chem_background/exsumpdf/ionic_liquids_508.pdf
39. Kohli R. Applications of ionic liquids in removal of surface contaminants. In: Kohli R, Mittal KL, editors. Developments in Surface Contamination and Cleaning: Applications of Cleaning Techniques. Elsevier; 2019. p. 619-680. DOI: 10.1016/B978-0-12-815577-6.00016-5
40. Berton P, Bica K, Rogers RD. Ionic liquids for consumer products: Dissolution, characterization, and controlled release of fragrance compositions. Fluid Phase Equilib. 2017; 450:51-56. DOI: 10.1016/j.fluid.2017.07.011
8. Cvjetko Bubalo M, Radošević K, Redovniković IR, Halambek J, Srček VG. A brief overview of the potential environmental hazards of ionic liquids. Ecotoxicol Environ Saf. 2014; 99:1-12. DOI: 10.1016/j.ecoenv.2013.10.019 PubMed: 24210364
41. Anthony JL, Maginn EJ, Brennecke JF. Solution thermodynamics of imidazolium-based ionic liquids and water. J Phys Chem B. 2001; 105(44):10942-10949. DOI: 10.1021/jp0112368
42. McFarlane J, Ridenour WB, Luo H, Hunt RD, DePaoli DW, Ren RX. Room temperature ionic liquids for separating organics from produced water. Sep Sci Technol. 2005; 40(6):1245-1265. DOI: 10.1081/SS-200052807
Regulatory Status
No federal or state regulations have been established to protect human health or the environment from Emim-Cl, Bmim-Cl, Bmpy-Cl, NBuPy-Cl, or any other IL.
Absorption, Distribution, Metabolism, and Excretion
Experimental Animals
The National Toxicology Program (NTP) investigated the absorption, distribution, metabolism, and excretion (ADME) and toxicokinetic properties of Bmim-Cl and NBuPy-Cl in male Fischer 344 (F344) rats and female B6C3F1 mice43,44 and of Bmpy-Cl in male F344 rats45 following single or repeated gavage, intravenous administration, or dermal application. The doses selected in these three studies were 0.5, 5, or 50 mg/kg, representing approximately 0.1%, 1%, or 10%, respectively, of the reported oral median lethal dose (LD50) of 550 mg/kg in female F344 rats.46 In general, the disposition pattern of the three ILs were similar, with moderate to high oral absorption, low to moderate dermal absorption, rapid excretion, and low tissue retention. The ILs were poorly metabolized, despite the expectation that ILs with a butyl substitution (e.g., Bmim-Cl) would undergo side chain oxidation.47 No other studies investigating the ADME of ILs were found in the literature.
43. Cheng Y, Wright SH, Hooth MJ, Sipes IG. Characterization of the disposition and toxicokinetics of N-butylpyridinium chloride in male F-344 rats and female B6C3F1 mice and its transport by organic cation transporter 2. Drug Metab Dispos. 2009; 37(4):909-916. DOI: 10.1124/dmd.108.022681 PubMed: 19171679
44. Sipes IG, Knudsen GA, Kuester RK. The effects of dose and route on the toxicokinetics and disposition of 1-butyl-3-methylimidazolium chloride in male F-344 rats and female B6C3F1 mice. Drug Metab Dispos. 2008; 36(2):284-293. DOI: 10.1124/dmd.107.018515 PubMed: 17967929
45. Knudsen GA, Cheng Y, Kuester RK, Hooth MJ, Sipes IG. Effects of dose and route on the disposition and kinetics of 1-butyl-1-methylpyrrolidinium chloride in male F-344 rats. Drug Metab Dispos. 2009; 37(11):2171-2177. DOI: 10.1124/dmd.109.029082 PubMed: 19704025
46. Landry TD, Brooks K, Poche D, Woolhiser M. Acute toxicity profile of 1-butyl-3-methylimidazolium chloride. Bull Environ Contam Toxicol. 2005; 74(3):559-565. DOI: 10.1007/s00128-005-0620-4 PubMed: 15903191
47. Jastorff B, Störmann R, Ranke J, Mölter K, Stock F, Oberheitmann B, Hoffmann W, Hoffmann J, Nüchter M, Ondruschka B, et al. How hazardous are ionic liquids? Structure–activity relationships and biological testing as important elements for sustainability evaluation. Green Chem. 2003; 5(2):136-142. DOI: 10.1039/b211971d
Cheng et al.43 administered [14C]NBuPy-Cl by gavage, intravenous, and dermal application. Following a single gavage dose of 50 mg/kg in male F344 rats, [14C]NBuPy-Cl was rapidly absorbed with a maximum blood concentration occurring at 1.3 hours. For all three doses administered (0.5, 5, or 50 mg/kg), excretion was rapid, with 55%–66% and 20%–25% of the dose recovered in urine and feces, respectively, after 24 hours. Urine profiles showed a single peak corresponding to the parent chemical, suggesting poor metabolism. The elimination half-life of [14C]NBuPy-Cl in blood was 2.2 hours after a single intravenous dose of 5 mg/kg, and the estimated oral bioavailability was 47% following administration of a single oral dose of 50 mg/kg [14C]NBuPy-Cl in male rats. After 72 hours, the dose recovered in tissues of male rats orally administered 50 mg/kg was low (approximately 0.01%, based on selected organs). There was no dose-related difference in the disposition of [14C]NBuPy-Cl in male rats following a single dose versus daily gavage administration for 5 days.43 Following a single gavage dose of 50 mg/kg [14C]NBuPy-Cl in female B6C3F1 mice, the excretion pattern was similar to male rats (72% in urine and 10% in feces after 96 hours). Dermal absorption (estimated based on excreta and dose-site skin) of 5 mg/kg [14C]NBuPy-Cl 96 hours after application to a covered dose site was higher (35% of dose) when formulated in dimethylformamide (DMF)/water (55:45, v/v). The same dermal dose applied in other vehicles (ethanol/water [55:45 v/v] or water alone) was less well absorbed (16% or 10% of the dose, respectively). The pattern of excretion following dermal application was similar to that following oral administration.
43. Cheng Y, Wright SH, Hooth MJ, Sipes IG. Characterization of the disposition and toxicokinetics of N-butylpyridinium chloride in male F-344 rats and female B6C3F1 mice and its transport by organic cation transporter 2. Drug Metab Dispos. 2009; 37(4):909-916. DOI: 10.1124/dmd.108.022681 PubMed: 19171679
43. Cheng Y, Wright SH, Hooth MJ, Sipes IG. Characterization of the disposition and toxicokinetics of N-butylpyridinium chloride in male F-344 rats and female B6C3F1 mice and its transport by organic cation transporter 2. Drug Metab Dispos. 2009; 37(4):909-916. DOI: 10.1124/dmd.108.022681 PubMed: 19171679
Sipes et al.44 examined oral and dermal ADME of Bmim-Cl in male F344 rats and female B6C3F1 mice. In male rats following a single gavage administration of 0.5, 5, or 50 mg/kg [14C]Bmim-Cl, absorption was rapid with the maximum blood concentration occurring at 67 minutes. Of the administered dose, 72%–78% was excreted in urine and 19%–28% in feces by 72 hours, with the majority eliminated in urine by 24 hours (55%–74%). The blood elimination half-life of [14C]Bmim-Cl was 77.2 minutes (approximately 1.3 hours), and the estimated oral bioavailability was 62.1% (for 50 mg/kg). After 72 hours, retention of radioactivity in tissue was negligible. The chemical analysis of urine showed only a single peak corresponding to the parent compound, although fecal profiles showed several peaks that did not coelute with the parent. No dose-related difference was found in the disposition of [14C]Bmim-Cl following a single dose. The disposition of [14C]Bmim-Cl between single and multiple (5 daily doses) gavage dosing was similar. The excretion pattern following a single oral administration of 50 mg/kg [14C]Bmim-Cl in female mice was similar to male rats, with 65% and 18% of the administered dose recovered in urine and feces, respectively, by 72 hours. Dermal absorption of 5 mg/kg [14C]Bmim-Cl 48 hours after a single application to a covered dose site was low to moderate, with 31.7%, 17.8%, or 29.6% (estimated based on excreta and dose-site skin) of the dose absorbed when formulated in DMF/water (1.8:1, v/v), ethanol/water (1.8:1, v/v), and water, respectively.
44. Sipes IG, Knudsen GA, Kuester RK. The effects of dose and route on the toxicokinetics and disposition of 1-butyl-3-methylimidazolium chloride in male F-344 rats and female B6C3F1 mice. Drug Metab Dispos. 2008; 36(2):284-293. DOI: 10.1124/dmd.107.018515 PubMed: 17967929
Knudsen et al.45 examined oral and dermal ADME of Bmpy-Cl in F344 rats. Following a single gavage dose of 0.5, 5, or 50 mg/kg [14C]Bmpy-Cl in male rats, 29%–38% of the administered dose was eliminated in the urine and 51%–69% was excreted in feces by 72 hours. Maximum blood concentration of [14C]Bmpy-Cl occurred at 1.5 hours, with an elimination half-life of 5.6 hours and an estimated oral bioavailability of 43.4% following oral administration of a single 50 mg/kg dose. The urine profiles showed only a single peak corresponding to the parent chemical, suggesting poor metabolism. The pattern of excretion following repeated gavage with 50 mg/kg/day for 5 consecutive days was similar to that following a single gavage administration. Following a single intravenous administration, 86% of the dose was recovered in urine after 72 hours with approximately 8% in feces. The difference between fecal elimination following intravenous versus oral administration (8% vs. 51%–69%) suggests most of the dose excreted in feces was unabsorbed. Dermal absorption of 5 mg/kg [14C]Bmpy-Cl 96 hours after application to a covered dose site was low to moderate, with higher absorption observed when formulated in DMF/water (63:37, v/v) (34% of dose) compared to when formulated in ethanol/water (63:37, v/v) or water (≤22% of dose). The pattern of excretion following dermal application was similar to that following oral administration.
45. Knudsen GA, Cheng Y, Kuester RK, Hooth MJ, Sipes IG. Effects of dose and route on the disposition and kinetics of 1-butyl-1-methylpyrrolidinium chloride in male F-344 rats. Drug Metab Dispos. 2009; 37(11):2171-2177. DOI: 10.1124/dmd.109.029082 PubMed: 19704025
In vitro studies with these ILs highlight their function as substrates for transport-mediated secretion via human organic cation transporter 2 (hOCT2), rat OCT 1 and 2 (rOCT1/2), as well as multidrug and toxic extrusion transporters (MATEs).43,45,48 These data are consistent with properties of other small molecular weight cation compounds including 1-paraquat, methyl-4-phenylpyridinium, tetraethylammonium, and tributylmethylammonium, which are also substrates for OCTs.49-52 In addition, NBuPy-Cl, Bmpy-Cl, and Bmim-Cl were determined to be potent inhibitors of rOCT1/2 and hOCT2, much like other structurally similar compounds that potently inhibit hOCT2.53 While many ILs behave in a similar manner, structure-activity relationship (SAR) studies suggest that slight differences in IL structure can influence their ADME, kinetics, and drug-chemical interactions. For example, Cheng and colleagues determined the OCT inhibitory effects of pyridinium-based ILs are influenced by the length of the alkyl side chain; an increase in the number of carbons on the alkyl chain significantly decreased median inhibitory concentration (IC50).48 This SAR has been observed for other chemical classes53,54; therefore, additional research is needed to understand the relationship between IL structure and physiochemical and biological properties.
43. Cheng Y, Wright SH, Hooth MJ, Sipes IG. Characterization of the disposition and toxicokinetics of N-butylpyridinium chloride in male F-344 rats and female B6C3F1 mice and its transport by organic cation transporter 2. Drug Metab Dispos. 2009; 37(4):909-916. DOI: 10.1124/dmd.108.022681 PubMed: 19171679
45. Knudsen GA, Cheng Y, Kuester RK, Hooth MJ, Sipes IG. Effects of dose and route on the disposition and kinetics of 1-butyl-1-methylpyrrolidinium chloride in male F-344 rats. Drug Metab Dispos. 2009; 37(11):2171-2177. DOI: 10.1124/dmd.109.029082 PubMed: 19704025
48. Cheng Y, Martinez-Guerrero LJ, Wright SH, Kuester RK, Hooth MJ, Sipes IG. Characterization of the inhibitory effects of N-butylpyridinium chloride and structurally related ionic liquids on organic cation transporters 1/2 and human toxic extrusion transporters 1/2-k in vitro and in vivo. Drug Metab Dispos. 2011; 39(9):1755-1761. DOI: 10.1124/dmd.110.035865 PubMed: 21646436
49. Chen Y, Zhang S, Sorani M, Giacomini KM. Transport of paraquat by human organic cation transporters and multidrug and toxic compound extrusion family. J Pharmacol Exp Ther. 2007; 322(2):695-700. DOI: 10.1124/jpet.107.123554 PubMed: 17495125
52. Kim MK, Han L, Choi MK, Han Y-H, Kim D-D, Chung S-J, Shim C-K. Dose dependency in the oral bioavailability of an organic cation model, tributylmethyl ammonium (TBuMA), in rats: Association with the saturation of efflux by the P-gp system on the apical membrane of the intestinal epithelium. J Pharm Sci. 2005; 94(12):2644-2655. DOI: 10.1002/jps.20456 PubMed: 16258993
53. Suhre WM, Ekins S, Chang C, Swaan PW, Wright SH. Molecular determinants of substrate/inhibitor binding to the human and rabbit renal organic cation transporters hOCT2 and rbOCT2. Mol Pharmacol. 2005; 67(4):1067-1077. DOI: 10.1124/mol.104.004713 PubMed: 15630081
48. Cheng Y, Martinez-Guerrero LJ, Wright SH, Kuester RK, Hooth MJ, Sipes IG. Characterization of the inhibitory effects of N-butylpyridinium chloride and structurally related ionic liquids on organic cation transporters 1/2 and human toxic extrusion transporters 1/2-k in vitro and in vivo. Drug Metab Dispos. 2011; 39(9):1755-1761. DOI: 10.1124/dmd.110.035865 PubMed: 21646436
53. Suhre WM, Ekins S, Chang C, Swaan PW, Wright SH. Molecular determinants of substrate/inhibitor binding to the human and rabbit renal organic cation transporters hOCT2 and rbOCT2. Mol Pharmacol. 2005; 67(4):1067-1077. DOI: 10.1124/mol.104.004713 PubMed: 15630081
54. Choi MK, Jin QR, Jin HE, Shim CK, Cho DY, Shin JG, Song IS. Effects of tetraalkylammonium compounds with different affinities for organic cation transporters on the pharmacokinetics of metformin. Biopharm Drug Dispos. 2007; 28(9):501-510. DOI: 10.1002/bdd.576 PubMed: 17876861
Humans
The literature contains no studies on the ADME of ILs in humans.
Toxicity
In Vitro
The structure of an IL is likely to influence its toxicity; the most significant factors are the associated anion and the alkyl chain length.8,55,56 In cases in which the anion and alkyl chain length are the same, aromatic cations (e.g., pyridinium or imidazolium) tend to be more toxic than nonaromatic cations (e.g., pyrrolidinium) in inhibition respiration assays57 and plant cytotoxicity models,4,58 possibly due to greater hydrophobicity of the cation.57 When only alkyl chain length differs among ILs, longer carbon chains are associated with increased lipophilicity of the IL, disruption of cellular membranes, and induction of cell death.8,59,60
8. Cvjetko Bubalo M, Radošević K, Redovniković IR, Halambek J, Srček VG. A brief overview of the potential environmental hazards of ionic liquids. Ecotoxicol Environ Saf. 2014; 99:1-12. DOI: 10.1016/j.ecoenv.2013.10.019 PubMed: 24210364
55. Liu T, Guo Y, Wang J, Wang J, Zhu L, Zhang J, Zhang C. Assessing toxic effects of [Omim]Cl and [Omim]BF4 in zebrafish adults using a biomarker approach. Environ Sci Pollut Res Int. 2016; 23(8):7360-7368. DOI: 10.1007/s11356-015-5887-3 PubMed: 26686854
56. Fatemi MH, Izadiyan P. Cytotoxicity estimation of ionic liquids based on their effective structural features. Chemosphere. 2011; 84(5):553-563. DOI: 10.1016/j.chemosphere.2011.04.021 PubMed: 21549407
57. Gomez-Herrero E, Tobajas M, Polo A, Rodriguez JJ, Mohedano AF. Toxicity and inhibition assessment of ionic liquids by activated sludge. Ecotoxicol Environ Saf. 2020; 187:109836. DOI: 10.1016/j.ecoenv.2019.109836 PubMed: 31675504
4. Pham TP, Cho C-W, Yun Y-S. Environmental fate and toxicity of ionic liquids: A review. Water Res. 2010; 44(2):352-372. DOI: 10.1016/j.watres.2009.09.030 PubMed: 19854462
58. Larson JH, Frost PC, Lamberti GA. Variable toxicity of ionic liquid–forming chemicals to Lemna minor and the influence of dissolved organic matter. Environ Toxicol Chem. 2008; 27(3):676-681. DOI: 10.1897/06-540.1 PubMed: 17967067
57. Gomez-Herrero E, Tobajas M, Polo A, Rodriguez JJ, Mohedano AF. Toxicity and inhibition assessment of ionic liquids by activated sludge. Ecotoxicol Environ Saf. 2020; 187:109836. DOI: 10.1016/j.ecoenv.2019.109836 PubMed: 31675504
8. Cvjetko Bubalo M, Radošević K, Redovniković IR, Halambek J, Srček VG. A brief overview of the potential environmental hazards of ionic liquids. Ecotoxicol Environ Saf. 2014; 99:1-12. DOI: 10.1016/j.ecoenv.2013.10.019 PubMed: 24210364
59. Ranke J, Müller A, Bottin-Weber U, Stock F, Stolte S, Arning J, Störmann R, Jastorff B. Lipophilicity parameters for ionic liquid cations and their correlation to in vitro cytotoxicity. Ecotoxicol Environ Saf. 2007; 67(3):430-438. DOI: 10.1016/j.ecoenv.2006.08.008 PubMed: 17034854
60. Tsarpali V, Belavgeni A, Dailianis S. Investigation of toxic effects of imidazolium ionic liquids, [bmim][BF4] and [omim][BF4], on marine mussel Mytilus galloprovincialis with or without the presence of conventional solvents, such as acetone. Aquat Toxicol. 2015; 164:72-80. DOI: 10.1016/j.aquatox.2015.04.021 PubMed: 25935102
For example, assessment of IL toxicity in a Langmuir monolayer cell membrane model, rat IPC-81 leukemia cells, and bacterial bioassays confirmed ILs with alkyl chain lengths of 2–5 carbons exhibit limited toxicity, ILs with chain lengths of 6–10 carbons exhibit linear increases in toxicity with increasing chain length, and ILs with chain lengths >10 carbons exhibit plateaued toxicity.59,61-63 Bmim-Cl (4 carbons), 1-octyl-3-methylimidazolium chloride (Omim-Cl, 8 carbons), and 1-dodecyl-3-methylimidazolium chloride (Ddmim-Cl, 12 carbons) inhibited cell growth and viability in mouse J774A.1 macrophage cells,35 rat pheochromocytoma PC12 cells,64 and human hepatocellular carcinoma HepG2 cells,65 respectively. Omim-Cl and Ddmim-Cl also induced DNA damage, oxidative stress, apoptosis, and altered membrane permeability in PC12 and HepG2 cells. In addition, Omim-Cl induced adenosine triphosphate depletion in PC12 cells, and Ddmim-Cl altered expression of apoptosis-related genes in HepG2 cells.64,65
59. Ranke J, Müller A, Bottin-Weber U, Stock F, Stolte S, Arning J, Störmann R, Jastorff B. Lipophilicity parameters for ionic liquid cations and their correlation to in vitro cytotoxicity. Ecotoxicol Environ Saf. 2007; 67(3):430-438. DOI: 10.1016/j.ecoenv.2006.08.008 PubMed: 17034854
61. Mester P, Wagner M, Rossmanith P. Antimicrobial effects of short chained imidazolium-based ionic liquids—Influence of anion chaotropicity. Ecotoxicol Environ Saf. 2015; 111:96-101. DOI: 10.1016/j.ecoenv.2014.08.032 PubMed: 25450920
63. Kusumahastuti DKA, Sihtmäe M, Kapitanov IV, Karpichev Y, Gathergood N, Kahru A. Toxicity profiling of 24 l-phenylalanine derived ionic liquids based on pyridinium, imidazolium and cholinium cations and varying alkyl chains using rapid screening Vibrio fischeri bioassay. Ecotoxicol Environ Saf. 2019; 172:556-565. DOI: 10.1016/j.ecoenv.2018.12.076 PubMed: 30776578
35. National Toxicology Program (NTP). Ionic liquids: 1-Butyl-3-methylimidazolium chloride (CAS No. 79917-90-1), 1-butyl-1-methylpyrrolidinium chloride (CAS No. 479500-35-1), n-butylpyridinium chloride (CAS No. 1124-64-7). Review of toxicological literature. Research Triangle Park, NC: Prepared by: Integrated Laboratory Systems, Inc.; 2004. https://ntp.niehs.nih.gov/ntp/htdocs/chem_background/exsumpdf/ionic_liquids_508.pdf
64. Li X-Y, Jing C-Q, Zang X-Y, Yang S, Wang J-J. Toxic cytological alteration and mitochondrial dysfunction in PC12 cells induced by 1-octyl-3-methylimidazolium chloride. Toxicol In Vitro. 2012; 26(7):1087-1092. DOI: 10.1016/j.tiv.2012.07.006 PubMed: 22835898
65. Wang P, Wan R, Huo W, Dong H, Chang Z, Xia X. Cytotoxicity, genotoxicity, oxidative stress, and apoptosis in HepG2 cells induced by the imidazole ionic liquid 1-dodecyl-3-methylimidazolium chloride. Environ Toxicol. 2020; 35(6):665-672. DOI: 10.1002/tox.22901 PubMed: 31916396
64. Li X-Y, Jing C-Q, Zang X-Y, Yang S, Wang J-J. Toxic cytological alteration and mitochondrial dysfunction in PC12 cells induced by 1-octyl-3-methylimidazolium chloride. Toxicol In Vitro. 2012; 26(7):1087-1092. DOI: 10.1016/j.tiv.2012.07.006 PubMed: 22835898
65. Wang P, Wan R, Huo W, Dong H, Chang Z, Xia X. Cytotoxicity, genotoxicity, oxidative stress, and apoptosis in HepG2 cells induced by the imidazole ionic liquid 1-dodecyl-3-methylimidazolium chloride. Environ Toxicol. 2020; 35(6):665-672. DOI: 10.1002/tox.22901 PubMed: 31916396
These effects may be due to the surfactant-like activity observed at ≥6 carbons61 or the very low octanol:water partition coefficient (log Kow = 1) measured at 8–10 carbons.63 Molecular dynamic simulations indicated that 14-carbon alkyl chains were of similar length to the fatty acids in the lipids, resulting in straight line conformation of the alkyl chain, greater stability of the lipids, and IL aggregates in the membrane.66 Although the anion component of an IL is not a major contributor to its toxicity, hydrophobic anions (e.g., bis(trifluoromethanesulfonyl)imide [Tf2N]) have been shown to be more toxic than hydrophilic anions (e.g., Cl, tetrafluoroborate [BF4]). This difference in toxicity is evidenced by the lower median effective concentration (EC50) for Emim-Cl-Tf2N (1.69 mM) compared to Emim-Cl (4.19 mM) in inhibition respiration assays57 and by the increased disruption of the lipid bilayer by hydrophobic anions, relative to hydrophilic anions, in a biomimetic membrane model.67
61. Mester P, Wagner M, Rossmanith P. Antimicrobial effects of short chained imidazolium-based ionic liquids—Influence of anion chaotropicity. Ecotoxicol Environ Saf. 2015; 111:96-101. DOI: 10.1016/j.ecoenv.2014.08.032 PubMed: 25450920
63. Kusumahastuti DKA, Sihtmäe M, Kapitanov IV, Karpichev Y, Gathergood N, Kahru A. Toxicity profiling of 24 l-phenylalanine derived ionic liquids based on pyridinium, imidazolium and cholinium cations and varying alkyl chains using rapid screening Vibrio fischeri bioassay. Ecotoxicol Environ Saf. 2019; 172:556-565. DOI: 10.1016/j.ecoenv.2018.12.076 PubMed: 30776578
66. Lim GS, Zidar J, Cheong DW, Jaenicke S, Klähn M. Impact of ionic liquids in aqueous solution on bacterial plasma membranes studied with molecular dynamics simulations. J Phys Chem B. 2014; 118(35):10444-10459. DOI: 10.1021/jp5060952 PubMed: 25153890
57. Gomez-Herrero E, Tobajas M, Polo A, Rodriguez JJ, Mohedano AF. Toxicity and inhibition assessment of ionic liquids by activated sludge. Ecotoxicol Environ Saf. 2020; 187:109836. DOI: 10.1016/j.ecoenv.2019.109836 PubMed: 31675504
67. Losada-Pérez P, Khorshid M, Renner FU. Interactions of aqueous imidazolium-based ionic liquid mixtures with solid-supported phospholipid vesicles. PLoS One. 2016; 11(9):e0163518. DOI: 10.1371/journal.pone.0163518 PubMed: 27684947
Experimental Animals
High-dose oral exposure to ILs is reported to induce acute toxicity in rodents. Morbidity and mortality increased in adult F344 rats exposed to Bmim-Cl (≥550 mg/kg)46 and in pregnant CD-1 mice exposed to Emim-Cl (3,000 mg/kg body weight/day; mg/kg/day) and Bmim-Cl (225 mg/kg/day).68 Gestational exposure of CD-1 mice to Bmim-Cl (≥169 mg/kg/day) and 1-decyl-3-methylimidazolium chloride (Dmim-Cl; ≥75 mg/kg/day) resulted in decreased fetal body weight.68
46. Landry TD, Brooks K, Poche D, Woolhiser M. Acute toxicity profile of 1-butyl-3-methylimidazolium chloride. Bull Environ Contam Toxicol. 2005; 74(3):559-565. DOI: 10.1007/s00128-005-0620-4 PubMed: 15903191
68. Bailey MM, Jernigan PL, Henson MB, Sturdivant J, Rasco JF, Lovich AN, Lockhard JE, Hough WL, Di Bona KR, Beaird J, et al. A comparison of the effects of prenatal exposure of CD-1 mice to three imidazolium-based ionic liquids. Birth Defects Res B Dev Reprod Toxicol. 2010; 89(3):233-238. DOI: 10.1002/bdrb.20251 PubMed: 20540104
68. Bailey MM, Jernigan PL, Henson MB, Sturdivant J, Rasco JF, Lovich AN, Lockhard JE, Hough WL, Di Bona KR, Beaird J, et al. A comparison of the effects of prenatal exposure of CD-1 mice to three imidazolium-based ionic liquids. Birth Defects Res B Dev Reprod Toxicol. 2010; 89(3):233-238. DOI: 10.1002/bdrb.20251 PubMed: 20540104
Rodent dermal exposure studies with ILs have shown toxicity to be concentration- and vehicle-dependent. In brief, dermal studies of Bmim-Cl exposure in F344 rats confirmed compound absorption was more effective when the IL was dissolved in DMF:water compared to ethanol:water or water alone.43,44 When dissolved in DMF:water, lower concentrations of Bmim-Cl (5 mg/kg) were not well absorbed through the skin. When the concentration increased to 200–800 mg/kg, Bmim-Cl induced dermal irritation. At higher concentrations (2,000 mg/kg), Bmim-Cl in DMF:water resulted in mortality of male and female rats, likely due to an increase in the amount of Bmim-Cl absorbed.46 Similar effects were observed in female Balb/c mice exposed dermally to Bmim-Cl in DMF. Two percent (approximately 50 mg/kg) Bmim-Cl was nontoxic. When the concentrations increased to 10%–75% Bmim-Cl (≥250 mg/kg), a dose-related effect on dermal irritation and mortality was observed following dermal application.46
43. Cheng Y, Wright SH, Hooth MJ, Sipes IG. Characterization of the disposition and toxicokinetics of N-butylpyridinium chloride in male F-344 rats and female B6C3F1 mice and its transport by organic cation transporter 2. Drug Metab Dispos. 2009; 37(4):909-916. DOI: 10.1124/dmd.108.022681 PubMed: 19171679
44. Sipes IG, Knudsen GA, Kuester RK. The effects of dose and route on the toxicokinetics and disposition of 1-butyl-3-methylimidazolium chloride in male F-344 rats and female B6C3F1 mice. Drug Metab Dispos. 2008; 36(2):284-293. DOI: 10.1124/dmd.107.018515 PubMed: 17967929
46. Landry TD, Brooks K, Poche D, Woolhiser M. Acute toxicity profile of 1-butyl-3-methylimidazolium chloride. Bull Environ Contam Toxicol. 2005; 74(3):559-565. DOI: 10.1007/s00128-005-0620-4 PubMed: 15903191
46. Landry TD, Brooks K, Poche D, Woolhiser M. Acute toxicity profile of 1-butyl-3-methylimidazolium chloride. Bull Environ Contam Toxicol. 2005; 74(3):559-565. DOI: 10.1007/s00128-005-0620-4 PubMed: 15903191
Skin sensitization potential of Emim-Cl, Bmim-Cl, Bmpy-Cl, and NBuPy-Cl in female Balb/c mice was previously evaluated by NTP using a combined local lymph node (LLNA)/primary irritancy assay.69 In addition, these four ILs were evaluated in a suite of in chemico and in vitro assays validated by the OECD (Organisation for Economic Co-operation and Development): Direct Peptide Reactivity Assay (DRPA) (OECD 442C), KeratinoSens; Assay (OECD 442D), and human Cell Line Activation Test (hClat) (OECD 442E).70-72 Overall, Bmim-Cl, Bmpy-Cl, and NBuPy-Cl were more potent than Emim-Cl, which was negative in all in vivo, in chemico, and in vitro assessments.69 NBuPy-Cl was found to be a dermal irritant, but not a sensitizer, when applied to the skin at concentrations of 3.12%–12.5%. NBuPy-Cl was classified as a sensitizer in vitro; however, false positives in these assays have been reported when a compound is also a skin irritant.73,74 In vivo, Bmim-Cl and Bmpy-Cl were found to be skin sensitizers at lower applied concentrations of 12.5% and 6.25%, respectively, and were acutely toxic at higher concentrations of 25% and 12.5%, respectively.69 This result for Bmim-Cl matches that reported by Landry and colleagues.46 Although other studies suggest that aromatic cations (e.g., Bmim-Cl) are more toxic than nonaromatic cations (e.g., Bmpy-Cl).57,58,75 Frawley et al.69 found that Bmim-Cl and Bmpy-Cl have similar toxicity in mammalian and in vitro models of hypersensitivity.
69. Frawley RP, Germolec DR, Johnson VJ, Gulledge T, Manheng W, White K, Shockley KR, Harris SF, Hooth M, Ryan K. Evaluation of skin sensitization induced by four ionic liquids. J Appl Toxicol. 2022; 42(3):392-408. DOI: 10.1002/jat.4224 PubMed: 34453447
70. Organisation for Economic Co-operation and Development (OECD). Test no 442C: In chemico skin sensitisation: Direct peptide reactivity assay (DPRA). 2015.
72. Organisation for Economic Co-operation and development (OECD). Test no. 442E: In vitro skin sensitisation assays addressing the key event on activation of dendritic cells on the adverse outcome pathway for skin sensitisation. 2018. https://www.oecd-ilibrary.org/content/publication/9789264264359-en
69. Frawley RP, Germolec DR, Johnson VJ, Gulledge T, Manheng W, White K, Shockley KR, Harris SF, Hooth M, Ryan K. Evaluation of skin sensitization induced by four ionic liquids. J Appl Toxicol. 2022; 42(3):392-408. DOI: 10.1002/jat.4224 PubMed: 34453447
73. Emter R, Ellis G, Natsch A. Performance of a novel keratinocyte-based reporter cell line to screen skin sensitizers in vitro. Toxicol Appl Pharmacol. 2010; 245(3):281-290. DOI: 10.1016/j.taap.2010.03.009 PubMed: 20307559
74. Mitachi T, Mezaki M, Yamashita K, Itagaki H. Acidic conditions induce the suppression of CD86 and CD54 expression in THP-1 cells. J Toxicol Sci. 2018; 43(5):299-309. DOI: 10.2131/jts.43.299 PubMed: 29743441
69. Frawley RP, Germolec DR, Johnson VJ, Gulledge T, Manheng W, White K, Shockley KR, Harris SF, Hooth M, Ryan K. Evaluation of skin sensitization induced by four ionic liquids. J Appl Toxicol. 2022; 42(3):392-408. DOI: 10.1002/jat.4224 PubMed: 34453447
46. Landry TD, Brooks K, Poche D, Woolhiser M. Acute toxicity profile of 1-butyl-3-methylimidazolium chloride. Bull Environ Contam Toxicol. 2005; 74(3):559-565. DOI: 10.1007/s00128-005-0620-4 PubMed: 15903191
57. Gomez-Herrero E, Tobajas M, Polo A, Rodriguez JJ, Mohedano AF. Toxicity and inhibition assessment of ionic liquids by activated sludge. Ecotoxicol Environ Saf. 2020; 187:109836. DOI: 10.1016/j.ecoenv.2019.109836 PubMed: 31675504
58. Larson JH, Frost PC, Lamberti GA. Variable toxicity of ionic liquid–forming chemicals to Lemna minor and the influence of dissolved organic matter. Environ Toxicol Chem. 2008; 27(3):676-681. DOI: 10.1897/06-540.1 PubMed: 17967067
75. Hernández-Fernández FJ, Bayo J, Pérez de los Ríos A, Vicente MA, Bernal FJ, Quesada-Medina J. Discovering less toxic ionic liquids by using the Microtox toxicity test. Ecotoxicol Environ Saf. 2015; 116:29-33. DOI: 10.1016/j.ecoenv.2015.02.034 PubMed: 25748519
69. Frawley RP, Germolec DR, Johnson VJ, Gulledge T, Manheng W, White K, Shockley KR, Harris SF, Hooth M, Ryan K. Evaluation of skin sensitization induced by four ionic liquids. J Appl Toxicol. 2022; 42(3):392-408. DOI: 10.1002/jat.4224 PubMed: 34453447
Humans
There has been little to no research evaluating the toxicity of ILs to humans. However, the Globally Harmonized System of Classification and Labeling of Chemicals (GHS)-aggregated information for Bmim-Cl, one of the most studied ILs, suggests that human exposure can cause irritation to the eye, skin, and respiratory system (specifically, the mucous membranes in the mouth, pharynx, esophagus, and gastrointestinal tract following swallowing). Inhalation of the compound may result in irritation of the mucous membranes, coughing, and dyspnea.35,76
35. National Toxicology Program (NTP). Ionic liquids: 1-Butyl-3-methylimidazolium chloride (CAS No. 79917-90-1), 1-butyl-1-methylpyrrolidinium chloride (CAS No. 479500-35-1), n-butylpyridinium chloride (CAS No. 1124-64-7). Review of toxicological literature. Research Triangle Park, NC: Prepared by: Integrated Laboratory Systems, Inc.; 2004. https://ntp.niehs.nih.gov/ntp/htdocs/chem_background/exsumpdf/ionic_liquids_508.pdf
76. National Center for Biotechnology Information (NCBI). PubChem Compound LCSS for CID 2734161, 1-Butyl-3-methylimidazolium chloride: 1. GHS Classification. Bethesda, MD: National Library of Medicine; 2019. https://pubchem.ncbi.nlm.nih.gov/compound/2734161#datasheet=LCSS§ion=GHS-Classification
Genetic Toxicity
The literature contains no studies on the genetic toxicity of ILs in animals or humans.
Study Rationale
ILs were nominated to NTP by the Center for Green Manufacturing, University of Alabama, for toxicological testing because of widespread interest in their use as alternatives to volatile organic solvents and the limited toxicity, ADME, and environmental fate data available for this class of compounds. At the time of nomination, the compounds recommended for evaluation represented the three most common cation classes (e.g., imidazolium, pyridinium, and pyrrolidinium cations) being investigated for use in various industrial applications. NTP characterized both the general and relative toxicity of four ILs to begin evaluating this chemical class and to test the hypothesis that specific structural variations (e.g., cation and/or alkyl chain length) affect the toxicity of ILs.
Materials and Methods
Procurement and Characterization of Ionic Liquids
1‐Ethyl‐3‐methylimidazolium chloride (Emim-Cl) was obtained from Sigma-Aldrich (St. Louis, MO) in three lots (S37784, S46787, and STBB3624); 1-butyl-3-methylimidazolium chloride (Bmim-Cl) was obtained from Solvent Innovations (Koln, Germany) in a single lot (99/787) and from Sigma-Aldrich (St. Louis, MO) in a single lot (STBB3444); 1-butyl-1-methylpyrrolidinium chloride (Bmpy-Cl) was obtained from Solvent Innovations (Koln, Germany) in a single lot (99/831) and from Promy Chemical, Inc. (El Sobrante, CA) in a single lot (20100610); and n-butylpyridinium chloride (NBuPy-Cl) was obtained from Solvent Innovations (Koln, Germany) in a single lot (99/830) and from Promy Chemical, Inc. (El Sobrante, CA) in a single lot (20100610). Identity, purity, and stability analyses were conducted by the analytical chemistry laboratory at MRIGlobal (Kansas City, MO) (Appendix A). Reports on analyses performed in support of the ionic liquid (IL) studies are on file at the National Institute of Environmental Health Sciences (NIEHS).
Lot S37784 (Emim-Cl), a faint yellow solid; lot S46787 (Emim-Cl), a brown solid; lot STBB3624 (Emim-Cl), a yellow-brown solid; lot 99/787 (Bmim-Cl), a pale amber solid; lot STBB3444 (Bmim-Cl), a solid white mass with small orange streaks; lot 99/831 (Bmpy-Cl), a white chunky powder; lot 20100610 (Bmpy-Cl), a pale-yellow crystalline powder; lot 99/830 (NBuPy-Cl), an off-white solid with a peach hue; and lot 20100610 (NBuPy-Cl), a pale-yellow crystalline powder, were identified using infrared (IR) spectroscopy, 1H nuclear magnetic resonance (NMR) spectroscopy, and mass spectrometry (MS). In addition, elemental analysis was performed by Prevalere Life Sciences, Inc. (Whitesboro, NY) to confirm the identity of each compound.
The purity of each IL was determined using high-performance liquid chromatography (HPLC) with ultraviolet (UV), evaporative light scattering detection (ELSD), or charged aerosol detection (CAD) (Table A-1). Residual solvent content was determined by weight loss on drying or headspace gas chromatography (GC/headspace) with flame ionization detection (FID), and any impurities were identified using GC with MS detection. The chloride content of each IL was quantified using ion chromatography (IC). Moisture content was measured for each IL using Karl Fischer titration; however, the calculated results are estimates due to the hygroscopic nature of these compounds. The analytical methods and systems used for each respective lot are described in detail in Appendix A. Purity analysis results for each lot are listed in Table 2.
Accelerated stability studies were conducted on samples of lots STBB3624 (Emim-Cl), STBB3444 (Bmim-Cl), 20100610 (Bmpy-Cl), and 20100610 (NBuPy-Cl). Samples were stored for 2 weeks under an inert headspace in amber glass vials sealed with Teflon-lined screw-top lids at frozen (−20°C), refrigerated (5°C), room (25°C), and elevated (60°C) temperatures. Stability was confirmed for all analyzed lots at all four temperatures. The bulk chemicals (all lots) were stored at room temperature in sealed amber glass containers under inert gas headspace. Reanalysis of the bulk chemicals on all lots except S46787 (Emim-Cl) were performed, and no degradation was detected.
Preparation and Analysis of Dose Formulations
The dose formulations for the 2-week study were prepared once at MRIGlobal (Kansas City, MO) by mixing Emim-Cl, Bmim-Cl, Bmpy-Cl, or NBuPy-Cl with tap water to give the required concentrations (Table 3). Dose formulations of Emim-Cl were prepared with lot S37784, except for the 100 mg/mL formulation, which was a combination of lots S37784 and S46787. Dose formulations of Bmim-Cl, Bmpy-Cl, and NBuPy-Cl were prepared with lots 99/787, 99/831, and 99/830, respectively (Table A-3).
Homogeneity was confirmed for the highest and lowest dose formulations of each IL. Stability studies were completed for representative formulations of each IL and are described in Appendix A. The storage stability of Emim-Cl, Bmim-C, Bmpy-Cl, and NBuPy-Cl was confirmed at refrigerated temperatures when protected from light for up to 21 days, 42 days, 42 days, and 35 days, respectively. All dose formulations were stored protected from light at refrigerated temperatures (2°C–8°C) for ≤7 days until shipment to the study laboratory (BioReliance, Rockville, MD). At the study laboratory, all dose formulations were stored protected from light in a plastic carboy at refrigerated temperatures (2°C–8°C) and used within 42 days.
Analyses of preadministration and postadministration dose formulations for the 2-week studies of Emim-Cl, Bmim-Cl, and NBuPy-Cl were conducted once for each study by the MRIGlobal analytical chemistry laboratory using HPLC/UV. HPLC/ELSD was used to conduct analysis of preadministration and postadministration dose formulations of Bmpy-Cl. Postadministration dose formulation analysis results are averages from animal room drinking water bottles and bulk containers. All dose formulations were within 10% of the target concentrations for all four chemicals (Emim-Cl [Table A-5], Bmim-Cl [Table A-8], Bmpy-Cl [Table A-11], and NBuPy-Cl [Table A-14]). The pH of the Emim-Cl and Bmpy-Cl dose formulations was measured postadministration and is reported in Table A-17 and Table A-18, respectively. pH ranged from 7.1 to 9.1 across all samples.
The dose formulations for the 3-month studies were prepared at the Battelle study laboratory (Columbus, OH) by mixing Emim-Cl, Bmim-Cl, Bmpy-Cl, or NBuPy-Cl with tap water to give the required concentrations for each species (Table 4). Dose formulations were prepared with lots STBB3624 (Emim-Cl), STBB3444 (Bmim-Cl), 20100610 (Bmpy-Cl), and 20100610 (NBuPy-Cl), respectively (Table A-4). Stability and homogeneity studies were completed for representative formulations of each IL and described in Appendix A. All four IL dose formulations were considered stable for ≤42 days when stored refrigerated or at room temperature, protected from light. The formulations were stored protected from light in a plastic carboy at refrigerated temperatures (2°C–8°C). Emim-Cl and NBuPy-Cl formulations were used within 35 days of preparation, and Bmim-Cl and Bmpy-Cl formulations were used within 42 days of preparation.
Analyses of preadministration and postadministration dose formulations for the 3-month studies of Emim-Cl, Bmim-Cl, and NBuPy-Cl were conducted once after each new formulation was prepared at the Battelle study laboratory using HPLC/UV. HPLC/CAD was used to conduct similar analyses of the dose formulations for the 3-month study of Bmpy-Cl. All preadministration dose formulations for all four chemicals were within 10% of the target concentrations. All animal room samples for Emim-Cl (Table A-6, Table A-7) and Bmim-Cl (Table A-9, Table A-10) were within 10% of the target concentrations. All animal room samples for Bmpy-Cl (Table A-12, Table A-13) were within 10% of the target concentrations, apart from three samples for the rat study and five samples for the mouse study (10.7%–15.8%). All animal room samples for NBuPy-Cl (Table A-15, Table A-16) were within 10% of the target concentrations, apart from one carboy sample for the rat study, which was 13.1% above the target concentration.
Animal Source
Male and female Sprague Dawley (Hsd:Sprague Dawley SD) rats were obtained from Envigo (formerly Harlan Laboratories, Inc., Indianapolis, IN). Male and female B6C3F1/N mice were obtained from the National Toxicology Program (NTP) colony maintained by Taconic Biosciences, Inc. (Germantown, NY).
Animal Welfare
Animal care and use were in accordance with the Public Health Service Policy on Humane Care and Use of Animals. All animal studies were conducted in an animal facility accredited by AAALAC International. Studies were approved by the BioReliance (Rockville, MD) and Battelle (Columbus, OH) Animal Care and Use Committees and conducted in accordance with all relevant National Institutes of Health and NTP animal care and use policies and applicable federal, state, and local regulations and guidelines.
Two-week Studies
The 2-week dose range-finding studies were designed to run concurrently. Thus, all four ILs evaluated for toxicity were compared to the same set of control animals. Details of the experimental design are shown in Table 3. Concentrations for the 2-week studies were informed by the water solubility of each IL and preliminary palatability studies (e.g., changes in mortality, clinical signs of toxicity, body weight decreases, and feed/water consumption) in rats and mice (data not shown). Additional information in the literature suggested that Emim-Cl was less toxic than Bmim-Cl. Therefore, a high exposure concentration of 100 mg/mL was selected for Emim-Cl on the basis of a 10% drinking water concentration, and three lower concentrations were selected to provide overlapping concentrations with the other compounds. Data from the 2-week studies were evaluated for selection of concentrations to be used in the 3-month exposure studies.
Rats and mice were approximately 4 weeks old on receipt. Animals were quarantined for 11 days (male rats), 12 days (female rats), 14 days (male mice), or 15 days (female mice) and were approximately 6 weeks old on the first day of the studies. Rats and mice were randomly assigned to either the control group or one of three (Bmim-Cl, Bmpy-Cl, and NBuPy-Cl) or four (Emim-Cl) exposed groups. Randomization was stratified by body weight that produced similar group mean weights using ProvantisTM, Version 6.5.0.1 software (Instem, Philadelphia, PA).
Due to the short duration of the study, disease screening was not conducted at the study laboratory; however, both rats and mice were obtained from commercial vendors with extensive health surveillance programs. Rats were obtained from a colony free of the following rat pathogens: Sendai virus, pneumonia virus of mice, sialodacryoadenitis virus, Kilham rat virus, Toolan’s H1 virus, rat minute virus, reovirus, rat theilovirus, lymphocytic choriomeningitis virus, hantavirus, mouse adenovirus, rat parvovirus, Mycoplasma pulmonis, and Pneumocystis carinii. Mice were obtained from a colony free of the following mouse pathogens: ectromelia virus, epizootic diarrhea of infant mice (EDIM), lymphocytic choriomeningitis virus, Mycoplasma pulmonis, mouse hepatitis virus, mouse norovirus, mouse parvovirus, minute virus of mice, pneumonia virus of mice, reovirus, Sendai, and Theiler's murine encephalomyelitis virus.
Groups of five male and five female rats and mice were provided Emim-Cl, Bmim-Cl, Bmpy-Cl, or NBuPy-Cl in drinking water for 15 days at the following exposure concentrations: Emim-Cl (0, 3, 10, 30, or 100 mg/mL), Bmim-Cl (0, 0.3, 1, or 3 mg/mL for rats; 0, 1, 3, or 6 mg/mL for mice), Bmpy-Cl (0, 1, 3, or 6 mg/mL for rats; 0, 3, 6, or 10 mg/mL for mice), or NBuPy-Cl (0, 1, 3, or 6 mg/mL). Groups of 10 male and 10 female rats and mice were provided tap water as the vehicle control.
Feed and water were available ad libitum. Rats and mice were housed individually (male mice) or five per cage by sex (male and female rats, female mice). Rats and mice were observed twice daily for signs of mortality or moribundity. Clinical observations and body weights were recorded initially, on study day 8, and at the end of the 2-week exposure period. Water consumption data were recorded on study days 1, 4, 8, 11, 14, and 15 for rats and study days 1, 5, 8, 12, and 15 for mice. Details of the study design and animal maintenance are summarized in Table 3. Information on feed composition and contaminants is provided in Appendix B.
Necropsies were performed on all rats and mice. Organ weights were determined for heart, right kidney, liver, lungs, right testis, and thymus. Tissues for microscopic examination were fixed and preserved in 10% neutral buffered formalin (except eyes and Harderian gland, which were first fixed in Davidson’s solution), processed, and trimmed, embedded in paraffin, sectioned to a thickness of approximately 5 μm, and stained with hematoxylin and eosin (H&E). Complete histopathological examinations were performed by the study laboratory pathologist on all control animals and all animals in the highest exposed group for each IL. Table 3 lists the tissues and organs examined.
Three-month Studies
Study Design for Rats
Rats were approximately 3 to 5 weeks old on receipt. Animals were quarantined for 12 days and were approximately 5 to 7 weeks old on the first day of the studies. Rats were randomly assigned to one of four exposure groups for each IL. Randomization was stratified by body weight that produced similar group mean weights using PATH/TOX SYSTEM software (Xybion Corporation, Lawrenceville, NJ).
Before the studies began, five male and five female rats were randomly selected for parasite evaluation and gross observation of disease. Additionally, the health of the animals was monitored during the study according to the protocols of the NTP Sentinel Animal Program (Appendix C). All test results were negative.
Groups of 10 male and 10 female rats were exposed to Emim-Cl, Bmim-Cl, Bmpy-Cl, or NBuPy-Cl in drinking water for 3 months at the following exposure concentrations: Emim-Cl (0, 1, 3, or 10 mg/mL), Bmim-Cl (0, 0.1, 0.3, or 1 mg/mL), Bmpy-Cl (0, 0.3 [males only], 1, 3, or 6 [females only] mg/mL), or NBuPy-Cl (0, 0.3, 1, or 3 mg/mL); tap water served as the control.
Feed and water were available ad libitum. Rats were housed up to three (males) or five (females) per cage. Details of the study design and animal maintenance are summarized in Table 4. Information on feed composition and contaminants is provided in Appendix B.
Study Design for Mice
Mice were approximately 3 to 5 weeks old on receipt. Animals were quarantined for 12 days and were approximately 5 to 6 weeks old on the first day of the studies. Mice were randomly assigned to one of four exposure groups for each IL. Randomization was stratified by body weight that produced similar group mean weights using PATH/TOX SYSTEM software (Xybion Corporation, Lawrenceville, NJ).
Before the studies began, five male and five female mice were randomly selected for parasite evaluation and gross observation of disease. Additionally, the health of the animals was monitored during the study according to the protocols of the NTP Sentinel Animal Program (Appendix C). All test results were negative.
Groups of 10 male and 10 female mice were exposed to Emim-Cl, Bmim-Cl, Bmpy-Cl, or NBuPy-Cl in drinking water for 3 months at the following exposure concentrations: Emim-Cl (0, 3, 10, or 30 mg/mL), Bmim-Cl (0, 0.3, 1, or 3 mg/mL), Bmpy-Cl (0, 1, 3, 6 [females only], or 10 [males only] mg/mL), or NBuPy-Cl (0, 1, 3 or 6 mg/mL); tap water served as the control.
Feed and water were available ad libitum. Mice were housed individually (males) or up to four (females) per cage. Details of the study design and animal maintenance are summarized in Table 4. Information on feed composition and contaminants is provided in Appendix B.
Clinical Examination and Pathology
During the 3-month studies, rats and mice were observed twice daily for signs of mortality or moribundity. Clinical observations and body weights were recorded initially, weekly, and at the end of the 3-month exposure period. Water consumption was measured weekly for 3 months.
Blood was collected from the retroorbital plexus (rats) or retroorbital sinus (mice) of all animals at the end of the 3-month exposure period for hematology, clinical chemistry (rats only), and erythrocyte micronuclei analyses. Animals were anesthetized with a carbon dioxide/oxygen mixture and bled in a random order. Blood was collected into tubes containing ethylenediaminetetraacetic acid (EDTA) for hematology or into serum separator tubes for clinical chemistry. Hematology parameters were analyzed using the Advia 120 (Siemens Healthcare GmbH, Erlangen, Germany). Clinical chemistry parameters were analyzed using the Roche cobas c501 Chemistry Analyzer (Roche Diagnostics, Indianapolis, IN). The parameters measured are listed in Table 4.
At the end of the 3-month exposure period, samples were collected for sperm motility and vaginal cytology evaluations on all rats and mice. The parameters evaluated are listed in Table 4. For 16 consecutive days before the end of the 3-month exposure period, the vaginal vaults of the females were moistened with saline, if necessary, and samples of vaginal fluid and cells were collected and subsequently stained. Relative numbers of leukocytes, nucleated epithelial cells, and large squamous epithelial cells were determined and used to ascertain estrous cycle stage (i.e., diestrus, proestrus, estrus, and metestrus). Measured parameters of cycle length, number of cycles, and time spent in any specific stage of the estrous cycle of female rats and mice are reported in Appendix E. Male animals were evaluated for sperm count and motility. The right testis was used for organ weights and histopathology evaluation. The cauda portion of the left epididymis was used for sperm motility and concentration evaluation; the remainder of the left epididymis was fixed and processed for potential histopathological evaluation. The left testis was placed in a labeled plastic vial and then quick-frozen in dry ice for spermatid evaluation. Frozen testes were stored at approximately −70°C. However, due to artifacts identified during analysis (e.g., clumping of cells, too many sperm in sample), meaningful interpretation of motility and concentration data was not possible. Therefore, sperm motility and sperm/spermatid concentration data were not analyzed or reported.
Necropsies were performed on all animals. Organ weights were determined for the heart, right kidney, liver, lungs, right testis, and thymus from all rats and mice. Tissues for microscopic examination were fixed and preserved in 10% neutral buffered formalin (except eyes, which were first fixed in Davidson’s solution, and testes, vaginal tunics, and epididymides, which were first fixed in modified Davidson’s solution), processed and trimmed, embedded in paraffin, sectioned to a thickness of approximately 5 μm, and stained with H&E. Complete histopathological examinations were performed by the study laboratory pathologist on all control animals and all animals in the highest exposed group for each IL. Table 4 lists the tissues and organs examined.
The laboratory report and select histopathology slides were reviewed by a quality assessment (QA) pathologist, who also served as the coordinator of the Pathology Working Group (PWG). The QA report and the reviewed slides were submitted to the NTP pathologist, who reviewed and addressed any inconsistencies in the diagnoses made by the study laboratory and QA pathologist. The QA/PWG pathologist presented representative histopathology slides containing examples of lesions related to test agent administration, examples of disagreements in diagnoses between the laboratory and QA pathologist, or lesions of general interest to the PWG for review. Final diagnoses for reviewed lesions represent a consensus between the laboratory pathologist, QA pathologist, and the PWG. Details of these review procedures have been described, in part, by Maronpot and Boorman77 and Boorman et al.78
77. Maronpot RR, Boorman GA. Interpretation of rodent hepatocellular proliferative alterations and hepatocellular tumors in chemical safety assessment. Toxicol Pathol. 1982; 10(2):71-78. DOI: 10.1177/019262338201000210 PubMed: 28094716
78. Boorman GA, Haseman JK, Waters MD, Hardisty JF, Sills RC. Quality review procedures necessary for rodent pathology databases and toxicogenomic studies: The National Toxicology Program experience. Toxicol Pathol. 2002; 30(1):88-92. DOI: 10.1080/01926230252824752 PubMed: 11890481
Statistical Methods
Calculation and Analysis of Nonneoplastic Lesion Incidences
The incidences of nonneoplastic lesions are presented as numbers of animals bearing such lesions at a specific anatomic site and the numbers of animals with that site examined microscopically. Fisher’s exact test,79 a procedure that uses the overall proportion of affected animals, was used to determine statistical significance between exposed and control animals, and the Cochran-Armitage trend test was used to test for significant trends.80
79. Gart JJ, Chu KC, Tarone RE. Statistical issues in interpretation of chronic bioassay tests for carcinogenicity. J Natl Cancer Inst. 1979; 62(4):957-974. PubMed: 285297
80. Armitage P. Statistical Methods in Medical Research. Oxford: Blackwell; 1971.
Analysis of Continuous Variables
Two approaches were employed to assess the significance of pairwise comparisons between exposed and control groups in the analysis of continuous variables. Organ and body weight data, which historically have approximately normal distributions, were analyzed with the parametric multiple comparison procedures of Dunnett81 and Williams.82,83 Hematology and clinical chemistry data, which typically have skewed distributions, were analyzed using the nonparametric multiple comparison methods of Shirley84 (as modified by Williams85 and Dunn86). The Jonckheere test87 was used to assess the significance of the exposure concentration-related trends and to determine whether a trend-sensitive test (the Williams or Shirley test) was more appropriate for pairwise comparisons than a test that does not assume a monotonic exposure concentration-related trend (the Dunnett or Dunn test). Before statistical analysis, outliers identified by the Dixon and Massey88 test were examined by NTP personnel, and biologically implausible values (likely due to experimental error) were eliminated from the analysis.
81. Dunnett CW. A multiple comparison procedure for comparing several treatments with a control. J Am Stat Assoc. 1955; 50(272):1096-1121. DOI: 10.1080/01621459.1955.10501294
82. Williams DA. The comparison of several dose levels with a zero dose control. Biometrics. 1972; 28(2):519-531. DOI: 10.2307/2556164 PubMed: 5037867
83. Williams DA. A test for differences between treatment means when several dose levels are compared with a zero dose control. Biometrics. 1971; 27(1):103-117. DOI: 10.2307/2528930 PubMed: 5547548
84. Shirley E. A non-parametric equivalent of Williams’ test for contrasting increasing dose levels of a treatment. Biometrics. 1977; 33(2):386-389. DOI: 10.2307/2529789 PubMed: 884197
85. Williams DA. A note on Shirley’s nonparametric test for comparing several dose levels with a zero-dose control. Biometrics. 1986; 42(1):183-186. DOI: 10.2307/2531254 PubMed: 3719054
86. Dunn OJ. Multiple comparisons using rank sums. Technometrics. 1964; 6(3):241-252. DOI: 10.1080/00401706.1964.10490181
87. Jonckheere AR. A distribution-free k-sample test against ordered alternatives. Biometrika. 1954; 41(1-2):133-145. DOI: 10.1093/biomet/41.1-2.133
88. Dixon W, Massey F. Introduction to Statistical Analysis. New York, NY: McGraw Hill Book Company Inc; 1957. DOI: 10.2307/2332898
Analysis of Vaginal Cytology Data
Vaginal cytology data consist of daily observations of estrous cycle stages over a 16-day period. Differences from the control group for cycle length and the number of cycles were analyzed using the Shirley and Dunn tests, as described above.
To identify disruptions in estrous cyclicity, a continuous-time Markov chain model (multistate model) was fit using a maximum likelihood approach,89 producing estimates of stage lengths for each exposure group. Confidence intervals for these estimates were obtained from bootstrap sampling of the individual animal cycle sequences. Stage lengths that were significantly different from the control animals were identified using permutation testing.
89. Kalbfleisch JD, Lawless JF. The analysis of panel data under a Markov assumption. J Am Stat Assoc. 1985; 80(392):863-871. DOI: 10.1080/01621459.1985.10478195
Quality Assurance Methods
The 2-week and 3-month studies were conducted in compliance with U.S. Food and Drug Administration Good Laboratory Practice Regulations.90 In addition, the 2-week and 3-month study reports were audited retrospectively by an independent QA contractor against study records submitted to the NTP Archives. Separate audits covered completeness and accuracy of the pathology data, pathology specimens, final pathology tables, and a draft of this NTP toxicity report. Audit procedures and findings are presented in the reports and are on file at the NIEHS. The audit findings were reviewed and assessed by NTP staff, and all comments were resolved or otherwise addressed during the preparation of this toxicity report.
90. Code of Federal Regulations (CFR). 21(Part 58).
Genetic Toxicology
The genetic toxicities of Emim-Cl, Bmim-Cl, Bmpy-Cl, and NBuPy-Cl were assessed by testing whether each chemical induced mutations in various strains of Salmonella typhimurium and Escherichia coli or increased the frequency of micronucleated erythrocytes in rat and mouse peripheral blood. The protocol for these studies and the results are given in Appendix D.
The genetic toxicity studies have evolved from an earlier effort by NTP to develop a comprehensive database that permits critical anticipation of a chemical’s carcinogenicity in experimental animals based on numerous considerations, including the relationship between the molecular structure of the chemical and its observed effects in short-term in vitro and in vivo genetic toxicity tests (structure-activity relationships). The short-term tests were developed originally to clarify proposed mechanisms of chemical-induced DNA damage, given the relationship between electrophilicity and mutagenicity,91 and the somatic mutation theory of cancer.92,93 Not all cancers, however, arise through genotoxic mechanisms.
91. Miller JA, Miller EC. Ultimate chemical carcinogens as reactive mutagenic electrophiles. In: Hiatt HH, Watson JD, Winsten JA, editors. Origins of Human Cancer. Cold Spring Harbor, NY: Cold Spring Harbor Laboratory; 1977. p. 605-627.
92. Straus DS. Somatic mutation, cellular differentiation, and cancer causation. J Natl Cancer Inst. 1981; 67:233-241. PubMed: 7021938
93. Crawford BD. Perspectives on the somatic mutation model of carcinogenesis. In: Mehlman MA, Flamm WG, Lorentzen RJ, editors. Advances in Modern Environmental Toxicology Mechanisms and Toxicity of Chemical Carcinogens and Mutagens. Princeton, NJ: Princeton Scientific Publishing Co. Inc; 1985. p. 13-59.
Bacterial Mutagenicity
DNA reactivity combined with Salmonella mutagenicity is highly correlated with induction of carcinogenicity in multiple species/sexes of rodents and at multiple tissue sites.94 A positive response in the Salmonella test was shown to be the most predictive in vitro indicator for rodent carcinogenicity (89% of the Salmonella mutagens are rodent carcinogens).95,96 Additionally, no battery of tests that included the Salmonella test improved the predictivity of the Salmonella test alone. Other tests, however, can provide useful information on the types of DNA and chromosomal damage induced by the chemical under investigation.
94. Ashby J, Tennant RW. Definitive relationships among chemical structure, carcinogenicity and mutagenicity for 301 chemicals tested by the US NTP. Mutat Res. 1991; 257(3):229-306. DOI: 10.1016/0165-1110(91)90003-E PubMed: 1707500
95. Tennant RW, Margolin BH, Shelby MD, Zeiger E, Haseman JK, Spalding J, Caspary W, Resnick M, Stasiewicz S, Anderson B, et al. Prediction of chemical carcinogenicity in rodents from in vitro genetic toxicity assays. Science. 1987; 236(4804):933-941. DOI: 10.1126/science.3554512 PubMed: 3554512
96. Zeiger E, Haseman JK, Shelby MD, Margolin BH, Tennant RW, Holden H. Evaluation of four in vitro genetic toxicity tests for predicting rodent carcinogenicity: Confirmation of earlier results with 41 additional chemicals. Environ Mol Mutagen. 1990; 16(S18):1-14. DOI: 10.1002/em.2850160502 PubMed: 2091921
Peripheral Blood Micronucleus Test
Micronuclei (literally “small nuclei” or Howell-Jolly bodies) are biomarkers of induced structural or numerical chromosomal alterations and are formed when acentric fragments or whole chromosomes fail to incorporate into either of two daughter nuclei during cell division.97,98 Acute in vivo bone marrow chromosome aberration and micronucleus tests appear to be less predictive of carcinogenicity than the Salmonella test.99,100 However, clearly positive results in long-term peripheral blood micronucleus tests have high predictivity for rodent carcinogenicity; a weak response in one sex only or negative results in both sexes in this assay do not correlate well with either negative or positive results in rodent carcinogenicity studies.101 Because of the theoretical and observed associations between induced genetic damage and adverse effects in somatic and germ cells, determination of in vivo genetic effects is important to overall understanding of risks associated with exposure to a particular chemical.
97. Schmid W. The micronucleus test. Mutat Res. 1975; 31(1):9-15. DOI: 10.1016/0165-1161(75)90058-8 PubMed: 48190
98. Heddle JA, Hite M, Kirkhart B, Mavournin K, MacGregor JT, Newell GW, Salamone MF. The induction of micronuclei as a measure of genotoxicity. A report of the U.S. Environmental Protection Agency Gene-Tox Program. Mutat Res. 1983; 123(1):61-118. DOI: 10.1016/0165-1110(83)90047-7 PubMed: 6888413
99. Shelby MD, Witt KL. Comparison results from mouse bone marrow chromosome aberration and micronucleus tests. Environ Mol Mutagen. 1995; 25:302-313. DOI: 10.1002/em.2850250407 PubMed: 7607185
100. Shelby MD, Erexson GL, Hook GJ, Tice RR. Evaluation of a three-exposure mouse bone marrow micronucleus protocol: Results with 49 chemicals. Environ Mol Mutagen. 1993; 21(2):160-179. DOI: 10.1002/em.2850210210 PubMed: 8444144
101. Witt KL, Knapton A, Wehr CM, Hook GJ, Mirsalis J, Shelby MD, MacGregor JT. Micronucleated erythrocyte frequency in peripheral blood of B6C3F(1) mice from short-term, prechronic, and chronic studies of the NTP carcinogenesis bioassay program. Environ Mol Mutagen. 2000; 36(3):163-194. DOI: 10.1002/1098-2280(2000)36:3<163::AID-EM1>3.0.CO;2-P PubMed: 11044899
Results
Data Availability
The National Toxicology Program (NTP) evaluated all study data. Data relevant for evaluating toxicological findings are presented here. All study data are available in the NTP Chemical Effects in Biological Systems (CEBS) database: https://doi.org/10.22427/NTP-DATA-TOX-103.102
102. National Toxicology Program (NTP). Pathology tables, survival and growth curves from NTP 1-butyl-3-methylimidazolium chloride, 1-butyl-1-methylpyrrolidinium chloride, 1-ethyl-3-methylimidazolium chloride, n-butylpyridinium chloride, and genetic toxicology studies. Research Triangle Park, NC: U.S. Department of Health and Human Services, National Institute of Environmental Health Sciences, National Toxicology Program; 2020. DOI: 10.22427/NTP-DATA-TOX-103
Two-week Studies
Rats and Mice
In the 2-week studies, survival of rats and mice was not affected by exposure to 1-ethyl-3-methylimidazolium chloride (Emim-Cl), 1-butyl-3-methylimidazolium chloride (Bmim-Cl), 1-butyl-1-methylpyrrolidinium chloride (Bmpy-Cl), or n-butylpyridinium chloride (NBuPy-Cl). Clinical observations, including thinness and ruffled fur, were common in rats and mice exposed to higher concentrations of each ionic liquid (IL), except for Bmim-Cl- and Bmpy-Cl-exposed rats, which did not have any exposure-related clinical findings (Appendix E).
The clinical findings may have been related to lower body weights. An exposure concentration-dependent decrease in body weight was observed in most groups of male and female rats and mice exposed to ILs; terminal mean body weights of the highest exposed groups of rats and mice were often lower than those of the control groups (Table 5). Terminal mean body weights following Emim-Cl exposure were 32%–38% of the control groups in male and female rats and approximately 54% of the control groups in male and female mice at the highest concentration (100 mg/mL). In Bmim-Cl-exposed male and female animals, terminal mean body weights were 85%–86% and 81%–87% of the control groups in rats and mice, respectively, at the highest concentrations (3 mg/mL rats, 6 mg/mL mice). Terminal mean body weights of Bmpy-Cl-exposed male and female rats were approximately 83%–91% of the control groups and 86% of the control group in female mice at the highest concentrations (6 mg/mL rats, 10 mg/mL mice). Terminal mean body weights of male mice were unaffected by Bmpy-Cl administration. In NBuPy-Cl-exposed male and female rats, terminal mean body weights were approximately 67%–68% of the control groups at the highest concentration (6 mg/mL). Terminal mean body weights of male and female mice were approximately 89% of the control groups at the highest concentration (6 mg/mL).
Lower mean body weights were associated with lower water consumption. Test article palatability likely directly affected mean water consumption and indirectly affected mean body weights. In general, mean water consumption by exposed rats was lower compared to control animals than consumption by exposed mice; this difference between rats and mice was most evident at the highest exposure concentrations for each IL (Table 6). Compared to the respective control groups, mean water consumption at the highest exposure concentration was 45%–46% by Bmim-Cl-exposed rats (3 mg/mL), 46%–57% by Bmim-Cl-exposed mice (6 mg/mL), 50%–55% by Bmpy-Cl-exposed rats (6 mg/mL), 25%–73% by Bmpy-Cl-exposed mice (10 mg/mL), 36%–38% by NBuPy-Cl-exposed rats (6 mg/mL), and 49%–71% by NBuPy-Cl-exposed mice (6 mg/mL). Water consumption values were much lower for Emim-Cl-exposed rats and mice, which were exposed to higher concentrations of the test article in drinking water. In male and female rats exposed to 30 or 100 mg/mL Emim-Cl, mean water consumption values were approximately 40% or 5%, respectively, of those of the control groups. In mice exposed to the same concentrations of Emim-Cl, mean water consumption values were 45%–69% (males) and 21%–57% (females) of the control groups. Due to lower water consumption by the higher exposed groups, compound consumption did not increase proportionally with higher exposure concentrations of each IL in water. Compound consumption values for each IL are presented as supplemental data in Appendix E.
Several organ weight fluctuations were observed in rats and mice exposed to ILs, most of which occurred in animals exposed at the highest IL exposure concentrations. Compared to control animals, changes in mean organ weights were often characterized by lower absolute weight and higher relative weight, which corresponded to lower mean body weights. The largest organ weight differences from the control group were recorded in the Emim-Cl and NBuPy-Cl studies, which also had the greatest reduction in mean water consumption and terminal mean body weights compared to control animals. Animals exposed to Bmim-Cl or Bmpy-Cl exhibited limited organ weight differences from the control group, which were chemical- and sex-specific. Organ weight data for each IL can be found in Appendix E.
Although a formal NTP review of histopathological findings was not conducted for the 2-week studies, several lesions were found to be common in animals exposed to higher IL concentrations in both sexes and species. Lesions such as glycogen depletion of the liver, thymic atrophy, cellular depletion of the spleen, and degeneration of the testes were most common across the ILs. It is difficult to determine whether these changes were related to chronic stress and/or lower water (or hypothesized feed) consumption and lower body weights rather than a direct toxic effect from IL exposure for 2 weeks.103 Histopathological findings for each IL can be found in Appendix E.
103. Everds NE, Snyder PW, Bailey KL, Bolon B, Creasy DM, Foley GL, Rosol TJ, Sellers T. Interpreting stress responses during routine toxicity studies: A review of the biology, impact, and assessment. Toxicol Pathol. 2013; 41(4):560-614. DOI: 10.1177/0192623312466452 PubMed: 23475558
Exposure Concentration Selection Rationale for the Three-month Studies
Lower mean body weights and water consumption compared to control animals were the two primary toxicity parameters that guided exposure concentration selection for the 3-month IL studies. Rats appeared to be more sensitive to IL exposure in drinking water (i.e., lower water consumption and mean body weights), which was also taken into consideration for exposure concentration selection. In general, the top exposure concentrations selected for the 3-month studies demonstrated mean body weights within 10% of control animals and mean water consumption rates within 25% of control animals following the 2-week exposure period. The exposure concentrations selected for the 3-month studies are shown in Table 4. Exposure concentrations selected for Emim-Cl were higher than those for other ILs due to its apparently lower toxicity. Due to sex differences observed in the 2-week studies, different exposure concentrations were selected for males and females in the Bmpy-Cl studies.
Three-month Studies
Rats
1-Ethyl-3-Methylimidazolium Chloride (Emim-Cl)
Male and female rats were exposed to Emim-Cl at concentrations of 0, 1, 3, or 10 mg/mL in drinking water. All rats survived to the end of the 3-month exposure period (Table 7), and no clinical observations related to Emim-Cl exposure were noted (Appendix E). Male and female mean body weights of all exposed groups remained within 10% of the mean body weights of the control groups throughout the course of study and were not significantly different at the end of the 3-month exposure period (Table 7; Figure 1; Appendix E).
Water consumption by male and female rats exposed to 3 or 10 mg/mL Emim-Cl was lower than that of control animals (Table 8). At 1 mg/mL, the mean water consumption was within 10% of the control groups for both males and females. At 3 mg/mL, mean water consumption ranged from 85% to 94% of the control group in males and from 78% to 89% of the control group in females (Appendix E). At the highest exposure concentration of 10 mg/mL, mean water consumption ranged from 71% to 83% of the control group in males and from 59% to 69% of the control group in females. Drinking water concentrations of 1, 3, and 10 mg/mL resulted in estimated average doses of 88, 237, and 668 mg Emim-Cl/kg body weight/day (mg/kg/day) for males and 104, 258, and 691 mg/kg/day for females.
While terminal mean body weights of Emim-Cl-exposed rats were similar to those of control animals, a few organ weight differences were observed in both males and females (Appendix E). The only significant change was in females, wherein the relative right kidney weights were slightly increased in the 3 and 10 mg/mL groups compared to those of control animals (Table 9; Appendix E).
No changes in rat clinical chemistry parameters were attributable to Emim-Cl exposure (Appendix E). For hematology parameters measured at the end of the 3-month exposure period, significant decreases in the female white blood cell count and differential (i.e., leukocyte counts) were observed relative to control rats (Appendix E). The female control group leukocyte counts for the Emim-Cl study were higher than the control group leukocyte counts for the other three ILs, however, this can be explained by the inherently and relatively high inter- and intra-animal variability of baseline leukocyte counts. In addition, the Emim-Cl leukocyte changes were not observed in mice or male rats, and no histopathological changes were observed in the bone marrow or spleen. Although the decreases in leukocyte counts compared to the control rats appear at first to be exposure-related, they are probably due to biological variability among observed animals. No exposure-related changes were observed in the hematological parameters of male rats.
Estrous cycle length, number of cycles, and percentage of time spent in each respective stage of estrous were not affected by Emim-Cl exposure. Assessment of the lengths of diestrus, proestrus, and estrus using the continuous-time Markov model did not reveal any Emim-Cl-related differences in modeled stage lengths (Appendix E).
No exposure-related gross or histopathological changes were observed in male or female rats exposed to Emim-Cl (Appendix E).
1-Butyl-3-Methylimidazolium Chloride (Bmim-Cl)
Male and female rats were exposed to Bmim-Cl at concentrations of 0, 0.1, 0.3, or 1 mg/mL in drinking water. All rats survived to the end of the 3-month exposure period (Table 10), and no exposure-related clinical observations were noted (Appendix E). Mean body weights of male and female exposed groups remained within 10% of the mean body weights of the control groups throughout the study and were not significantly different at the end of the 3-month exposure period (Table 10; Figure 2; Appendix E).
At the highest Bmim-Cl exposure concentration (1 mg/mL), water consumption was 74%–86% (males) or 75%–87% (females) of the amount consumed by control groups over the course of the study (Table 11; Appendix E). Water consumption was not reduced to this extent in the low (0.1 mg/mL) or moderate (0.3 mg/mL) exposed groups. Drinking water concentrations of 0.1, 0.3, and 1 mg/mL resulted in estimated average doses of 9, 24, and 70 mg/kg/day for males and 11, 31, and 79 mg/kg/day for females, respectively.
Although terminal mean body weights of Bmim-Cl-exposed rats were similar to those of control animals, two significant organ weight changes were observed. Absolute heart weights of males exposed to 1 mg/mL were significantly decreased (by 8%) compared to those of control rats (Table 12). Absolute lung weights of females exposed to 1 mg/mL were significantly decreased (by 15%) compared to those of control rats.
No changes in rat clinical chemistry parameters were attributable to Bmim-Cl exposure (Appendix E). At the end of the 3-month exposure period, there were mild (≤5%) but significant decreases, relative to control rats, in hematocrit, erythrocyte count, and hemoglobin concentrations in female rats exposed to 1 mg/mL (Table 13). Although there were no mean body weight changes observed, these changes in hematological parameters may have indicated a mild suppression in erythropoiesis due to chronic stress of exposure103; however, a mild direct effect due to exposure cannot be definitively ruled out. There were no exposure-related changes in the hematological parameters of the male rats (Appendix E).
103. Everds NE, Snyder PW, Bailey KL, Bolon B, Creasy DM, Foley GL, Rosol TJ, Sellers T. Interpreting stress responses during routine toxicity studies: A review of the biology, impact, and assessment. Toxicol Pathol. 2013; 41(4):560-614. DOI: 10.1177/0192623312466452 PubMed: 23475558
Estrous cycle length, number of cycles, and percentage of time spent in each respective stage of estrous were not affected by Bmim-Cl exposure. Assessment of the lengths of diestrus, proestrus, and estrus using the continuous-time Markov model did not reveal any Bmim-Cl-related differences in modeled stage lengths (Appendix E).
No exposure-related gross or histopathological changes were observed in male or female rats exposed to Bmim-Cl (Appendix E).
1-Butyl-1-Methylpyrrolidinium Chloride (Bmpy-Cl)
Male and female rats were exposed to different concentrations of Bmpy-Cl in drinking water due to sex differences observed in the 2-week studies. Male rats were exposed to 0, 0.3, 1, or 3 mg/mL Bmpy-Cl, and female rats were exposed to 0, 1, 3, or 6 mg/mL Bmpy-Cl. All rats survived to the end of the 3-month exposure period (Table 14) and no exposure-related clinical observations were noted (Appendix E). Mean body weights of male rats were within 10% of the control group mean body weights throughout the study, although a 7% decrease in the terminal mean body weight of the 3 mg/mL group was significantly different from the control group (Table 14; Figure 3; Appendix E). Mean body weights of female rats in the 6 mg/mL group were consistently lower than those of control rats throughout the study, and the terminal mean body weight was significantly decreased (12%) relative to the control group. In females exposed to 1 or 3 mg/mL, mean body weights were similar to control animal values throughout the study.
In general, water consumption by both male and female rats exposed to Bmpy-Cl decreased in an exposure concentration-dependent manner. At any given concentration, however, female rats consumed less water than male rats. Water consumption by male rats exposed to 3 mg/mL Bmpy-Cl, was 75%–85% of control animals (Table 15), whereas water consumption by female rats exposed to 3 mg/mL was 68%–76% of control animals. In female rats exposed to 6 mg/mL, water consumption was reduced even further to 26%–63% of consumption by control animals. The lowest water consumption value of 26% by females was observed during week 1 of the study and was potentially due to the poor palatability of the dose formulation. Drinking water concentrations of 0.3, 1, and 3 mg/mL resulted in estimated average doses of 26, 74, and 201 mg/kg/day, respectively, for males, and drinking water concentrations of 1, 3, and 6 mg/mL resulted in estimated average doses of 89, 222, and 376 mg/kg/day, respectively, for females.
Significant organ weight changes were observed only in female rats exposed to Bmpy-Cl (Table 16; Appendix E). In female rats exposed to 6 mg/mL, which had significant terminal mean body weight decreases, absolute mean liver weights were significantly decreased by 20% compared to control rats. Relative mean liver weights were also significantly decreased in this group. Furthermore, relative right kidney and heart weights were significantly increased in the 6 mg/mL females compared to control rats; however, these changes were considered secondary effects of decreased body weight and/or water consumption (Appendix E). Despite not experiencing significant decreases in body weights, female rats in the 1 and 3 mg/mL groups had significant decreases in relative liver weights (Table 16).
No changes in rat hematology parameters were attributable to Bmpy-Cl exposure. Female rats in the 6 mg/mL group had a significant decrease in alanine aminotransferase activity compared to control rats (Appendix E). Given that the decrease was mild, only present in the highest exposed group, and not observed in male rats, these changes were considered related to biological variability rather than Bmpy-Cl exposure.
Estrous cycle length, number of cycles, and percentage of time spent in each respective stage of estrous were not affected by Bmpy-Cl exposure. Assessment of the lengths of diestrus, proestrus, and estrus using the continuous-time Markov model did not reveal any Bmpy-Cl-related differences in modeled stage lengths. Four females exposed to 6 mg/mL were not cycling, which likely resulted from nonspecific stress, as indicated by the consistently lower mean body weights of these rats compared to control rats (Table 14; Figure 3; Appendix E).
No exposure-related gross or histopathological changes were observed in male or female rats exposed to Bmpy-Cl (Appendix E).
N-Butylpyridinium Chloride (NBuPy-Cl)
Male and female rats were exposed to NBuPy-Cl at concentrations of 0, 0.3, 1, or 3 mg/mL in drinking water. Apart from one death (considered unrelated to exposure) of a male rat exposed to 3 mg/mL on study day 6, all rats survived to the end of the 3-month exposure period (Table 17). No exposure-related clinical observations were noted (Appendix E). Although most body weight changes during the study were within 10% of control animals, significantly decreased terminal mean body weights (approximately 89%–95% of control animals) were noted in the 1 mg/mL NBuPy-Cl-exposed male rats and the 3 mg/mL NBuPy-Cl-exposed male and female rats (Table 17; Figure 4; Appendix E). These were interpreted as lower body weight gain, as opposed to body weight loss, during the exposure period.
Water consumption was lower relative to control groups for males exposed to ≥0.3 mg/mL NBuPy-Cl or females exposed to ≥1 mg/mL and decreased with increasing exposure concentration (Table 18). At the highest exposure concentration of 3 mg/mL, water consumption by male rats was 47%–69% of the control group (Appendix E). Female rats exposed to the highest exposure concentration of 3 mg/mL had mean water consumption ranging from 47% to 63% of the control group (Table 18). The lowest water consumption value of 47% of the control group for both males and females exposed to 3 mg/mL was observed on week 1 of the study and was potentially due to the formulation’s poor palatability. Drinking water concentrations of 0.3, 1, and 3 mg/mL resulted in estimated average doses of 23, 73, and 171 mg/kg/day, respectively, for males and 30, 83, and 184 mg/kg/day, respectively, for females.
Significant organ weight changes were observed in male and female rats exposed to NBuPy-Cl, but all changes were considered secondary effects of decreased body weight and/or water consumption (Appendix E). Alongside a significant decrease in terminal mean body weight, male rats in the 3 mg/mL group had significantly increased relative heart, right kidney, and liver weights. Females in the 3 mg/mL group similarly had a significant decrease in terminal mean body weight accompanied by significantly increased relative heart and right kidney weights. These females also had significantly decreased absolute liver weights. Males in the 1 mg/mL group had a smaller (approximately 5%) significant decrease in terminal mean body weight accompanied by significantly increased relative right kidney and liver weights. Males in the 0.3 mg/mL group, which did not have a significantly different terminal mean body weight, had significantly increased relative right kidney weights. This change was very small, however, and was not considered toxicologically relevant.
At the end of the 3-month exposure period, the 1 and 3 mg/mL male rats had a significant increase in urea nitrogen concentration (Appendix E). This increase was mild and not observed in females; therefore, the change was considered unrelated to NBuPy-Cl exposure and might have indicated mild dehydration due to lower water consumption. There were no changes in rat hematology parameters attributable to NBuPy-Cl administration in drinking water (Appendix E).
Estrous cycle length, number of cycles, and percentage of time spent in each respective stage of estrous were not affected by NBuPy-Cl exposure. Assessment of the lengths of diestrus, proestrus, and estrus using the continuous-time Markov model did not reveal any NBuPy-Cl-related differences in modeled stage lengths (Appendix E).
No exposure-related gross or histopathological changes were observed in male or female rats exposed to NBuPy-Cl (Appendix E).
Mice
1-Ethyl-3-Methylimidazolium Chloride (Emim-Cl)
Male and female mice were exposed to Emim-Cl at concentrations of 0, 3, 10, and 30 mg/mL in drinking water. All mice survived to the end of the 3-month exposure period (Table 19), and no exposure-related clinical observations were noted (Appendix E). Male mice exposed to 10 mg/mL and both male and female mice exposed to 30 mg/mL had significantly decreased terminal mean body weights, relative to control mice, which was interpreted as lower weight gain over the course of the study (Table 19; Figure 5; Appendix E). At the 30 mg/mL exposure concentration, male and female terminal mean body weights were 71% and 79%, respectively, of the control groups. At 10 mg/mL exposure concentration, male terminal body weights were 93% of the control group. Male and female mice exposed to 3 mg/mL and female mice exposed to 10 mg/mL maintained mean body weights within 10% of the control groups, and these differences were not significant (Appendix E).
In general, water consumption decreased in an exposure concentration-dependent manner for both male and female mice exposed to Emim-Cl (Table 20; Appendix E). In the highest exposed group (30 mg/mL), mean water consumption ranged from 44% to 66% of control animals for males and from 43% to 87% of control animals for females. Drinking water concentrations of 3, 10, and 30 mg/mL resulted in estimated average doses of 341, 1,039, and 2,283 mg/kg/day, respectively, for males and 383, 1,198, and 2,457 mg/kg/day, respectively, for females.
Terminal mean body weights of mice exposed to Emim-Cl were significantly decreased at the highest exposure concentration of 30 mg/mL (Appendix E). Accordingly, significant organ weight changes were observed for both male and female mice exposed to 30 mg/mL; however, these were considered secondary effects of decreased body weight and/or water consumption (Appendix E). Males exposed to 30 mg/mL had significantly decreased absolute right kidney and liver weights (by 19% and 23%, respectively) compared to the control group. These males also had significantly increased relative heart, right kidney, liver, lung, and right testis weights. Females exposed to 30 mg/mL had significantly decreased absolute heart and liver weights (by 13% and 20%, respectively), as well as significantly increased relative right kidney weights, compared to control animals. Males in the 10 mg/mL group had a smaller (7%) significant decrease in terminal mean body weights compared to control animals, accompanied by a significant increase in relative right testis weight. Again, this organ weight change was considered a secondary effect of decreased body weight and/or water consumption.
At the end of the 3-month exposure period, there was a mild increase in the erythron of the 30 mg/mL male mice (Table 21). These changes included significant increases in the manual hematocrit, erythrocyte count, and reticulocyte count compared to control animals and were consistent with mild hemoconcentration due to lower water consumption. Similarly, a significant increase in erythrocyte counts and reticulocyte counts were observed in the 30 mg/mL female mice.
Emim-Cl exposure in female mice did not affect estrous cycle length, number of cycles, and percentage of time spent in each respective stage of estrous. Assessment of the lengths of diestrus, proestrus, and estrus using the continuous-time Markov model did not reveal any Emim-Cl-related differences in modeled stage lengths (Appendix E).
Limited histopathological changes were observed in male and female mice exposed to Emim-Cl (Table 22). There were significant increases in the incidences of chronic progressive nephropathy and renal tubule cytoplasmic alteration in males exposed to 30 mg/mL relative to the control group. There was also a positive trend in the incidences of renal infarct in male mice. Similar histological findings were not observed in the kidneys of female mice. However, there was a significant increase in the incidence of adrenal cortex persistent X-zone in females exposed to 30 mg/mL compared to the control group. The morphological features of the lesions discussed in this section are presented in the Histopathological Descriptions of Mice section.
1-Butyl-3-Methylimidazolium Chloride (Bmim-Cl)
Male and female mice were exposed to Bmim-Cl at concentrations of 0, 0.3, 1, and 3 mg/mL in drinking water. All mice survived to the end of the 3-month exposure period (Table 23) and no exposure-related clinical observations were noted (Appendix E). Male mice exposed to 3 mg/mL had a significantly decreased terminal mean body weight (77% of the control group), which was interpreted as lower weight gain over the course of the study (Table 23; Figure 6; Appendix E). Female terminal mean body weight at this exposure concentration was significantly decreased at 91% of the control group. Mice exposed to 0.3 or 1 mg/mL maintained body weights within 10% of the control groups.
In general, water consumption decreased in an exposure concentration-dependent manner for both male and female mice exposed to Bmim-Cl (Table 24; Appendix E). At the highest exposure concentration of 3 mg/mL, water consumption by male mice was 56%–77% of the control group. In female mice exposed to 3 mg/mL, water consumption was 47%–69% of the control group. Drinking water concentrations of 0.3, 1, and 3 mg/mL resulted in estimated average doses of 37, 116, and 262 mg/kg/day, respectively, for males and 39, 125, and 270 mg/kg/day, respectively, for females.
Terminal mean body weight was significantly decreased in mice exposed to 3 mg/mL Bmim-Cl (Appendix E). Significant organ weight changes, considered secondary effects of decreased body weight and/or water consumption, were observed for both male and female mice exposed to this concentration. In males, absolute right kidney and liver weights were significantly decreased compared to the control group. Relative heart, right kidney, liver, lung, and right testis weights were significantly increased compared to the control group. Absolute lung weights were also significantly decreased in 3 mg/mL females compared to the control group. Additionally, relative heart and right kidney weights were significantly increased in 3 mg/mL females.
No changes in mice hematology parameters were attributable to Bmim-Cl exposure (Appendix E).
Estrous cycle length, number of cycles, and percentage of time spent in each respective stage of estrous were not affected by Bmim-Cl exposure. Assessment of the lengths of diestrus, proestrus, and estrus using the continuous-time Markov model did not reveal any Bmim-Cl-related differences in modeled stage lengths (Appendix E).
Limited histopathological changes were observed in male and female mice exposed to Bmim-Cl (Table 25). In the kidney, there was a positive trend in the incidences of chronic progressive nephropathy in both male and female mice. Additionally, a significant increase in the incidence of adrenal gland persistent X-zone was observed in females exposed to 3 mg/mL relative to the control group. The morphological features of the lesions discussed in this section are presented in the Histopathological Descriptions of Mice section.
1-Butyl-1-Methylpyrrolidinium Chloride (Bmpy-Cl)
Male and female mice were exposed to different concentrations of Bmpy-Cl. Male mice were exposed to 0, 1, 3, or 10 mg/mL, and females were exposed to 0, 1, 3, or 6 mg/mL in drinking water. All mice survived to the end of the 3-month exposure period (Table 26), and no exposure-related clinical observations were noted (Appendix E). Only male mice exposed to 10 mg/mL had a significantly decreased terminal mean body weight compared to the control group; this finding was interpreted as lower weight gain throughout the study (Table 26; Figure 7; Appendix E). At the end of the study, the mean body weight of male mice exposed to 10 mg/mL was 84% of the control group. The terminal mean body weight of female mice exposed to 6 mg/mL was 94% of the control group.
Water consumption by male and female mice exposed to Bmpy-Cl at the highest exposure concentrations of 10 mg/mL and 6 mg/mL, respectively, was lower than that of the control groups (Table 27). Mean water consumption ranged from 61% to 81% of the control group for males and from 81% to 97% of the control group for females (Appendix E). Drinking water concentrations of 1, 3, and 10 mg/mL resulted in estimated average doses of 123, 364, and 942 mg/kg/day for males, respectively. For females, drinking water concentrations of 1, 3, and 6 mg/mL resulted in estimated average doses of 130, 403, and 696 mg/kg/day, respectively.
Absolute organ weights were not significantly altered in males or females exposed to Bmpy-Cl (Table 28; Appendix E); however, there were several significantly increased relative organ weights, primarily in animals exposed at the highest concentrations. Males exposed to 10 mg/mL had significantly increased relative right kidney, lung, right testis, and thymus weights compared to control animals. Because male mice exposed to 10 mg/mL also had significantly decreased terminal mean body weight, these changes were considered secondary effects of decreased body weight and/or water consumption. Males exposed to 10 mg/mL Bmpy-Cl also had significantly increased relative liver weights. This significant increase in relative liver weights was additionally observed in male mice exposed to 1 or 3 mg/mL Bmpy-Cl, despite their terminal mean body weights remaining similar to those of the control group. In females, the only significant difference observed was in relative right kidney weights, which increased in the 6 mg/mL group compared to the control group (Table 28).
At the end of the 3-month exposure period, there were positive trends and significant but minimal (<3%) increases in the male mice hematocrit and erythrocyte count in the 3 mg/mL and/or 10 mg/mL groups compared to the control group (Appendix E). While these changes may represent mild hemoconcentration due to lower water consumption, they were small in magnitude and might have resulted from biological variability.
Estrous cycle length and number of cycles were not affected by Bmpy-Cl exposure (Appendix E). The 1 mg/mL group displayed a greater percentage of time spent in estrus, and the continuous-time Markov model comparison of estrus stage length attained significance and was increased by 0.6 days. Inspection of the daily cyclicity observations revealed five control mice that displayed apparently longer cycles, resulting in fewer observations of estrus and metestrus. Although this response is common in control mice, five is a higher frequency than typically observed in a group size of 10; a frequency of two or three is more common, as observed in the 3 and 6 mg/mL groups. In contrast, all mice in the 1 mg/mL group displayed prototypical cycling. Given this finding, the apparent response in the 1 mg/mL group is considered spurious and not the result of Bmpy-Cl exposure.
Limited histopathological changes were observed in male and female mice exposed to Bmpy-Cl (Table 29). In the kidney, a significant increase in the incidence of renal tubule cytoplasmic alteration was found in males exposed to 10 mg/mL compared to the control group. In the adrenal gland of female mice, significant increases in the incidences of adrenal cortex persistent X-zone were found in the 3 and 6 mg/mL groups compared to the control group. The morphological features of the lesions discussed in this section are presented in the Histopathological Descriptions of Mice section.
N-Butylpyridinium Chloride (NBuPy-Cl)
Male and female mice were exposed to NBuPy-Cl at concentrations of 0, 1, 3, or 6 mg/mL in drinking water. All mice survived to the end of the 3-month exposure period (Table 30), and no exposure-related clinical observations were noted (Appendix E). Decreases in terminal mean body weights, interpreted as lower weight gain over the course of the study, were noted for male and female mice (Table 30; Figure 8; Appendix E). Terminal mean body weights were 98%, 94%, and 72% of control males for the 1, 3, and 6 mg/mL groups, respectively. Females in the same exposed groups had terminal mean body weights that were 95%, 91%, and 83%, respectively, of the control group. These changes were significant in the 3 mg/mL NBuPy-Cl-exposed females and the 6 mg/mL NBuPy-Cl-exposed males and females.
In general, water consumption decreased in an exposure concentration-dependent manner for both male and female mice exposed to NBuPy-Cl (Table 31; Appendix E). In the highest exposed groups (6 mg/mL), water consumption by male mice ranged from 49% to 65% of control males, and water consumption by female mice ranged from 46% to 63% of control females. Drinking water concentrations of 1, 3, and 6 mg/mL resulted in estimated average doses of 118, 310, and 483 mg/kg/day, respectively, for males and 125, 331, and 518 mg/kg/day, respectively, for females.
Various significant organ weight changes were observed for both male and female mice exposed to NBuPy-Cl (Table 32; Appendix E). Male mice exposed to 6 mg/mL had a significantly decreased terminal mean body weight compared to the control group, accompanied by significantly decreased absolute right kidney, liver, lung, and thymus weights and significantly increased relative right kidney, liver, and right testis weights. Female mice exposed to 6 mg/mL had a significantly decreased terminal mean body weight compared to the control group, accompanied by significantly decreased absolute lung weights and significantly increased relative heart, right kidney, and liver weights. Female mice exposed to 3 mg/mL also had a significantly decreased terminal mean body weight and significantly increased relative heart and right kidney weights. All these organ weight changes were considered secondary effects of decreased body weight and/or water consumption (Appendix E). In contrast, male mice exposed to 3 mg/mL did not have a significantly decreased terminal mean body weight but did have significantly increased relative right kidney and liver weights compared to the control group (Table 32).
At the end of the 3-month exposure period, neutrophil counts in male mice exposed to 3 or 6 mg/mL were significantly decreased relative to the control group (Appendix E). Given that these changes were small in magnitude and not observed in the rats or female mice, the toxicological significance of the decreased neutrophil counts in the male mice is unknown. No hematological effects were observed in female mice.
Estrous cycle length, number of cycles, and percentage of time spent in each respective stage of estrous were not affected by NBuPy-Cl exposure. Assessment of the lengths of diestrus, proestrus, and estrus using the continuous-time Markov model did not reveal any NBuPy-Cl-related differences in modeled stage lengths (Appendix E).
Limited histopathological changes were observed in male and female mice exposed to NBuPy-Cl (Table 33). Significant increases in the incidences of chronic progressive nephropathy and renal tubule cytoplasmic alteration were observed in the kidneys of male mice exposed to 6 mg/mL compared to the control group. There was also a positive trend in the incidence of chronic progressive nephropathy in female mice. In the adrenal gland of female mice, there was a significant increase in the incidence of adrenal cortex persistent X-zone at 6 mg/mL compared to the control group. The morphological features of the lesions discussed in this section are presented in the Histopathological Descriptions of Mice section.
Histopathological Descriptions of Mice
In general, the histopathological changes, when present in the kidney and adrenal gland, were morphologically similar across studies.
Kidney: Chronic progressive nephropathy (CPN) was generally characterized by minimal focal to multifocal cytoplasmic basophilia and nuclear crowding of the proximal and distal tubular epithelium (Figure 9). The tubular basophilia is evidence of cellular regeneration. CPN has been more extensively studied in rats than in mice; its incidence and/or severity is influenced by a variety of factors, such as hormones, caloric intake, protein content of diet, and some xenobiotics.104
104. Frazier KS, Seely JC, Hard GC, Betton G, Burnett R, Nakatsuji S, Nishikawa A, Durchfeld-Meyer B, Bube A. Proliferative and nonproliferative lesions of the rat and mouse urinary system. Toxicol Pathol. 2012; 40(4 Suppl):14s-86s. DOI: 10.1177/0192623312438736 PubMed: 22637735
Renal tubule cytoplasmic alteration was generally characterized by a reduction in the renal tubule cytoplasmic vacuolization normally seen in the outer cortical tubules of male mice (Figure 10). The presence of cytoplasmic vacuoles is a sexually dimorphic lesion, occurring only in males, and is thought to represent autophagic vacuoles associated with the normal degeneration of renal tubular epithelial cells.105
105. Ormos J, Sztriha L, Bóti ZS, Kuthy E. Electron microscopic and cytochemical study of the vacuoles of regenerating renal tubular cells. Br J Exp Pathol. 1975; 56(5):477-483. PubMed: 1212429
Adrenal gland: Adrenal cortex persistent X-zone was characterized by reduced numbers or the absence of X-zone cells undergoing vacuolar degeneration (Figure 11). The X-zone is a transient region in young mice at the cortical-medullary boundary of the adrenal gland, appearing a few days after birth in both sexes. The cells in the X-zone are darker and smaller, and the cytoplasm is more basophilic than those in the zona fasciculata. The function of the X-zone is not known, but during development, these fetal cortical cells are gradually replaced by newly formed adult cortical cells that develop into outer definitive zones. In the male mouse, this zone disappears rapidly with the approach of puberty (approximately 5 weeks of age) due to androgen signaling via the androgen receptor.106 In female virgins, the X-zone continues to grow in size until about 9 weeks of age and then regresses gradually.
106. Gannon A-L, O’Hara L, Mason JI, Jørgensen A, Frederiksen H, Milne L, Smith S, Mitchell RT, Smith LB. Androgen receptor signalling in the male adrenal facilitates X-zone regression, cell turnover and protects against adrenal degeneration during ageing. Sci Rep. 2019; 9(1):10457. DOI: 10.1038/s41598-019-46049-3 PubMed: 31320667
Genetic Toxicology
All four ILs were tested for induction of gene mutations in three strains of bacteria (Salmonella typhimurium strains TA98 and TA100, and Escherichia coli strain WP2 uvrA [pKM101]), as well as induction of structural or numerical chromosomal damage in the rodent peripheral blood erythrocyte micronucleus (MN) assay using samples collected from the 3-month study in rats and mice. Data from all NTP genetic toxicity tests with Emim-Cl, Bmim-Cl, Bmpy-Cl, and NBuPy-Cl are presented in Appendix D.
None of the four ILs induced mutations in the three strains of bacteria in studies conducted with and without induced rat liver S9 mix at doses up to 10,000 μg/plate.
Results of the MN assay were somewhat variable across the four ILs. Emim-Cl did not increase the frequency of micronucleated erythrocytes in male or female rats or in male mice. In female mice, the MN assay response was also judged to be negative, although a small, significant increase was observed in micronucleated mature erythrocytes; this response was not considered of sufficient magnitude to be biologically relevant and was well within the laboratory historical control 95% confidence interval for female B6C3F1 mice.
No increases in micronucleated erythrocytes were seen in blood samples from Bmim-Cl-exposed rats and mice.
For Bmpy-Cl-exposed animals, a clearly positive response was seen in the immature erythrocyte population in male rat peripheral blood samples (the appropriate cell population used to assess MN in rats). Results were negative for female rats as well as male and female mice.
The response in NBuPy-Cl-exposed male rats was judged to be equivocal. Although there was a significant increase in micronucleated mature erythrocytes, the results for immature erythrocytes were negative. Because this response pattern is in direct contrast to what would be expected in rats for a truly positive compound, the increases observed were within the laboratory 95% confidence interval for male rats, and there is no biological explanation for the observation (such as altered spleen function) in these rats, the response was judged to be equivocal. No differences in MN frequencies were observed in female rats or male and female mice for either cell population.
Discussion
Since their nomination to the National Toxicology Program (NTP), the use of ionic liquids (ILs) in commercial processes and consumer products has expanded. ILs are finding their way into many households through electronics, batteries, perfumes, haircare products, pharmaceuticals, and antimicrobial cleaning agents as the movement for more “green” and “natural” consumer products gains momentum.3,39,40,107,108 Occupational exposure is also increasing as ILs are used to replace volatile organic compounds in many new and existing industrial applications.2,5 Despite the potential for increased human exposure, limited mammalian toxicity data are available for this class of chemicals. To address this data gap, NTP evaluated the in vivo toxicity of four ILs—1-ethyl-3-methylimidazolium chloride (Emim-Cl), 1-butyl-3-methylimidazolium chloride (Bmim-Cl), 1-butyl-1-methylpyrrolidinium chloride (Bmpy-Cl), and n-butylpyridinium chloride (NBuPy-Cl) —in 2-week and 3-month drinking water studies in rats and mice. These studies facilitate comparison of toxicity among the three most common cations used in ILs (imidazolium, pyrrolidinium, and pyridinium) and among differing alkyl side chain lengths.
3. Miskiewicz A, Ceranowicz P, Szymczak M, Bartuś K, Kowalczyk P. The use of liquids ionic fluids as pharmaceutically active substances helpful in combating nosocomial infections induced by Klebsiella Pneumoniae New Delhi strain, Acinetobacter Baumannii and Enterococcus species. Int J Mol Sci. 2018; 19(9). DOI: 10.3390/ijms19092779 PubMed: 30223584
39. Kohli R. Applications of ionic liquids in removal of surface contaminants. In: Kohli R, Mittal KL, editors. Developments in Surface Contamination and Cleaning: Applications of Cleaning Techniques. Elsevier; 2019. p. 619-680. DOI: 10.1016/B978-0-12-815577-6.00016-5
40. Berton P, Bica K, Rogers RD. Ionic liquids for consumer products: Dissolution, characterization, and controlled release of fragrance compositions. Fluid Phase Equilib. 2017; 450:51-56. DOI: 10.1016/j.fluid.2017.07.011
107. Davey P. Ionic liquids in consumer products: The possible uses for ionic liquids in fragrances and household products. 2008. https://media.allured.com/documents/PF_33_04_034_02.pdf
108. Agatemor C, Ibsen KN, Tanner EEL, Mitragotri S. Ionic liquids for addressing unmet needs in healthcare. Bioeng Transl Med. 2018; 3(1):7-25. DOI: 10.1002/btm2.10083 PubMed: 29376130
2. Rogers RD, Seddon KR. Chemistry. Ionic liquids—solvents of the future? Science. 2003; 302(5646):792-793. DOI: 10.1126/science.1090313 PubMed: 14593156
5. Heckenbach ME, Romero FN, Green MD, Halden RU. Meta-analysis of ionic liquid literature and toxicology. Chemosphere. 2016; 150:266-274. DOI: 10.1016/j.chemosphere.2016.02.029 PubMed: 26907595
In the 2-week studies, rats and mice were exposed to various concentrations of Emim-Cl, Bmim-Cl, Bmpy-Cl, or NBuPy-Cl in drinking water. This oral exposure route was used to simulate exposure to ILs through contamination of public water supplies.109,110 All animals survived until the end of the 2-week exposure period. Notably, for each of the four ILs, lower mean body weights of exposed animals were directly related to lower water consumption, which in turn was related to the concentration of the IL tested. Furthermore, clinical findings, including thinness and ruffled fur, were considered related to lower body weight rather than direct toxicity. At an equivalent exposure concentration (3 mg/mL), Bmim-Cl-exposed male and female rats exhibited the lowest water consumption and terminal mean body weights compared to the control groups, followed by rats exposed to NBuPy-Cl, Bmpy-Cl, and then Emim-Cl. Water consumption by, and terminal mean body weights of, male and female mice at 3 mg/mL followed a similar pattern. Thus, lower terminal mean body weights of IL-exposed rats and mice were possibly related to poor palatability of the ILs, resulting in lower water consumption.
109. Oskarsson A, Wright MC. Ionic liquids: New emerging pollutants, aimilarities with perfluorinated alkyl substances (PFASs). Environ Sci Technol. 2019; 53(18):10539-10541. DOI: 10.1021/acs.est.9b04778 PubMed: 31442027
110. Romero A, Santos A, Tojo J, Rodríguez A. Toxicity and biodegradability of imidazolium ionic liquids. J Hazard Mater. 2008; 151(1):268-273. DOI: 10.1016/j.jhazmat.2007.10.079 PubMed: 18063302
While estimated chemical intake increased as IL concentrations in drinking water increased, chemical intake did not increase in direct proportion to exposure concentration because of the lower water consumption at higher IL concentrations. Although feed consumption was not measured, previous research suggests that poor palatability of a compound in drinking water can negatively affect both water and feed consumption, thereby reducing body weight gain.111 Under these circumstances, it is difficult to determine whether lower terminal mean body weights resulted primarily from IL-induced toxicity or were secondary to dehydration or poor appetite. Other endpoints observed across all ILs at the highest exposure concentrations, such as organ weight changes, similarly appear to reflect lower mean body weights and potentially decreased nutritional and caloric intake. Body weight and water consumption results from the 2-week range-finding study enabled selection of exposure concentrations for the 3-month drinking water studies in rats and mice.
111. Claassen V. Food and water intake.Techniques in the Behavioral and Neural Sciences Neglected Factors in Pharmacology and Neuroscience Research: Biophamaceutics, Animal Characteristics Maintenance, Testing Conditions. Elsevier; 1994. p. 267-287.
As a guideline toxicity study, the 3-month exposure studies assessed specific endpoints of toxicity, namely: mortality, body weights, water consumption, organ weights, clinical chemistry, hematology, vaginal cytology, histopathology, and genotoxicity. There were no significant toxicological effects of IL exposure on mortality, clinical chemistry, hematology, vaginal cytology, or genotoxicity; details on these data are presented in the results, Appendix D, and Appendix E. Endpoints significantly affected by IL exposure (body weights, water consumption, organ weights, and histopathology) are further discussed below.
Exposure of rats and mice to Emim-Cl, Bmim-Cl, Bmpy-Cl, or NBuPy-Cl for 3 months resulted in an overarching pattern of lower mean body weights and water consumption similar to the 2-week studies. In general, water consumption by both rats and mice exposed to ILs for 3 months was lower than water consumption by control animals. Often, this observation was exposure concentration-dependent, with rats consuming on average 54%–80% of the control groups’ water consumption at the highest IL exposure concentrations (10 mg/mL Emim-Cl, 1 mg/mL Bmim-Cl, 3 mg/mL Bmpy-Cl in males, 6 mg/mL Bmpy-Cl in females, 3 mg/mL NBuPy-Cl) and mice consuming 56%–87% of the control groups’ water consumption at the highest IL exposure concentrations (30 mg/mL Emim-Cl, 3 mg/mL Bmim-Cl, 10 mg/mL Bmpy-Cl in males, 6 mg/mL Bmpy-Cl in females, 6 mg/mL NBuPy-Cl). Despite both species consuming less water with increased IL exposure concentrations, body weight changes were more variable and did not always decrease as IL exposure concentration increased. These body weight changes were potentially related to the ingested dose. Estimated compound consumption was increased at higher exposure concentrations but not always in direct proportion to the exposure concentration because of decreased water consumption. Estimated compound consumption values show that mice received a higher dose of ILs than rats; for example, rats exposed to 3 mg/mL Emim-Cl, Bmpy-Cl, or NBuPy-Cl consumed an estimated average of 171–258 mg/kg/day, whereas mice exposed to 3 mg/mL of these ILs consumed an estimated average of 310–403 mg/kg/day. For each of these exposed groups, males consumed an estimated 6%–11% less compound than females.
Changes in organ weights were observed at the highest exposure concentration of most ILs for rats and mice. These changes followed the pattern of lower body weights with higher IL exposure, which coincided with lower water consumption. In a few instances, in which absolute organ weight decreases were observed, these findings were not accompanied by histological changes in rats or mice; thus, their toxicological significance is not clear.
Histopathological results showed species- and sex-specific responses to the highest exposure concentrations of ILs. Neither male nor female rats exposed to Emim-Cl, Bmim-Cl, Bmpy-Cl, or NBuPy-Cl displayed any significant histopathological findings. Mice, however, had lesions in the kidney and adrenal gland (discussed in detail below). It is unclear whether this species-specific difference resulted from higher internal doses in mice compared to rats at the same exposure concentration, or higher sensitivity of mice tissues to ILs. Interestingly, the lesions all suggest steroid, potentially androgen, perturbation following IL exposure.
Exposure to high concentrations of ILs resulted in kidney lesions in both male and female mice. At the highest tested exposure concentrations of Emim-Cl (30 mg/mL), Bmpy-Cl (10 mg/mL), and NBuPy-Cl (6 mg/mL), male mice displayed cytoplasmic alteration in the kidney. This diagnosis is defined by a reduction in the renal tubular cytoplasmic vacuoles that are normally present in certain strains of young male mice but are uncommon in female mice or in male or female rats. The vacuoles are thought to be autophagic and involved in the sequestration and degradation of organelles associated with the normal degeneration of renal tubular epithelial cells.105,112 In male mice, these vacuoles decrease and eventually disappear as the animal ages. The accumulation of lysosomes in the outer renal tubules of male mice, seen microscopically as vacuolation, has been shown to depend on endogenous testosterone; female mice administered testosterone accumulated lysosomes, resulting in kidneys phenotypically similar to male mice.112 In the present study, there were markedly fewer vacuoles (cytoplasmic alteration) in male mice in the highest exposure concentration groups for 3 of the 4 ILs (Emim-Cl, Bmpy-Cl, and NBuPy-Cl), such that the kidneys of the male mice were phenotypically similar to the kidneys of female mice. This phenotypic observation was also true for one male mouse at the highest exposure of Bmim-Cl. This lack of testosterone-responsive vacuolation in the renal cortical tubules in male mice after exposure to all four ILs suggests a potential perturbation of androgens.
105. Ormos J, Sztriha L, Bóti ZS, Kuthy E. Electron microscopic and cytochemical study of the vacuoles of regenerating renal tubular cells. Br J Exp Pathol. 1975; 56(5):477-483. PubMed: 1212429
112. Koenig H, Goldstone A, Blume G, Lu CY. Testosterone-mediated sexual dimorphism of mitochondria and lysosomes in mouse kidney proximal tubules. Science. 1980; 209(4460):1023. DOI: 10.1126/science.7403864 PubMed: 7403864
112. Koenig H, Goldstone A, Blume G, Lu CY. Testosterone-mediated sexual dimorphism of mitochondria and lysosomes in mouse kidney proximal tubules. Science. 1980; 209(4460):1023. DOI: 10.1126/science.7403864 PubMed: 7403864
Another kidney lesion observed in IL-exposed mice was chronic progressive nephropathy (CPN). The incidences of CPN were significantly increased at the highest exposure concentration in Emim-Cl- and NBupy-Cl-exposed male mice; a positive trend was also observed in Bmim-Cl-exposed male mice as well as Bmim-Cl- and NBuPy-Cl-exposed female mice. CPN is primarily tubulointerstitial nephritis, common as a background lesion in rats, but also occurring in mice.104 The incidence and severity of CPN are generally greater in rats than in mice, and greater in males than in females.113 No evidence of exposure-related increases in the incidence or severity of CPN in rats was noted in this study; however, a higher incidence was found in male mice than in female mice. The etiology of CPN is unknown, but factors such as xenobiotic administration, genetic background, increased age, protein content of diet, and hormones can modulate its occurrence and severity.113 The presence of androgens has also been associated with the risk of developing CPN.114 In male rats, CPN severity is enhanced by the administration of testosterone and abrogated by castration.114,115 As with the cytoplasmic alteration in the kidney, the lack of sexually dimorphic enhancement of CPN severity in male rats compared to female rats in this study also suggests a perturbation of androgens.
104. Frazier KS, Seely JC, Hard GC, Betton G, Burnett R, Nakatsuji S, Nishikawa A, Durchfeld-Meyer B, Bube A. Proliferative and nonproliferative lesions of the rat and mouse urinary system. Toxicol Pathol. 2012; 40(4 Suppl):14s-86s. DOI: 10.1177/0192623312438736 PubMed: 22637735
113. Barthold SW. Chronic progressive nephropathy in aging rats. Toxicol Pathol. 1979; 7(1):1-6. DOI: 10.1177/019262337900700101
113. Barthold SW. Chronic progressive nephropathy in aging rats. Toxicol Pathol. 1979; 7(1):1-6. DOI: 10.1177/019262337900700101
114. Baylis C. Age-dependent glomerular damage in the rat. Dissociation between glomerular injury and both glomerular hypertension and hypertrophy. Male gender as a primary risk factor. J Clin Invest. 1994; 94(5):1823-1829. DOI: 10.1172/JCI117531 PubMed: 7962527
114. Baylis C. Age-dependent glomerular damage in the rat. Dissociation between glomerular injury and both glomerular hypertension and hypertrophy. Male gender as a primary risk factor. J Clin Invest. 1994; 94(5):1823-1829. DOI: 10.1172/JCI117531 PubMed: 7962527
115. Linkswiler H, Reynolds MS, Baumann CA. Factors affecting proteinuria in the rat. Am J Physiol. 1952; 168(2):504-508. DOI: 10.1152/ajplegacy.1952.168.2.504 PubMed: 14903168
Numerous female mice exposed to each of the four ILs displayed a persistent X-zone in their adrenal gland, whereas no adrenal gland lesions were observed in male mice. Mammalian adrenal glands have three morphologically distinct zones with separate functions: the outer zona glomerulosa that secretes mineralocorticoids, such as aldosterone; an intermediate zone fasciculata that secretes glucocorticoids, such as cortisol; and an inner zona reticularis that secretes adrenal androgens, mainly dehydroepiandrosterone (DHEA).116 Mice lack a functional, distinct zona reticularis and lack 17α-hydroxylase (CYP17), the key enzyme in the production of androgenic steroids, and therefore mice do not synthesize adrenal androgens.117 Instead, mice have a unique transient region, called the “X-zone,” at the junction of the cortex and medulla. The analogous structure in humans is the “fetal zone.”116,118 In mice, the X-zone appears a few days after birth and is fully developed by weaning. The cells in this region are denser and more basophilic than the cells in the adjacent zona fasciculata.119 In male mice, the X-zone disappears at approximately 5 weeks of age with the onset of puberty and does not undergo vacuolization. In female mice, the X-zone reaches its maximum size at about 9 weeks of age and then gradually regresses in virgins or rapidly at first pregnancy. During the process of regression in female mice, these cells develop lipid droplets with peculiar mitochondrial complexes and a smooth endoplasmic reticulum characteristic of steroid-secreting cells.120 There is a delay in the involution of the X-zone in prepubertal male and female mice following gonadectomy and, in female mice, hypophysectomy will result in X-zone involution.119 Androgen administration, such as androstenedione, will result in the rapid disappearance of the X-zone in female mice, and removing androgens with ovariectomy will prolong the persistence of the X-zone in female mice.121-124 While the function of the X-zone is unknown, its normal development and regression are mediated by a variety of factors, including sex steroid hormones, luteinizing hormones, and thyroid hormones.118 This is the first known study in which exposure to ILs has been linked to this type of lesion in the adrenal gland.
116. Keegan CE, Hammer GD. Recent insights into organogenesis of the adrenal cortex. Trends Endocrinol Metab. 2002; 13(5):200-208. DOI: 10.1016/S1043-2760(02)00602-1 PubMed: 12185666
117. van Weerden WM, Bierings HG, Van Steenbrugge GJ, De Jong FH, Schröder FH. Adrenal glands of mouse and rat do not synthesize androgens. Life Sci. 1992; 50(12):857-861. DOI: 10.1016/0024-3205(92)90204-3 PubMed: 1312193
116. Keegan CE, Hammer GD. Recent insights into organogenesis of the adrenal cortex. Trends Endocrinol Metab. 2002; 13(5):200-208. DOI: 10.1016/S1043-2760(02)00602-1 PubMed: 12185666
118. Huang C-C, Kang Y. The transient cortical zone in the adrenal gland: The mystery of the adrenal X-zone. J Endocrinol. 2019; 241(1):R51-R63. DOI: 10.1530/JOE-18-0632 PubMed: 30817316
119. Greaves P. Chapter 13. Endocrine glands. Histopathology of Preclinical Toxicity Studies. 4th ed. Boston: Academic Press; 2012. p. 725-797. DOI: 10.1016/B978-0-444-53856-7.00013-0
120. Hirokawa N, Ishikawa H. Electron microscopic observations on postnatal development of the X zone in mouse adrenal cortex. Z Anat Entwickl Gesch. 1974; 144(1):85-100. DOI: 10.1007/BF00518635 PubMed: 4368660
119. Greaves P. Chapter 13. Endocrine glands. Histopathology of Preclinical Toxicity Studies. 4th ed. Boston: Academic Press; 2012. p. 725-797. DOI: 10.1016/B978-0-444-53856-7.00013-0
121. Blystone CR, Elmore SA, Witt KL, Malarkey DE, Foster PMD. Toxicity and carcinogenicity of androstenedione in F344/N rats and B6C3F1 mice. Food Chem Toxicol. 2011; 49(9):2116-2124. DOI: 10.1016/j.fct.2011.05.026 PubMed: 21651954
124. Howard E, Gengradom S. The effects of ovariectomy and administration of progesterone on the adrenal x-zone and the uterus. Endocrinology. 1940; 26(6):1048-1052. DOI: 10.1210/endo-26-6-1048
118. Huang C-C, Kang Y. The transient cortical zone in the adrenal gland: The mystery of the adrenal X-zone. J Endocrinol. 2019; 241(1):R51-R63. DOI: 10.1530/JOE-18-0632 PubMed: 30817316
The toxicity of ILs is dependent on the anion, cation, concentration, substituents, and the investigated biosystem.108 Most studies examining the toxicity of ILs use in silico or in vitro approaches, and early in vivo toxicity studies more commonly used nonmammalian animal models.108 Although somewhat limited by the number of chemicals evaluated here, this study can be used to make general comparisons to better understand in vivo mammalian toxicity associated with different cations or alkyl side chain length. Specifically, body weight and histological changes in response to IL exposure can be compared among the four ILs included in this study. Rats only had significant changes in terminal mean body weights after exposure to two of the four ILs. These changes were within 12% of the control groups and occurred at the higher exposure concentrations (1–6 mg/mL), for which average daily water consumption was 48%–84% of the control groups. Furthermore, no evidence of histopathological changes was found in rats following the 3-month exposure period. The rat studies, therefore, did not allow comparisons that might support conclusions relating cation type or alkyl chain length to toxicity. In contrast, mice exposed to all four ILs did exhibit body weight and histopathological changes, providing an opportunity to compare the toxicity of each IL (by cation type or alkyl chain length).
108. Agatemor C, Ibsen KN, Tanner EEL, Mitragotri S. Ionic liquids for addressing unmet needs in healthcare. Bioeng Transl Med. 2018; 3(1):7-25. DOI: 10.1002/btm2.10083 PubMed: 29376130
108. Agatemor C, Ibsen KN, Tanner EEL, Mitragotri S. Ionic liquids for addressing unmet needs in healthcare. Bioeng Transl Med. 2018; 3(1):7-25. DOI: 10.1002/btm2.10083 PubMed: 29376130
Zhao et al. first proposed that imidazolium-based ILs with longer alkyl chain substituents are more toxic because longer alkyl side chains increase chemical hydrophobicity.125 This hypothesis was investigated by Bailey and colleagues, who evaluated the potential for Emim-Cl, Bmim-Cl, and the longer chain 1-decyl-3-methylimidazolium chloride (Dmim-Cl) to induce developmental toxicity in pregnant CD-1 mice.68 Bailey et al.68 reported that Emim-Cl was not toxic, but ILs with longer alkyl chain lengths had increased toxicity. Using short-term in vitro inhibition respiration assays, Gomez-Herrero et al.57 further showed the toxicity of imidazolium-based ILs increased as alkyl chain length increased. The imidazolium-based IL with the shortest alkyl chain was 24-fold less toxic than the IL with the longest alkyl chain; Emim-Cl (2 carbons), Bmim-Cl (4 carbons), 1-hexyl-3-methylimidazolium chloride (Hmim-Cl; 6 carbons), and 1-octyl-3-methylimidazolium chloride (Omim-Cl; 8 carbons) had median effective concentration (EC50) values of 4.19, 1.79, 0.91, and 0.17 mM, respectively. This pattern of toxicity is corroborated by several other in vitro assays and a myriad of other biological systems, such as microorganisms, plants, and human cell lines.4,57,58,126-129 In the present studies, mice exposed to Bmim-Cl experienced significantly decreased terminal mean body weights and/or histopathological changes at exposure concentrations 10 times lower than mice exposed to Emim-Cl, supporting the hypothesis that ILs with longer alkyl chains are more toxic. Specifically, male mice exposed to Emim-Cl had a lowest-observed-effect level (LOEL) of 10 mg/mL when focusing on significant terminal mean body weight changes and 30 mg/mL when focusing on histopathological changes (Figure 12). Male mice exposed to Bmim-Cl had a LOEL of 3 mg/mL for significant terminal mean body weight changes; male mice exposed to Bmim-Cl had no significant histopathological changes and therefore no corresponding LOEL could be determined (Figure 12). Female mice exposed to Emim-Cl had a LOEL of 30 mg/mL when focusing on significant terminal mean body weight changes and histopathological changes, whereas female mice exposed to Bmim-Cl had a LOEL of 3 mg/mL for the same endpoints. Although no deaths were reported in Bmim-Cl-exposed rats or mice in this study, Landry et al.46 estimated an oral median lethal dose (LD50) for Bmim-Cl of 550 mg/kg in female Fischer 344 (F344) rats. Rats and mice in the present study were exposed to Emim-Cl at higher concentrations and much higher estimated average internal doses (up to 691 mg/kg/day in rats and 2,457 mg/kg/day in mice) than the reported Bmim-Cl LD50, but no deaths were reported for this chemical, suggesting Emim-Cl, with a 2-carbon alkyl side chain, may be better tolerated and less toxic than Bmim-Cl, with a 4-carbon alkyl side chain.
125. Zhao D, Liao Y, Zhang Z. Toxicity of ionic liquids. Clean (Weinh). 2007; 35(1):42-48. DOI: 10.1002/clen.200600015
68. Bailey MM, Jernigan PL, Henson MB, Sturdivant J, Rasco JF, Lovich AN, Lockhard JE, Hough WL, Di Bona KR, Beaird J, et al. A comparison of the effects of prenatal exposure of CD-1 mice to three imidazolium-based ionic liquids. Birth Defects Res B Dev Reprod Toxicol. 2010; 89(3):233-238. DOI: 10.1002/bdrb.20251 PubMed: 20540104
68. Bailey MM, Jernigan PL, Henson MB, Sturdivant J, Rasco JF, Lovich AN, Lockhard JE, Hough WL, Di Bona KR, Beaird J, et al. A comparison of the effects of prenatal exposure of CD-1 mice to three imidazolium-based ionic liquids. Birth Defects Res B Dev Reprod Toxicol. 2010; 89(3):233-238. DOI: 10.1002/bdrb.20251 PubMed: 20540104
57. Gomez-Herrero E, Tobajas M, Polo A, Rodriguez JJ, Mohedano AF. Toxicity and inhibition assessment of ionic liquids by activated sludge. Ecotoxicol Environ Saf. 2020; 187:109836. DOI: 10.1016/j.ecoenv.2019.109836 PubMed: 31675504
4. Pham TP, Cho C-W, Yun Y-S. Environmental fate and toxicity of ionic liquids: A review. Water Res. 2010; 44(2):352-372. DOI: 10.1016/j.watres.2009.09.030 PubMed: 19854462
57. Gomez-Herrero E, Tobajas M, Polo A, Rodriguez JJ, Mohedano AF. Toxicity and inhibition assessment of ionic liquids by activated sludge. Ecotoxicol Environ Saf. 2020; 187:109836. DOI: 10.1016/j.ecoenv.2019.109836 PubMed: 31675504
58. Larson JH, Frost PC, Lamberti GA. Variable toxicity of ionic liquid–forming chemicals to Lemna minor and the influence of dissolved organic matter. Environ Toxicol Chem. 2008; 27(3):676-681. DOI: 10.1897/06-540.1 PubMed: 17967067
126. Bernot RJ, Kennedy EE, Lamberti GA. Effects of ionic liquids on the survival, movement, and feeding behavior of the freshwater snail, Physa acuta. Environ Toxicol Chem. 2005; 24(7):1759-1765. DOI: 10.1897/04-614R.1 PubMed: 16050594
129. Wang X, Ohlin CA, Lu Q, Fei Z, Hu J, Dyson PJ. Cytotoxicity of ionic liquids and precursor compounds towards human cell line HeLa. Green Chem. 2007; 9(11):1191-1197. DOI: 10.1039/b704503d
46. Landry TD, Brooks K, Poche D, Woolhiser M. Acute toxicity profile of 1-butyl-3-methylimidazolium chloride. Bull Environ Contam Toxicol. 2005; 74(3):559-565. DOI: 10.1007/s00128-005-0620-4 PubMed: 15903191
Additional research by NTP investigating this question in a dermal sensitization study demonstrated similar results; in vivo and in vitro assays for skin sensitization determined that Emim-Cl was not toxic, whereas Bmim-Cl was classified as a weak sensitizer.69 The relationship between alkyl chain length and toxicity is further supported by high-throughput in vitro screening assays conducted by NTP on 197 ILs. In general, as IL alkyl chain length increases (up to 18 carbons), toxicity and activity in Tox21 assays increase.130,131 It should be noted that the four ILs tested in this report had very weak activities in these in vitro assays,132-135 potentially supporting the conclusion of their relatively low toxicity in vivo. One caveat to the present studies is that while differing alkyl chain lengths were tested for methylimidazoliums, ILs with <5 carbons (e.g., both Emim-Cl [2 carbons] and Bmim-Cl [4 carbons]) are typically thought to have limited toxicity, whereas ILs with >6 carbons are thought to have linearly increased toxicity up to 10 carbons, wherein toxicity plateaus.62,63 It may be worthwhile, therefore, to assess in vivo mammalian toxicity in ILs with longer alkyl chain lengths in future studies. Gomez-Herrero et al.57 suggested longer alkyl chains may interact with membrane proteins as well as with the lipid bilayer, altering integrity and native state of proteins in the membrane. Interestingly, this ability of some long-chain ILs to perturb cell membranes can be mitigated by rational design, and this quality is being utilized in the pharmaceutical industry to enhance transcellular and paracellular drug transport.108
69. Frawley RP, Germolec DR, Johnson VJ, Gulledge T, Manheng W, White K, Shockley KR, Harris SF, Hooth M, Ryan K. Evaluation of skin sensitization induced by four ionic liquids. J Appl Toxicol. 2022; 42(3):392-408. DOI: 10.1002/jat.4224 PubMed: 34453447
130. National Toxicology Program (NTP). Tox21 assays. Research Triangle Park, NC: U.S. Department of Health and Human Services, National Institute of Environmental Health Sciences, National Toxicology Program; 2021. https://sandbox.ntp.niehs.nih.gov/tox21-activity-browser/
131. Hsieh JH, Sedykh A, Huang R, Xia M, Tice RR. A data analysis pipeline accounting for artifacts in Tox21 quantitative high-throughput screening assays. J Biomol Screen. 2015; 20(7):887-897. DOI: 10.1177/1087057115581317 PubMed: 25904095
132. National Center for Biotechnology Information (NCBI). PubChem Compound Summary for CID 2734160, 1-Ethyl-3-methylimidazolium chloride. Bethesda, MD: National Library of Medicine. https://pubchem.ncbi.nlm.nih.gov/compound/2734160
135. National Center for Biotechnology Information (NCBI). PubChem Compound Summary for CID 2734171, n-Butylpyridinium chloride. Bethesda, MD: National Library of Medicine. https://pubchem.ncbi.nlm.nih.gov/compound/2734171
62. Mendonça CMN, Balogh DT, Barbosa SC, Sintra TE, Ventura SPM, Martins LFG, Morgado P, Filipe EJM, Coutinho JAP, Oliveira ON, et al. Understanding the interactions of imidazolium-based ionic liquids with cell membrane models. Phys Chem Chem Phys. 2018; 20(47):29764-29777. DOI: 10.1039/C8CP05035J PubMed: 30462106
63. Kusumahastuti DKA, Sihtmäe M, Kapitanov IV, Karpichev Y, Gathergood N, Kahru A. Toxicity profiling of 24 l-phenylalanine derived ionic liquids based on pyridinium, imidazolium and cholinium cations and varying alkyl chains using rapid screening Vibrio fischeri bioassay. Ecotoxicol Environ Saf. 2019; 172:556-565. DOI: 10.1016/j.ecoenv.2018.12.076 PubMed: 30776578
57. Gomez-Herrero E, Tobajas M, Polo A, Rodriguez JJ, Mohedano AF. Toxicity and inhibition assessment of ionic liquids by activated sludge. Ecotoxicol Environ Saf. 2020; 187:109836. DOI: 10.1016/j.ecoenv.2019.109836 PubMed: 31675504
108. Agatemor C, Ibsen KN, Tanner EEL, Mitragotri S. Ionic liquids for addressing unmet needs in healthcare. Bioeng Transl Med. 2018; 3(1):7-25. DOI: 10.1002/btm2.10083 PubMed: 29376130
Another goal of the present studies was to compare the toxicity of different cations (i.e., imidazolium, pyrrolidinium, and pyridinium). To ensure the cation could be properly evaluated, Bmim-Cl, Bmpy-Cl, and NBuPy-Cl all contained a 4-carbon alkyl side chain and the same anion. Various studies have suggested that aromatic-based ILs, such as imidazolium and pyridinium, are more toxic in vitro than nonaromatic ILs, such as pyrrolidinium, due to increased hydrophobicity of head groups.4,57,58 Quantitative structure-property relationship (QSPR) modeling predicts that imidazolium cations are more toxic than pyridinium cations due to the difference in the number of nitrogen atoms.4,127 In NTP studies investigating these ILs for dermal sensitization, both Bmim-Cl and Bmpy-Cl were classified as weak sensitizers, whereas NBuPy-Cl was classified as an irritant,69 but results from the Frawley et al. study did not distinguish toxicity by cation type.
4. Pham TP, Cho C-W, Yun Y-S. Environmental fate and toxicity of ionic liquids: A review. Water Res. 2010; 44(2):352-372. DOI: 10.1016/j.watres.2009.09.030 PubMed: 19854462
57. Gomez-Herrero E, Tobajas M, Polo A, Rodriguez JJ, Mohedano AF. Toxicity and inhibition assessment of ionic liquids by activated sludge. Ecotoxicol Environ Saf. 2020; 187:109836. DOI: 10.1016/j.ecoenv.2019.109836 PubMed: 31675504
58. Larson JH, Frost PC, Lamberti GA. Variable toxicity of ionic liquid–forming chemicals to Lemna minor and the influence of dissolved organic matter. Environ Toxicol Chem. 2008; 27(3):676-681. DOI: 10.1897/06-540.1 PubMed: 17967067
4. Pham TP, Cho C-W, Yun Y-S. Environmental fate and toxicity of ionic liquids: A review. Water Res. 2010; 44(2):352-372. DOI: 10.1016/j.watres.2009.09.030 PubMed: 19854462
127. Couling DJ, Bernot RJ, Docherty KM, Dixon JK, Maginn EJ. Assessing the factors responsible for ionic liquid toxicity to aquatic organisms via quantitative structure–property relationship modeling. Green Chem. 2006; 8(1):82-90. DOI: 10.1039/B511333D
69. Frawley RP, Germolec DR, Johnson VJ, Gulledge T, Manheng W, White K, Shockley KR, Harris SF, Hooth M, Ryan K. Evaluation of skin sensitization induced by four ionic liquids. J Appl Toxicol. 2022; 42(3):392-408. DOI: 10.1002/jat.4224 PubMed: 34453447
In the 3-month drinking water study presented here, toxicological findings varied across male and female mice for all three cation types. When comparing body weight changes, male mice exposed to Bmim-Cl (imidazolium) displayed significant changes at lower exposure concentrations than NBuPy-Cl (pyridinium) or Bmpy-Cl (pyrrolidinium) (Figure 12); significantly decreased terminal mean body weights were observed at 3, 6, and 10 mg/mL in Bmim-Cl-, NBuPy-Cl-, and Bmpy-Cl-exposed male mice, respectively. In contrast, while no significant histopathological changes were observed in Bmim-Cl-exposed male mice, NBuPy-Cl- and Bmpy-Cl-exposed male mice had significant increases in the incidence of kidney lesions at 6 mg/mL and 10 mg/mL, respectively (note these are the same LOELs as for terminal mean body weight changes). In female mice, a significant decrease in terminal mean body weight was observed in the groups exposed to 3 mg/mL Bmim-Cl or NBuPy-Cl, but not Bmpy-Cl. Significant increases in adrenal lesions were also observed in all three cation groups at 3 mg/mL in Bmim-Cl- and Bmpy-Cl-exposed female mice and at 6 mg/mL in NBuPy-Cl-exposed female mice (the same as in NBuPy-Cl-exposed males). On the basis of these endpoints and on the exposure concentrations tested, it is unclear whether imidazolium-, pyrrolidinium- or pyridinium-based IL exposure is most toxic.
In the aforementioned Tox21 high-throughput in vitro assays conducted by NTP, cation type was not a good predictor of cytotoxicity or activity. Other researchers have speculated that the toxicity of ILs with a bioactive cation may depend more on the cationic head group than on the alkyl side chain, whereas toxicity in less bioactive cations (e.g., imidazolium, pyridinium) may be modulated more strongly by the side chain.108,136 For example, in the promyelocytic leukemia rat cell line IPC-81, toxicity of imidazolium, pyridinium, piperidinium, pyrrolidinium, and morpholinium are similar.108,137 Therefore, it is reasonable that the cations tested in the current study exhibit minimal differences in toxicity.
108. Agatemor C, Ibsen KN, Tanner EEL, Mitragotri S. Ionic liquids for addressing unmet needs in healthcare. Bioeng Transl Med. 2018; 3(1):7-25. DOI: 10.1002/btm2.10083 PubMed: 29376130
136. Arning J, Stolte S, Böschen A, Stock F, Pitner W-R, Welz-Biermann U, Jastorff B, Ranke J. Qualitative and quantitative structure activity relationships for the inhibitory effects of cationic head groups, functionalised side chains and anions of ionic liquids on acetylcholinesterase. Green Chem. 2008; 10(1):47-58. DOI: 10.1039/B712109A
108. Agatemor C, Ibsen KN, Tanner EEL, Mitragotri S. Ionic liquids for addressing unmet needs in healthcare. Bioeng Transl Med. 2018; 3(1):7-25. DOI: 10.1002/btm2.10083 PubMed: 29376130
137. Stolte S, Arning J, Bottin-Weber U, Müller A, Pitner W-R, Welz-Biermann U, Jastorff B, Ranke J. Effects of different head groups and functionalised side chains on the cytotoxicity of ionic liquids. Green Chem. 2007; 9(7):760-767. DOI: 10.1039/B615326G
Overall, the results from this comparative study suggest that Emim-Cl, Bmim-Cl, Bmpy-Cl, and NBuPy-Cl in drinking water have minimal effects on rats and mice at low exposure concentrations (<3 mg/mL). Exposure to higher IL concentrations (≥3 mg/mL) results in lower body weights and nonneoplastic lesions in the kidneys of male and female mice and in the adrenal glands of female mice. The lowest-observed-effect levels (LOELs) were determined using these data. The LOELs were assigned as 10 mg/mL for Emim-Cl-exposed male mice, 3 mg/mL for Bmim-Cl-exposed male mice, 10 mg/mL for Bmpy-Cl-exposed male mice, and 6 mg/mL for NBuPy-Cl-exposed male mice. The LOELs for female mice differed slightly. The LOELs were 30 mg/mL for Emim-Cl-exposed female mice, 3 mg/mL for Bmim-Cl-exposed female mice (the same as for Bmim-Cl-exposed male mice), 3 mg/mL for Bmpy-Cl-exposed female mice, and 3 mg/mL for NBuPy-Cl-exposed female mice. These studies indicate that IL-induced toxicity may be attributable to alkyl chain length and cation type. ILs with longer alkyl chains typically exhibit increased toxicity compared to ILs with shorter alkyl chains. In this report, mice exposed to Bmim-Cl (an IL with a 4-carbon alkyl chain) had a lower LOEL than did mice exposed to Emim-Cl (an IL with a 2-carbon alkyl chain). The difference in toxicity among cations (imidiazolium vs. pyrrolidinium vs. pyridinium), however, is less clear and is both sex- and endpoint-dependent.
References
1. Baker GA, Baker SN, Pandey S, Bright FV. An analytical view of ionic liquids. Analyst. 2005; 130(6):800-808. DOI: 10.1039/b500865b PubMed: 15912225
2. Rogers RD, Seddon KR. Chemistry. Ionic liquids—solvents of the future? Science. 2003; 302(5646):792-793. DOI: 10.1126/science.1090313 PubMed: 14593156
3. Miskiewicz A, Ceranowicz P, Szymczak M, Bartuś K, Kowalczyk P. The use of liquids ionic fluids as pharmaceutically active substances helpful in combating nosocomial infections induced by Klebsiella Pneumoniae New Delhi strain, Acinetobacter Baumannii and Enterococcus species. Int J Mol Sci. 2018; 19(9). DOI: 10.3390/ijms19092779 PubMed: 30223584
4. Pham TP, Cho C-W, Yun Y-S. Environmental fate and toxicity of ionic liquids: A review. Water Res. 2010; 44(2):352-372. DOI: 10.1016/j.watres.2009.09.030 PubMed: 19854462
5. Heckenbach ME, Romero FN, Green MD, Halden RU. Meta-analysis of ionic liquid literature and toxicology. Chemosphere. 2016; 150:266-274. DOI: 10.1016/j.chemosphere.2016.02.029 PubMed: 26907595
6. Endres F, Zein El Abedin S. Air and water stable ionic liquids in physical chemistry. Phys Chem Chem Phys. 2006; 8(18):2101-2116. DOI: 10.1039/b600519p PubMed: 16751868
7. Castner EW Jr, Margulis CJ, Maroncelli M, Wishart JF. Ionic liquids: Structure and photochemical reactions. Annu Rev Phys Chem. 2011; 62:85-105. DOI: 10.1146/annurev-physchem-032210-103421 PubMed: 21091193
8. Cvjetko Bubalo M, Radošević K, Redovniković IR, Halambek J, Srček VG. A brief overview of the potential environmental hazards of ionic liquids. Ecotoxicol Environ Saf. 2014; 99:1-12. DOI: 10.1016/j.ecoenv.2013.10.019 PubMed: 24210364
9. Freemantle M. Designer solvents-ionic liquids may boost clean technology development. Chem Eng News. 1998; 76(13):32-37. DOI: 10.1021/cen-v076n013.p032
10. Freemantle M. Eyes on ionic liquids. Chem Eng News. 2000; 78(20):37-50. DOI: 10.1021/cen-v078n020.p037
11. Plechkova NV, Seddon KR. Applications of ionic liquids in the chemical industry. Chem Soc Rev. 2008; 37(1):123-150. DOI: 10.1039/B006677J PubMed: 18197338
12. Holbrey JD, Seddon KR. Ionic liquids. Clean Products and Processes. 1999; 1(4):223-236. DOI: 10.1007/s100980050036
13. U.S. Environmental Protection Agency (USEPA). CompTox Chemicals Dashboard: 1-Ethyl-3-methylimidazolium chloride 65039-09-0 | DTXSID1041180. https://comptox.epa.gov/dashboard/dsstoxdb/results?search=DTXSID1041180#properties
14. U.S. Environmental Protection Agency (USEPA). CompTox Chemicals Dashboard: 1-Butyl-3-methylimidazolium chloride 79917-90-1 | DTXSID6031461. https://comptox.epa.gov/dashboard/dsstoxdb/results?search=DTXSID6031461#properties
15. U.S. Environmental Protection Agency (USEPA). CompTox Chemicals Dashboard: 1-Butyl-1-methylpyrrolidinium chloride 479500-35-1 | DTXSID1031460. https://comptox.epa.gov/dashboard/dsstoxdb/results?search=479500-35-1#properties
16. U.S. Environmental Protection Agency (USEPA). CompTox Chemicals Dashboard: N-Butylpyridinium chloride 1124-64-7 | DTXSID1031462. https://comptox.epa.gov/dashboard/dsstoxdb/results?search=1124-64-7#properties
17. U.S. Environmental Protection Agency (USEPA). CompTox Chemicals Dashboard. https://comptox.epa.gov/dashboard
18. National Center for Biotechnology Information (NCBI). PubChem. Bethesda, MD: National Library of Medicine. https://pubchem.ncbi.nlm.nih.gov/
19. Wilkes JS. A short history of ionic liquids—from molten salts to neoteric solvents. Green Chem. 2002; 4(2):73-80. DOI: 10.1039/b110838g
20. Angell CA, Ansari Y, Zhao Z. Ionic liquids: Past, present and future. Faraday Discuss. 2012; 154:9-27. DOI: 10.1039/C1FD00112D PubMed: 22455011
21. Welton T. Ionic liquids: A brief history. Biophys Rev. 2018; 10(3):691-706. DOI: 10.1007/s12551-018-0419-2 PubMed: 29700779
22. Grand View Research. Ionic liquids market size, share & trends analysis report by application (solvents & catalysts, extractions & separations, bio-refineries, energy storage), by region, and segment forecasts, 2018 - 2025. 2016. https://www.grandviewresearch.com/industry-analysis/ionic-liquids-market
23. National Center for Biotechnology Information (NCBI). PubChem Compound Summary for CID 2734160, 1-Ethyl-3-methylimidazolium chloride: 6. Chemical Vendors. Bethesda, MD: National Library of Medicine; 2020. [12/14/2020]. https://pubchem.ncbi.nlm.nih.gov/compound/2734160#section=Chemical-Vendors
24. National Center for Biotechnology Information (NCBI). PubChem Compound Summary for CID 2734161, 1-Butyl-3-methylimidazolium chloride: 5. Chemical Vendors. Bethesda, MD: National Library of Medicine; 2020. [12/14/2020]. https://pubchem.ncbi.nlm.nih.gov/compound/2734161#section=Chemical-Vendors
25. National Center for Biotechnology Information (NCBI). PubChem Compound Summary for CID 11769095, 1-Butyl-1-methylpyrrolidinium chloride: 5. Chemical Vendors. Bethesda, MD: National Library of Medicine; 2020. [12/14/2020]. https://pubchem.ncbi.nlm.nih.gov/compound/11769095#section=Chemical-Vendors
26. National Center for Biotechnology Information (NCBI). PubChem Compound Summary for CID 2734171, n-Butylpyridinium chloride: 6. Chemical Vendors. Bethesda, MD: National Library of Medicine; 2020. [12/14/2020]. https://pubchem.ncbi.nlm.nih.gov/compound/2734171#section=Chemical-Vendors
27. Goindi S, Arora P, Kumar N, Puri A. Development of novel ionic liquid-based microemulsion formulation for dermal delivery of 5-Fluorouracil. AAPS PharmSciTech. 2014; 15(4):810-821. DOI: 10.1208/s12249-014-0103-1 PubMed: 24668136
28. Wang C, Zhu J, Zhang D, Yang Y, Zheng L, Qu Y, Yang X, Cui X. Ionic liquid - microemulsions assisting in the transdermal delivery of Dencichine: Preparation, in-vitro and in-vivo evaluations, and investigation of the permeation mechanism. Int J Pharm. 2018; 535(1-2):120-131. DOI: 10.1016/j.ijpharm.2017.10.024 PubMed: 29104058
29. Dobler D, Schmidts T, Zinecker C, Schlupp P, Schäfer J, Runkel F. Hydrophilic ionic liquids as ingredients of gel-based dermal formulations. AAPS PharmSciTech. 2016; 17(4):923-931. DOI: 10.1208/s12249-015-0421-y PubMed: 27435197
30. Wang P, Yu H, Zhan S, Wang S. Catalytic hydrolysis of lignocellulosic biomass into 5-hydroxymethylfurfural in ionic liquid. Bioresour Technol. 2011; 102(5):4179-4183. DOI: 10.1016/j.biortech.2010.12.073 PubMed: 21232942
31. Nordwald EM, Kaar JL. Mediating electrostatic binding of 1-butyl-3-methylimidazolium chloride to enzyme surfaces improves conformational stability. J Phys Chem B. 2013; 117(30):8977-8986. DOI: 10.1021/jp404760w PubMed: 23822219
32. Tavares APM, Pinho B, Rodriguez O, Macedo EA. Biocatalysis in ionic liquid: Degradation of phenol by laccase. Procedia Eng. 2012; 42:226-230. DOI: 10.1016/j.proeng.2012.07.413
33. Ventura SP, Neves CM, Freire MG, Marrucho IM, Oliveira J, Coutinho JA. Evaluation of anion influence on the formation and extraction capacity of ionic-liquid-based aqueous biphasic systems. J Phys Chem B. 2009; 113(27):9304-9310. DOI: 10.1021/jp903286d PubMed: 19518115
34. Du Z, Yu YL, Wang JH. Extraction of proteins from biological fluids by use of an ionic liquid/aqueous two-phase system. Chemistry. 2007; 13(7):2130-2137. DOI: 10.1002/chem.200601234 PubMed: 17136782
35. National Toxicology Program (NTP). Ionic liquids: 1-Butyl-3-methylimidazolium chloride (CAS No. 79917-90-1), 1-butyl-1-methylpyrrolidinium chloride (CAS No. 479500-35-1), n-butylpyridinium chloride (CAS No. 1124-64-7). Review of toxicological literature. Research Triangle Park, NC: Prepared by: Integrated Laboratory Systems, Inc.; 2004. https://ntp.niehs.nih.gov/ntp/htdocs/chem_background/exsumpdf/ionic_liquids_508.pdf
36. Wang C, Wang Y, Lu Y, He H, Huo F, Dong K, Wei N, Zhang S. Height-driven structure and thermodynamic properties of confined ionic liquids inside carbon nanochannels from molecular dynamics study. Phys Chem Chem Phys. 2019; 21(24):12767-12776. DOI: 10.1039/C9CP00732F PubMed: 31020276
37. Chen K, Xu W, Ding Y, Xue P, Sheng P, Qiao H, He J. Hemp-based all-cellulose composites through ionic liquid promoted controllable dissolution and structural control. Carbohydr Polym. 2020; 235:116027. DOI: 10.1016/j.carbpol.2020.116027 PubMed: 32122518
38. Hwang JH, Park H, Choi DW, Nam KT, Lim KM. Investigation of dermal toxicity of ionic liquids in monolayer-cultured skin cells and 3D reconstructed human skin models. Toxicol In Vitro. 2018; 46:194-202. DOI: 10.1016/j.tiv.2017.09.025 PubMed: 28958837
39. Kohli R. Applications of ionic liquids in removal of surface contaminants. In: Kohli R, Mittal KL, editors. Developments in Surface Contamination and Cleaning: Applications of Cleaning Techniques. Elsevier; 2019. p. 619-680. DOI: 10.1016/B978-0-12-815577-6.00016-5
40. Berton P, Bica K, Rogers RD. Ionic liquids for consumer products: Dissolution, characterization, and controlled release of fragrance compositions. Fluid Phase Equilib. 2017; 450:51-56. DOI: 10.1016/j.fluid.2017.07.011
41. Anthony JL, Maginn EJ, Brennecke JF. Solution thermodynamics of imidazolium-based ionic liquids and water. J Phys Chem B. 2001; 105(44):10942-10949. DOI: 10.1021/jp0112368
42. McFarlane J, Ridenour WB, Luo H, Hunt RD, DePaoli DW, Ren RX. Room temperature ionic liquids for separating organics from produced water. Sep Sci Technol. 2005; 40(6):1245-1265. DOI: 10.1081/SS-200052807
43. Cheng Y, Wright SH, Hooth MJ, Sipes IG. Characterization of the disposition and toxicokinetics of N-butylpyridinium chloride in male F-344 rats and female B6C3F1 mice and its transport by organic cation transporter 2. Drug Metab Dispos. 2009; 37(4):909-916. DOI: 10.1124/dmd.108.022681 PubMed: 19171679
44. Sipes IG, Knudsen GA, Kuester RK. The effects of dose and route on the toxicokinetics and disposition of 1-butyl-3-methylimidazolium chloride in male F-344 rats and female B6C3F1 mice. Drug Metab Dispos. 2008; 36(2):284-293. DOI: 10.1124/dmd.107.018515 PubMed: 17967929
45. Knudsen GA, Cheng Y, Kuester RK, Hooth MJ, Sipes IG. Effects of dose and route on the disposition and kinetics of 1-butyl-1-methylpyrrolidinium chloride in male F-344 rats. Drug Metab Dispos. 2009; 37(11):2171-2177. DOI: 10.1124/dmd.109.029082 PubMed: 19704025
46. Landry TD, Brooks K, Poche D, Woolhiser M. Acute toxicity profile of 1-butyl-3-methylimidazolium chloride. Bull Environ Contam Toxicol. 2005; 74(3):559-565. DOI: 10.1007/s00128-005-0620-4 PubMed: 15903191
47. Jastorff B, Störmann R, Ranke J, Mölter K, Stock F, Oberheitmann B, Hoffmann W, Hoffmann J, Nüchter M, Ondruschka B, et al. How hazardous are ionic liquids? Structure–activity relationships and biological testing as important elements for sustainability evaluation. Green Chem. 2003; 5(2):136-142. DOI: 10.1039/b211971d
48. Cheng Y, Martinez-Guerrero LJ, Wright SH, Kuester RK, Hooth MJ, Sipes IG. Characterization of the inhibitory effects of N-butylpyridinium chloride and structurally related ionic liquids on organic cation transporters 1/2 and human toxic extrusion transporters 1/2-k in vitro and in vivo. Drug Metab Dispos. 2011; 39(9):1755-1761. DOI: 10.1124/dmd.110.035865 PubMed: 21646436
49. Chen Y, Zhang S, Sorani M, Giacomini KM. Transport of paraquat by human organic cation transporters and multidrug and toxic compound extrusion family. J Pharmacol Exp Ther. 2007; 322(2):695-700. DOI: 10.1124/jpet.107.123554 PubMed: 17495125
50. Koepsell H, Lips K, Volk C. Polyspecific organic cation transporters: Structure, function, physiological roles, and biopharmaceutical implications. Pharm Res. 2007; 24(7):1227-1251. DOI: 10.1007/s11095-007-9254-z PubMed: 17473959
51. Koepsell H. Organic cation transporters in intestine, kidney, liver, and brain. Annu Rev Physiol. 1998; 60:243-266. DOI: 10.1146/annurev.physiol.60.1.243 PubMed: 9558463
52. Kim MK, Han L, Choi MK, Han Y-H, Kim D-D, Chung S-J, Shim C-K. Dose dependency in the oral bioavailability of an organic cation model, tributylmethyl ammonium (TBuMA), in rats: Association with the saturation of efflux by the P-gp system on the apical membrane of the intestinal epithelium. J Pharm Sci. 2005; 94(12):2644-2655. DOI: 10.1002/jps.20456 PubMed: 16258993
53. Suhre WM, Ekins S, Chang C, Swaan PW, Wright SH. Molecular determinants of substrate/inhibitor binding to the human and rabbit renal organic cation transporters hOCT2 and rbOCT2. Mol Pharmacol. 2005; 67(4):1067-1077. DOI: 10.1124/mol.104.004713 PubMed: 15630081
54. Choi MK, Jin QR, Jin HE, Shim CK, Cho DY, Shin JG, Song IS. Effects of tetraalkylammonium compounds with different affinities for organic cation transporters on the pharmacokinetics of metformin. Biopharm Drug Dispos. 2007; 28(9):501-510. DOI: 10.1002/bdd.576 PubMed: 17876861
55. Liu T, Guo Y, Wang J, Wang J, Zhu L, Zhang J, Zhang C. Assessing toxic effects of [Omim]Cl and [Omim]BF4 in zebrafish adults using a biomarker approach. Environ Sci Pollut Res Int. 2016; 23(8):7360-7368. DOI: 10.1007/s11356-015-5887-3 PubMed: 26686854
56. Fatemi MH, Izadiyan P. Cytotoxicity estimation of ionic liquids based on their effective structural features. Chemosphere. 2011; 84(5):553-563. DOI: 10.1016/j.chemosphere.2011.04.021 PubMed: 21549407
57. Gomez-Herrero E, Tobajas M, Polo A, Rodriguez JJ, Mohedano AF. Toxicity and inhibition assessment of ionic liquids by activated sludge. Ecotoxicol Environ Saf. 2020; 187:109836. DOI: 10.1016/j.ecoenv.2019.109836 PubMed: 31675504
58. Larson JH, Frost PC, Lamberti GA. Variable toxicity of ionic liquid–forming chemicals to Lemna minor and the influence of dissolved organic matter. Environ Toxicol Chem. 2008; 27(3):676-681. DOI: 10.1897/06-540.1 PubMed: 17967067
59. Ranke J, Müller A, Bottin-Weber U, Stock F, Stolte S, Arning J, Störmann R, Jastorff B. Lipophilicity parameters for ionic liquid cations and their correlation to in vitro cytotoxicity. Ecotoxicol Environ Saf. 2007; 67(3):430-438. DOI: 10.1016/j.ecoenv.2006.08.008 PubMed: 17034854
60. Tsarpali V, Belavgeni A, Dailianis S. Investigation of toxic effects of imidazolium ionic liquids, [bmim][BF4] and [omim][BF4], on marine mussel Mytilus galloprovincialis with or without the presence of conventional solvents, such as acetone. Aquat Toxicol. 2015; 164:72-80. DOI: 10.1016/j.aquatox.2015.04.021 PubMed: 25935102
61. Mester P, Wagner M, Rossmanith P. Antimicrobial effects of short chained imidazolium-based ionic liquids—Influence of anion chaotropicity. Ecotoxicol Environ Saf. 2015; 111:96-101. DOI: 10.1016/j.ecoenv.2014.08.032 PubMed: 25450920
62. Mendonça CMN, Balogh DT, Barbosa SC, Sintra TE, Ventura SPM, Martins LFG, Morgado P, Filipe EJM, Coutinho JAP, Oliveira ON, et al. Understanding the interactions of imidazolium-based ionic liquids with cell membrane models. Phys Chem Chem Phys. 2018; 20(47):29764-29777. DOI: 10.1039/C8CP05035J PubMed: 30462106
63. Kusumahastuti DKA, Sihtmäe M, Kapitanov IV, Karpichev Y, Gathergood N, Kahru A. Toxicity profiling of 24 l-phenylalanine derived ionic liquids based on pyridinium, imidazolium and cholinium cations and varying alkyl chains using rapid screening Vibrio fischeri bioassay. Ecotoxicol Environ Saf. 2019; 172:556-565. DOI: 10.1016/j.ecoenv.2018.12.076 PubMed: 30776578
64. Li X-Y, Jing C-Q, Zang X-Y, Yang S, Wang J-J. Toxic cytological alteration and mitochondrial dysfunction in PC12 cells induced by 1-octyl-3-methylimidazolium chloride. Toxicol In Vitro. 2012; 26(7):1087-1092. DOI: 10.1016/j.tiv.2012.07.006 PubMed: 22835898
65. Wang P, Wan R, Huo W, Dong H, Chang Z, Xia X. Cytotoxicity, genotoxicity, oxidative stress, and apoptosis in HepG2 cells induced by the imidazole ionic liquid 1-dodecyl-3-methylimidazolium chloride. Environ Toxicol. 2020; 35(6):665-672. DOI: 10.1002/tox.22901 PubMed: 31916396
66. Lim GS, Zidar J, Cheong DW, Jaenicke S, Klähn M. Impact of ionic liquids in aqueous solution on bacterial plasma membranes studied with molecular dynamics simulations. J Phys Chem B. 2014; 118(35):10444-10459. DOI: 10.1021/jp5060952 PubMed: 25153890
67. Losada-Pérez P, Khorshid M, Renner FU. Interactions of aqueous imidazolium-based ionic liquid mixtures with solid-supported phospholipid vesicles. PLoS One. 2016; 11(9):e0163518. DOI: 10.1371/journal.pone.0163518 PubMed: 27684947
68. Bailey MM, Jernigan PL, Henson MB, Sturdivant J, Rasco JF, Lovich AN, Lockhard JE, Hough WL, Di Bona KR, Beaird J, et al. A comparison of the effects of prenatal exposure of CD-1 mice to three imidazolium-based ionic liquids. Birth Defects Res B Dev Reprod Toxicol. 2010; 89(3):233-238. DOI: 10.1002/bdrb.20251 PubMed: 20540104
69. Frawley RP, Germolec DR, Johnson VJ, Gulledge T, Manheng W, White K, Shockley KR, Harris SF, Hooth M, Ryan K. Evaluation of skin sensitization induced by four ionic liquids. J Appl Toxicol. 2022; 42(3):392-408. DOI: 10.1002/jat.4224 PubMed: 34453447
70. Organisation for Economic Co-operation and Development (OECD). Test no 442C: In chemico skin sensitisation: Direct peptide reactivity assay (DPRA). 2015.
71. Organisation for Economic Co-operation and Development (OECD). Test no 442D: In vitro skin sensitisation assays addressing the AOP key event of keratinocyte activation. 2018. DOI: 10.1787/9789264229822-en
72. Organisation for Economic Co-operation and development (OECD). Test no. 442E: In vitro skin sensitisation assays addressing the key event on activation of dendritic cells on the adverse outcome pathway for skin sensitisation. 2018. https://www.oecd-ilibrary.org/content/publication/9789264264359-en
73. Emter R, Ellis G, Natsch A. Performance of a novel keratinocyte-based reporter cell line to screen skin sensitizers in vitro. Toxicol Appl Pharmacol. 2010; 245(3):281-290. DOI: 10.1016/j.taap.2010.03.009 PubMed: 20307559
74. Mitachi T, Mezaki M, Yamashita K, Itagaki H. Acidic conditions induce the suppression of CD86 and CD54 expression in THP-1 cells. J Toxicol Sci. 2018; 43(5):299-309. DOI: 10.2131/jts.43.299 PubMed: 29743441
75. Hernández-Fernández FJ, Bayo J, Pérez de los Ríos A, Vicente MA, Bernal FJ, Quesada-Medina J. Discovering less toxic ionic liquids by using the Microtox toxicity test. Ecotoxicol Environ Saf. 2015; 116:29-33. DOI: 10.1016/j.ecoenv.2015.02.034 PubMed: 25748519
76. National Center for Biotechnology Information (NCBI). PubChem Compound LCSS for CID 2734161, 1-Butyl-3-methylimidazolium chloride: 1. GHS Classification. Bethesda, MD: National Library of Medicine; 2019. https://pubchem.ncbi.nlm.nih.gov/compound/2734161#datasheet=LCSS§ion=GHS-Classification
77. Maronpot RR, Boorman GA. Interpretation of rodent hepatocellular proliferative alterations and hepatocellular tumors in chemical safety assessment. Toxicol Pathol. 1982; 10(2):71-78. DOI: 10.1177/019262338201000210 PubMed: 28094716
78. Boorman GA, Haseman JK, Waters MD, Hardisty JF, Sills RC. Quality review procedures necessary for rodent pathology databases and toxicogenomic studies: The National Toxicology Program experience. Toxicol Pathol. 2002; 30(1):88-92. DOI: 10.1080/01926230252824752 PubMed: 11890481
79. Gart JJ, Chu KC, Tarone RE. Statistical issues in interpretation of chronic bioassay tests for carcinogenicity. J Natl Cancer Inst. 1979; 62(4):957-974. PubMed: 285297
80. Armitage P. Statistical Methods in Medical Research. Oxford: Blackwell; 1971.
81. Dunnett CW. A multiple comparison procedure for comparing several treatments with a control. J Am Stat Assoc. 1955; 50(272):1096-1121. DOI: 10.1080/01621459.1955.10501294
82. Williams DA. The comparison of several dose levels with a zero dose control. Biometrics. 1972; 28(2):519-531. DOI: 10.2307/2556164 PubMed: 5037867
83. Williams DA. A test for differences between treatment means when several dose levels are compared with a zero dose control. Biometrics. 1971; 27(1):103-117. DOI: 10.2307/2528930 PubMed: 5547548
84. Shirley E. A non-parametric equivalent of Williams’ test for contrasting increasing dose levels of a treatment. Biometrics. 1977; 33(2):386-389. DOI: 10.2307/2529789 PubMed: 884197
85. Williams DA. A note on Shirley’s nonparametric test for comparing several dose levels with a zero-dose control. Biometrics. 1986; 42(1):183-186. DOI: 10.2307/2531254 PubMed: 3719054
86. Dunn OJ. Multiple comparisons using rank sums. Technometrics. 1964; 6(3):241-252. DOI: 10.1080/00401706.1964.10490181
87. Jonckheere AR. A distribution-free k-sample test against ordered alternatives. Biometrika. 1954; 41(1-2):133-145. DOI: 10.1093/biomet/41.1-2.133
88. Dixon W, Massey F. Introduction to Statistical Analysis. New York, NY: McGraw Hill Book Company Inc; 1957. DOI: 10.2307/2332898
89. Kalbfleisch JD, Lawless JF. The analysis of panel data under a Markov assumption. J Am Stat Assoc. 1985; 80(392):863-871. DOI: 10.1080/01621459.1985.10478195
90. Code of Federal Regulations (CFR). 21(Part 58).
91. Miller JA, Miller EC. Ultimate chemical carcinogens as reactive mutagenic electrophiles. In: Hiatt HH, Watson JD, Winsten JA, editors. Origins of Human Cancer. Cold Spring Harbor, NY: Cold Spring Harbor Laboratory; 1977. p. 605-627.
92. Straus DS. Somatic mutation, cellular differentiation, and cancer causation. J Natl Cancer Inst. 1981; 67:233-241. PubMed: 7021938
93. Crawford BD. Perspectives on the somatic mutation model of carcinogenesis. In: Mehlman MA, Flamm WG, Lorentzen RJ, editors. Advances in Modern Environmental Toxicology Mechanisms and Toxicity of Chemical Carcinogens and Mutagens. Princeton, NJ: Princeton Scientific Publishing Co. Inc; 1985. p. 13-59.
94. Ashby J, Tennant RW. Definitive relationships among chemical structure, carcinogenicity and mutagenicity for 301 chemicals tested by the US NTP. Mutat Res. 1991; 257(3):229-306. DOI: 10.1016/0165-1110(91)90003-E PubMed: 1707500
95. Tennant RW, Margolin BH, Shelby MD, Zeiger E, Haseman JK, Spalding J, Caspary W, Resnick M, Stasiewicz S, Anderson B, et al. Prediction of chemical carcinogenicity in rodents from in vitro genetic toxicity assays. Science. 1987; 236(4804):933-941. DOI: 10.1126/science.3554512 PubMed: 3554512
96. Zeiger E, Haseman JK, Shelby MD, Margolin BH, Tennant RW, Holden H. Evaluation of four in vitro genetic toxicity tests for predicting rodent carcinogenicity: Confirmation of earlier results with 41 additional chemicals. Environ Mol Mutagen. 1990; 16(S18):1-14. DOI: 10.1002/em.2850160502 PubMed: 2091921
97. Schmid W. The micronucleus test. Mutat Res. 1975; 31(1):9-15. DOI: 10.1016/0165-1161(75)90058-8 PubMed: 48190
98. Heddle JA, Hite M, Kirkhart B, Mavournin K, MacGregor JT, Newell GW, Salamone MF. The induction of micronuclei as a measure of genotoxicity. A report of the U.S. Environmental Protection Agency Gene-Tox Program. Mutat Res. 1983; 123(1):61-118. DOI: 10.1016/0165-1110(83)90047-7 PubMed: 6888413
99. Shelby MD, Witt KL. Comparison results from mouse bone marrow chromosome aberration and micronucleus tests. Environ Mol Mutagen. 1995; 25:302-313. DOI: 10.1002/em.2850250407 PubMed: 7607185
100. Shelby MD, Erexson GL, Hook GJ, Tice RR. Evaluation of a three-exposure mouse bone marrow micronucleus protocol: Results with 49 chemicals. Environ Mol Mutagen. 1993; 21(2):160-179. DOI: 10.1002/em.2850210210 PubMed: 8444144
101. Witt KL, Knapton A, Wehr CM, Hook GJ, Mirsalis J, Shelby MD, MacGregor JT. Micronucleated erythrocyte frequency in peripheral blood of B6C3F(1) mice from short-term, prechronic, and chronic studies of the NTP carcinogenesis bioassay program. Environ Mol Mutagen. 2000; 36(3):163-194. DOI: 10.1002/1098-2280(2000)36:3<163::AID-EM1>3.0.CO;2-P PubMed: 11044899
102. National Toxicology Program (NTP). Pathology tables, survival and growth curves from NTP 1-butyl-3-methylimidazolium chloride, 1-butyl-1-methylpyrrolidinium chloride, 1-ethyl-3-methylimidazolium chloride, n-butylpyridinium chloride, and genetic toxicology studies. Research Triangle Park, NC: U.S. Department of Health and Human Services, National Institute of Environmental Health Sciences, National Toxicology Program; 2020. DOI: 10.22427/NTP-DATA-TOX-103
103. Everds NE, Snyder PW, Bailey KL, Bolon B, Creasy DM, Foley GL, Rosol TJ, Sellers T. Interpreting stress responses during routine toxicity studies: A review of the biology, impact, and assessment. Toxicol Pathol. 2013; 41(4):560-614. DOI: 10.1177/0192623312466452 PubMed: 23475558
104. Frazier KS, Seely JC, Hard GC, Betton G, Burnett R, Nakatsuji S, Nishikawa A, Durchfeld-Meyer B, Bube A. Proliferative and nonproliferative lesions of the rat and mouse urinary system. Toxicol Pathol. 2012; 40(4 Suppl):14s-86s. DOI: 10.1177/0192623312438736 PubMed: 22637735
105. Ormos J, Sztriha L, Bóti ZS, Kuthy E. Electron microscopic and cytochemical study of the vacuoles of regenerating renal tubular cells. Br J Exp Pathol. 1975; 56(5):477-483. PubMed: 1212429
106. Gannon A-L, O’Hara L, Mason JI, Jørgensen A, Frederiksen H, Milne L, Smith S, Mitchell RT, Smith LB. Androgen receptor signalling in the male adrenal facilitates X-zone regression, cell turnover and protects against adrenal degeneration during ageing. Sci Rep. 2019; 9(1):10457. DOI: 10.1038/s41598-019-46049-3 PubMed: 31320667
107. Davey P. Ionic liquids in consumer products: The possible uses for ionic liquids in fragrances and household products. 2008. https://media.allured.com/documents/PF_33_04_034_02.pdf
108. Agatemor C, Ibsen KN, Tanner EEL, Mitragotri S. Ionic liquids for addressing unmet needs in healthcare. Bioeng Transl Med. 2018; 3(1):7-25. DOI: 10.1002/btm2.10083 PubMed: 29376130
109. Oskarsson A, Wright MC. Ionic liquids: New emerging pollutants, aimilarities with perfluorinated alkyl substances (PFASs). Environ Sci Technol. 2019; 53(18):10539-10541. DOI: 10.1021/acs.est.9b04778 PubMed: 31442027
110. Romero A, Santos A, Tojo J, Rodríguez A. Toxicity and biodegradability of imidazolium ionic liquids. J Hazard Mater. 2008; 151(1):268-273. DOI: 10.1016/j.jhazmat.2007.10.079 PubMed: 18063302
111. Claassen V. Food and water intake.Techniques in the Behavioral and Neural Sciences Neglected Factors in Pharmacology and Neuroscience Research: Biophamaceutics, Animal Characteristics Maintenance, Testing Conditions. Elsevier; 1994. p. 267-287.
112. Koenig H, Goldstone A, Blume G, Lu CY. Testosterone-mediated sexual dimorphism of mitochondria and lysosomes in mouse kidney proximal tubules. Science. 1980; 209(4460):1023. DOI: 10.1126/science.7403864 PubMed: 7403864
113. Barthold SW. Chronic progressive nephropathy in aging rats. Toxicol Pathol. 1979; 7(1):1-6. DOI: 10.1177/019262337900700101
114. Baylis C. Age-dependent glomerular damage in the rat. Dissociation between glomerular injury and both glomerular hypertension and hypertrophy. Male gender as a primary risk factor. J Clin Invest. 1994; 94(5):1823-1829. DOI: 10.1172/JCI117531 PubMed: 7962527
115. Linkswiler H, Reynolds MS, Baumann CA. Factors affecting proteinuria in the rat. Am J Physiol. 1952; 168(2):504-508. DOI: 10.1152/ajplegacy.1952.168.2.504 PubMed: 14903168
116. Keegan CE, Hammer GD. Recent insights into organogenesis of the adrenal cortex. Trends Endocrinol Metab. 2002; 13(5):200-208. DOI: 10.1016/S1043-2760(02)00602-1 PubMed: 12185666
117. van Weerden WM, Bierings HG, Van Steenbrugge GJ, De Jong FH, Schröder FH. Adrenal glands of mouse and rat do not synthesize androgens. Life Sci. 1992; 50(12):857-861. DOI: 10.1016/0024-3205(92)90204-3 PubMed: 1312193
118. Huang C-C, Kang Y. The transient cortical zone in the adrenal gland: The mystery of the adrenal X-zone. J Endocrinol. 2019; 241(1):R51-R63. DOI: 10.1530/JOE-18-0632 PubMed: 30817316
119. Greaves P. Chapter 13. Endocrine glands. Histopathology of Preclinical Toxicity Studies. 4th ed. Boston: Academic Press; 2012. p. 725-797. DOI: 10.1016/B978-0-444-53856-7.00013-0
120. Hirokawa N, Ishikawa H. Electron microscopic observations on postnatal development of the X zone in mouse adrenal cortex. Z Anat Entwickl Gesch. 1974; 144(1):85-100. DOI: 10.1007/BF00518635 PubMed: 4368660
121. Blystone CR, Elmore SA, Witt KL, Malarkey DE, Foster PMD. Toxicity and carcinogenicity of androstenedione in F344/N rats and B6C3F1 mice. Food Chem Toxicol. 2011; 49(9):2116-2124. DOI: 10.1016/j.fct.2011.05.026 PubMed: 21651954
122. Gannon AL, O’Hara L, Mason IJ, Jørgensen A, Frederiksen H, Curley M, Milne L, Smith S, Mitchell RT, Smith LB. Androgen receptor is dispensable for x-zone regression in the female adrenal but regulates post-partum corticosterone levels and protects cortex integrity. Front Endocrinol (Lausanne). 2021; 11:599869. DOI: 10.3389/fendo.2020.599869 PubMed: 33584538
123. Matsuura S, Suzuki K. Morphological changes in the submandibular glands and in the X zone of the adrenal gland following ovariectomy in mice. Cell Tissue Res. 1986; 246(3):549-556. DOI: 10.1007/BF00215195 PubMed: 3791382
124. Howard E, Gengradom S. The effects of ovariectomy and administration of progesterone on the adrenal x-zone and the uterus. Endocrinology. 1940; 26(6):1048-1052. DOI: 10.1210/endo-26-6-1048
125. Zhao D, Liao Y, Zhang Z. Toxicity of ionic liquids. Clean (Weinh). 2007; 35(1):42-48. DOI: 10.1002/clen.200600015
126. Bernot RJ, Kennedy EE, Lamberti GA. Effects of ionic liquids on the survival, movement, and feeding behavior of the freshwater snail, Physa acuta. Environ Toxicol Chem. 2005; 24(7):1759-1765. DOI: 10.1897/04-614R.1 PubMed: 16050594
127. Couling DJ, Bernot RJ, Docherty KM, Dixon JK, Maginn EJ. Assessing the factors responsible for ionic liquid toxicity to aquatic organisms via quantitative structure–property relationship modeling. Green Chem. 2006; 8(1):82-90. DOI: 10.1039/B511333D
128. Kumari P, Pillai VVS, Benedetto A. Mechanisms of action of ionic liquids on living cells: The state of the art. Biophys Rev. 2020; 12(5):1187-1215. DOI: 10.1007/s12551-020-00754-w PubMed: 32936423
129. Wang X, Ohlin CA, Lu Q, Fei Z, Hu J, Dyson PJ. Cytotoxicity of ionic liquids and precursor compounds towards human cell line HeLa. Green Chem. 2007; 9(11):1191-1197. DOI: 10.1039/b704503d
130. National Toxicology Program (NTP). Tox21 assays. Research Triangle Park, NC: U.S. Department of Health and Human Services, National Institute of Environmental Health Sciences, National Toxicology Program; 2021. https://sandbox.ntp.niehs.nih.gov/tox21-activity-browser/ [accessed May 4, 2021]
131. Hsieh JH, Sedykh A, Huang R, Xia M, Tice RR. A data analysis pipeline accounting for artifacts in Tox21 quantitative high-throughput screening assays. J Biomol Screen. 2015; 20(7):887-897. DOI: 10.1177/1087057115581317 PubMed: 25904095
132. National Center for Biotechnology Information (NCBI). PubChem Compound Summary for CID 2734160, 1-Ethyl-3-methylimidazolium chloride. Bethesda, MD: National Library of Medicine. https://pubchem.ncbi.nlm.nih.gov/compound/2734160
133. National Center for Biotechnology Information (NCBI). PubChem Compound Summary for CID 2734161, 1-Butyl-3-methylimidazolium chloride. Bethesda, MD: National Library of Medicine. https://pubchem.ncbi.nlm.nih.gov/compound/2734161
134. National Center for Biotechnology Information (NCBI). PubChem Compound Summary for CID 19876500, 1-Butyl-3-methylpyridinium Chloride. Bethesda, MD: National Library of Medicine. https://pubchem.ncbi.nlm.nih.gov/compound/19876500
135. National Center for Biotechnology Information (NCBI). PubChem Compound Summary for CID 2734171, n-Butylpyridinium chloride. Bethesda, MD: National Library of Medicine. https://pubchem.ncbi.nlm.nih.gov/compound/2734171
136. Arning J, Stolte S, Böschen A, Stock F, Pitner W-R, Welz-Biermann U, Jastorff B, Ranke J. Qualitative and quantitative structure activity relationships for the inhibitory effects of cationic head groups, functionalised side chains and anions of ionic liquids on acetylcholinesterase. Green Chem. 2008; 10(1):47-58. DOI: 10.1039/B712109A
137. Stolte S, Arning J, Bottin-Weber U, Müller A, Pitner W-R, Welz-Biermann U, Jastorff B, Ranke J. Effects of different head groups and functionalised side chains on the cytotoxicity of ionic liquids. Green Chem. 2007; 9(7):760-767. DOI: 10.1039/B615326G
138. Zeiger E, Anderson B, Haworth S, Lawlor T, Mortelmans K. Salmonella mutagenicity tests: V. Results from the testing of 311 chemicals. Environ Mol Mutagen. 1992; 19 Suppl 21:2-141. DOI: 10.1002/em.2850190603 PubMed: 1541260
139. Witt KL, Livanos E, Kissling GE, Torous DK, Caspary W, Tice RR, Recio L. Comparison of flow cytometry- and microscopy-based methods for measuring micronucleated reticulocyte frequencies in rodents treated with nongenotoxic and genotoxic chemicals. Mutat Res. 2008; 649(1-2):101-113. DOI: 10.1016/j.mrgentox.2007.08.004 PubMed: 17869571
140. Dertinger SD, Camphausen K, MacGregor JT, Bishop ME, Torous DK, Avlasevich S, Cairns S, Tometsko CR, Menard C, Muanza T. Three‐color labeling method for flow cytometric measurement of cytogenetic damage in rodent and human blood. Environ Mol Mutagen. 2004; 44(5):427-435. DOI: 10.1002/em.20075 PubMed: 15517570
141. Kissling GE, Dertinger SD, Hayashi M, MacGregor JT. Sensitivity of the erythrocyte micronucleus assay: Dependence on number of cells scored and inter-animal variability. Mutat Res. 2007; 634(1-2):235-240. DOI: 10.1016/j.mrgentox.2007.07.010 PubMed: 17851117
Appendices
Appendix A. Chemical Characterization and Dose Formulation Studies
A.1. Procurement and Characterization of Ionic Liquids
A.1.1. 1-Ethyl-3-Methylimidazolium Chloride (Emim-Cl)
1‐Ethyl‐3‐methylimidazolium chloride (Emim-Cl) was obtained from Sigma-Aldrich (St. Louis, MO) in three lots (S37784, S46787, and STBB3624). Identity, purity, and stability analyses were conducted by the analytical chemistry laboratory at MRIGlobal (Kansas City, MO). Reports on analyses performed in support of the ionic liquid (IL) studies are on file at the National Institute of Environmental Health Sciences (NIEHS).
Lot S37784 of Emim-Cl was a faint yellow solid, lot S46787 was a brown solidified mass, and lot STBB3624 was a yellow-brown solid. The chemical identity was confirmed using infrared (IR) and 1H nuclear magnetic resonance (NMR) spectroscopies. The IR and 1H NMR spectra (Figure A-1, Figure A-2, Figure A-3) were consistent with reference spectra (SDBSWeb: https://sdbs.db.aist.go.jp, National Institute of Advanced Industrial Science and Technology, accessed November 1, 2010) and the anticipated structure of Emim-Cl. In addition, mass spectrometry (MS) and elemental analysis were performed to aid in chemical identity confirmation. Mass spectra supported the presence of the cation [Emim]+ at m/z 111.0 for lot S37784, m/z 111.1 for lot S46787, and m/z 111.0 for lot STBB3624. Elemental analysis was performed by Prevalere Life Sciences, Inc. (Whitesboro, NY). The relative amounts of carbon, hydrogen, nitrogen, and chlorine for lot S37784 (49.01%, 7.46%, 18.60%, and 24.17%), lot S46787 (49.17%, 7.82%, 18.81%, and 24.37%), and lot STBB3624 (47.27%, 7.86%, 17.66%, and 22.19%) were within 2% of the theoretical values.
The moisture content of lots S37784, S46787, and STBB3624 was determined by Karl Fischer titration. The purity profiles of the three lots were determined using high-performance liquid chromatography (HPLC) with evaporative light scattering detection (ELSD) and HPLC with ultraviolet (UV) detection. Chloride content of each lot was quantified using ion chromatography (IC). Weight loss on drying was attempted to determine volatile content, but constant weight of the test article could not be achieved due to its hygroscopic nature. The volatile content was determined by headspace gas chromatography (GC/headspace) with flame ionization detection (FID) for lot STBB3624.
For lot S37784, Karl Fischer titration yielded a water content of approximately 0.2%. This value is an estimate due to the hygroscopic nature of the compound. No impurities were detected in lot S37784 with HPLC/ELSD (Table A-1, System D). The IC analysis determined the chloride concentration for lot S37784 to be 23.80% ± 0.14(sd)% (sd = standard deviation) (Table A-1, System F). The overall purity of the lot was determined to be >99%. Lot S37784 was reanalyzed at 20 months after the first analysis using HPLC/UV (Table A-1, System B), and the purity was determined to be 99.0% ± 0.9(sd)%.
For lot S46787, Karl Fischer titration yielded a water content of approximately 0.6%. No impurities were detected in lot S46787 with HPLC/ELSD (Table A-1, System D). The IC analysis determined the chloride concentration for lot S46787 to be 23.50% ± 0.08(sd)% (Table A-1, System F). The overall purity of the test article was >99%.
For lot STBB3624, Karl Fischer titration yielded a water content of approximately 1.1%. No impurities were detected in lot STBB3624 with HPLC/ELSD (Table A-1, System C). The IC analysis determined the chloride concentration for lot STBB3624 to be 22.26% ± 0.33(sd)% (Table A-1, System G). The GC/headspace analysis for residual solvent content determined that acetonitrile, isopropanol, and ethyl acetate were not present at concentrations >0.001% (Table A-2, System H). The overall purity of the lot was determined to be >99%. The purity of lot STBB3624 was reevaluated prior to use in the 3-month study using HPLC/UV (Table A-1, System B) and determined to be 101.0% ± 0.5(sd)% relative to a frozen reference sample of the same lot.
Accelerated stability studies of Emim-Cl were conducted on samples of lot STBB3624 stored under an inert headspace in amber glass vials sealed with Teflon-lined screw-top lids at frozen (−20°C), refrigerated (5°C), room (25°C), and elevated (60°C) temperatures. After 2 weeks, samples were analyzed by HPLC/UV (Table A-1, System B). Stability of the bulk chemical was confirmed for at least 2 weeks when stored under an inert headspace and protected from light at temperatures from −20°C to 60°C.
The two bottles of lot S37784 were completely melted and thoroughly blended. They were then transferred into amber glass bottles and sealed with an inert gas headspace and Teflon-lined lids. A single drum of lot STBB3624 was completely melted, thoroughly blended, and transferred into wide-mouth amber glass bottles and sealed with an inert gas headspace and Teflon-lined lids. All containers were then placed in two plastic bags with the outermost bag containing Drierite desiccant and stored under inert gas at room temperature.
A.1.2. 1-Butyl-3-Methylimidazolium Chloride (Bmim-Cl)
1-Butyl-3-methylimidazolium chloride (Bmim-Cl) was obtained from Solvent Innovations (Koln, Germany) in a single lot (99/787) and from Sigma-Aldrich (St. Louis, MO) in a single lot (STBB3444). Identity, purity, and stability analyses were conducted by the analytical chemistry laboratory at MRIGlobal (Kansas City, MO). Reports on analyses performed in support of the IL studies are on file at NIEHS.
Lot 99/787 of Bmim-Cl was a pale amber solid in 1- to 4-inch pieces, and lot STBB3444 was a solid white mass with small orange streaks. The lot identities were confirmed using IR and 1H NMR spectroscopies. The IR and 1H NMR spectra (Figure A-4, Figure A-5, Figure A-6) were consistent with the proposed structure. No reference spectra were available for comparison. In addition, MS and elemental analysis were performed to aid in chemical identity confirmation. Mass spectra supported the presence of the cation [Bmim]+ at m/z 139.0 for lot 99/787 and m/z 139.1 for lot STBB3444. Elemental analysis was performed by Prevalere Life Sciences, Inc. (Whitesboro, NY). The relative amounts of carbon, hydrogen, nitrogen, and chlorine for lot 99/787 (54.64%, 8.91%, 15.83%, and 19.91%) and lot STBB3444 (53.72%, 8.71%, 14.98%, and 18.92%) were within 2% of the theoretical values.
The moisture content of lots 99/787 and STBB3444 was determined by Karl Fischer titration. The purity profiles of lots 99/787 and STBB3444 were determined using HPLC/ELSD and HPLC/UV, and the chloride content was quantified using IC. The volatile content was determined by GC/headspace with FID for lot STBB3444.
For lot 99/787, Karl Fischer titration yielded a water content of approximately 0.5%. This value is an estimate due to the hygroscopic nature of the compound. No impurities were detected in lot 99/787 with HPLC/ELSD (Table A-1, System C). The IC analysis determined the percent chloride concentration for lot 99/787 to be 20.01% ± 0.02(sd)% and detected no bromide (Table A-1, System G). Weight loss on drying was attempted to determine volatile content for lot 99/787, but constant weight of the test article could not be achieved due to its hygroscopic nature. The overall purity of lot 99/787 was determined to be >99%. Lot 99/787 was reanalyzed 26 months later using HPLC/UV (Table A-1, System B) and determined to be 98.6% ± 0.5(
For lot STBB3444, Karl Fischer titration yielded a water content of approximately 0.7%. No significant response was obtained from the test article with HPLC/UV detection at 240 nm (Table A-1, System A). No impurities ≥0.05% were detected in lot STBB3444 with HPLC/ELSD (Table A-1, System C). The IC analysis determined the percent chloride concentration for lot STBB3444 to be 19.28% ± 0.43(sd)% (Table A-1, System G). The GC/headspace analysis for residual solvent content determined that acetonitrile, isopropanol, and ethyl acetate were not present at concentrations >0.001% (Table A-2, System H). The overall purity of lot STBB3444 was determined to be >99%. The purity of lot STBB3444 was reevaluated prior to use in the 3-month study using HPLC/UV (Table A-1, System B) and determined to be 101.4% ± 2.0(sd)% relative to a frozen reference sample of the same lot.
Accelerated stability studies of Bmim-Cl were conducted on samples of lot STBB3444 stored under an inert headspace in amber glass vials sealed with Teflon-lined screw-top lids at frozen (−20°C), refrigerated (5°C), room (25°C), and elevated (60°C) temperatures. After 2 weeks, samples were analyzed by HPLC/UV (Table A-1, System B). Stability of the bulk chemical was confirmed for at least 2 weeks when stored under an inert headspace and protected from light at temperatures from −20°C to 60°C.
Lot 99/787 was completely melted, thoroughly blended, and then stored in secondary containment under an inert atmosphere at room temperature. Lot STBB3444 also was completely melted and then thoroughly blended. After homogenization, it was transferred into wide-mouth amber glass bottles and sealed with an inert gas headspace and Teflon-lined lids. All containers were then placed in two plastic bags with the outermost bag containing Drierite desiccant stored under inert gas at room temperature.
A.1.3. 1-Butyl-1-Methylpyrrolidinium Chloride (Bmpy-Cl)
1-Butyl-1-methylpyrrolidinium chloride (Bmpy-Cl) was obtained from Solvent Innovations (Koln, Germany) in a single lot (99/831) and from Promy Chemical, Inc. (El Sobrante, CA) in a single lot (20100610). Identity, purity, and stability analyses were conducted by the analytical chemistry laboratory at MRIGlobal (Kansas City, MO). Reports on analyses performed in support of the IL studies are on file at NIEHS.
Lot 99/831 of Bmpy-Cl was a white chunky powder, and lot 20100610 was a pale-yellow crystalline powder. The chemical identity was confirmed using IR and 1H NMR spectroscopies. The IR and 1H NMR spectra (Figure A-7, Figure A-8, Figure A-9) were consistent with the proposed structure. No reference spectra were available for comparison. In addition, MS and elemental analysis were performed to confirm chemical identity. Mass spectra supported the presence of the cation [Bmpy]+ at m/z 141.9 for lot 99/831 and at m/z 142.1 for lot 20100610. Elemental analysis was performed by Prevalere Life Sciences, Inc. (Whitesboro, NY). The relative amounts of carbon, hydrogen, nitrogen, and chlorine for lot 99/831 (60.29%, 11.66%, 7.78%, and 19.97%) and lot 20100610 (60.43%, 11.26%, 7.50%, and 20.67%) were within 1% of the theoretical values.
The moisture content of lots 99/831 and 20100610 was determined by Karl Fischer titration, and the purity profiles of both lots were determined using HPLC/ELSD and HPLC with charged aerosol detection (CAD). Chloride content was quantified using IC. The volatile content was determined by weight loss on drying for lot 99/831 and GC/headspace with FID for lot 20100610.
For lot 99/831, Karl Fischer titration yielded a water content of approximately 0.5%. This value is an estimate due to the hygroscopic nature of the compound. No impurities were detected in lot 99/831 with HPLC/ELSD (Table A-1, System C). The IC analysis determined the percent chloride concentration for lot 99/831 to be 19.71% ± 0.27(sd)% and detected no bromide (Table A-1, System G). Weight loss on drying determined a volatile content for lot 99/831 of 0.75% ± 0.12(
For lot 20100610, Karl Fischer titration yielded a water content of approximately 1.2%. No impurities ≥0.05% were detected in lot 20100610 with HPLC/ELSD (Table A-1, System C). The IC analysis determined the chloride concentration for lot 20100610 to be 19.16% ± 0.65(sd)% (Table A-1, System G). The GC/headspace analysis for residual solvent content determined that acetonitrile, isopropanol, and ethyl acetate were not present at concentrations >0.001% (Table A-2, System H). The overall purity of lot 20100610 was determined to be >98%. The purity of lot 20100610 was reevaluated prior to use in the 3-month study using HPLC/CAD (Table A-1, System E) and determined to be 99.9% ± 0.3(sd)% relative to a frozen reference sample of the same lot.
Accelerated stability studies of Bmpy-Cl were conducted on samples of lot 20100610 stored under an inert headspace in amber glass vials sealed with Teflon-lined screw-top lids at frozen (−20°C), refrigerated (5°C), room (25°C), and elevated (60°C) temperatures. After 2 weeks, samples were analyzed by HPLC/ELSD (Table A-1, System D). Stability of the bulk chemical was confirmed for at least 2 weeks when stored under an inert headspace and protected from light at temperatures from −20°C to 60°C.
Details of the homogenization of lot 99/831 were not reported. Lot 99/831 was stored at room temperature under inert gas. Lot 20100610 was manually blended by hand kneading the unopened Mylar bag containing the bulk material for 3 to 4 minutes. After homogenization, the material was transferred into wide-mouth amber glass bottles and sealed with an inert gas headspace and Teflon-lined lids. All containers were then placed in two plastic bags with the outermost bag containing Drierite desiccant and stored at room temperature.
A.1.4. N-Butylpyridinium Chloride (NBuPy-Cl)
N-Butylpyridinium chloride (NBuPy-Cl) was obtained from Solvent Innovations (Koln, Germany) in a single lot (99/830) and from Promy Chemical, Inc. (El Sobrante, CA) in a single lot (20100610). Identity, purity, and stability analyses were conducted by the analytical chemistry laboratory at MRIGlobal (Kansas City, MO). Reports on analyses performed in support of the IL studies are on file at NIEHS.
Lot 99/830 of NBuPy-Cl was an off-white solid with a peach hue, and lot 20100610 was a pale-yellow crystalline powder. The chemical identity was confirmed using IR and 1H NMR spectroscopies. The IR and 1H NMR spectra (Figure A-10, Figure A-11, Figure A-12) were consistent with the proposed structure. No reference IR spectra were available for comparison; the 1H spectrum was consistent with a reference spectrum (SDBSWeb: https://sdbs.db.aist.go.jp, National Institute of Advanced Industrial Science and Technology, accessed November 1, 2010). In addition, MS and elemental analysis were performed to aid in chemical identity confirmation. Mass spectra supported the presence of the cation [NBuPy]+ at m/z 135.9 for lot 99/830 and at m/z 136.1 for lot 20100610. Elemental analysis was performed by Prevalere Life Sciences, Inc. (Whitesboro, NY). The relative amounts of carbon, hydrogen, nitrogen, and chlorine for lot 99/830 (62.75%, 8.31%, 7.99%, and 20.57%) and lot 20100610 (62.66%, 8.21%, 7.72%, and 20.49%) were within 1% of the theoretical values.
The moisture content of lots 99/830 and 20100610 was determined by Karl Fischer titration. The purity profiles of lots 99/830 and 20100610 were determined using HPLC/UV and HPLC/ELSD, and the chloride content was quantified using IC. The volatile content was determined by GC/headspace with FID for lot 20100610.
For lot 99/830, Karl Fischer titration yielded a water content of approximately 0.3%. This value is an estimate due to the hygroscopic nature of the compound. Purity of the test article with HPLC/UV was 99.23%, with one reportable impurity of 0.61% (Table A-1, System A). No impurities were detected in lot 99/830 with HPLC/ELSD (Table A-1, System C). The IC analysis determined the chloride concentration for lot 99/830 to be 20.47% ± 0.13(sd)% and detected no bromide (Table A-1, System G). Weight loss on drying was attempted to determine volatile content for lot 99/830, but constant weight of the test article could not be achieved due to its hygroscopic nature. The purity of lot 99/830 was reevaluated prior to use in the 3-month study using HPLC/UV (Table A-1, System B) and determined to be 101.1% ± 2.3(sd)% relative to a frozen reference sample of the same lot. The overall purity was >99%.
For lot 20100610, Karl Fischer titration yielded a water content of approximately 0.5%. Purity of the test article with HPLC/UV detection was 99.27%, with one impurity of 0.73% (Table A-1, System A). No impurities were detected in lot 20100610 with HPLC/ELSD (Table A-1, System C). The IC analysis determined the chloride concentration for lot 20100610 to be 20.25% ± 0.11(sd)% (Table A-1, System G). The GC/headspace analysis for residual solvent content detected six impurities using two procedures (Table A-2, System I, System J). Two of these were identified as methanol (<0.01%) and pyridine (0.3%). The test material was further analyzed for impurities with GC/MS (Table A-2, System K). Two more impurities were tentatively identified as ethyl ether and 1-chlorobutane on the basis of the observed mass spectra. The overall purity of the lot was determined to be >98%. The purity of lot 20100610 was reevaluated prior to use in the 3-month study using HPLC/UV (Table A-1, System B) and determined to be 100.6% ± 0.7(sd)% relative to a frozen reference sample of the same lot.
Accelerated stability studies of NBuPy-Cl were conducted on samples of lot 20100610 stored under an inert headspace in amber glass vials sealed with Teflon-lined screw-top lids at frozen (−20°C), refrigerated (5°C), room (25°C), and elevated (60°C) temperatures. After 2 weeks, samples were analyzed by HPLC/UV (Table A-1, System B). Stability of the bulk chemical was confirmed for at least 2 weeks when stored under an inert headspace and protected from light at temperatures from −20°C to 60°C.
Lot 99/830 was blended manually by shaking the bottle vigorously prior to opening to ensure homogeneity and was stored under inert gas at room temperature. The original bulk material in a Mylar bag (containing inner Mylar bags) of lot 20100610 was manually blended for 3 to 4 minutes by hand kneading the unopened bag. After homogenization, the bulk material of lot 20100610 was transferred into wide-mouth amber glass bottles and sealed with an inert gas headspace and Teflon-lined lids. All containers were then placed in two plastic bags with the outermost bag containing Drierite desiccant and stored at room temperature.
A.2. Preparation and Analysis of Dose Formulations
A.2.1. Two-week Studies
The dose formulations for the 2-week study were prepared once at MRIGlobal (Kansas City, MO) by mixing Emim-Cl, Bmim-Cl, Bmpy-Cl, or NBuPy-Cl with tap water to give the required concentrations (Table A-3). Dose formulations of Emim-Cl were prepared at concentrations of 3, 10, and 30 mg/mL with lot S37784 and 100 mg/mL with a combination of lots S37784 and S46787. Dose formulations of Bmim-Cl were prepared at concentrations of 0.3, 1, 3, and 6 mg/mL with lot 99/787. Dose formulations of Bmpy-Cl were prepared at concentrations of 1, 3, 6, and 10 mg/mL with lot 99/831. Dose formulations of NBuPy-Cl were prepared at concentrations of 0, 1, 3, and 6 mg/mL with lot 99/830. All dose formulations were stored protected from light at refrigerated temperatures (2°C–8°C) for up to 7 days until shipment to the study laboratory (BioReliance, Rockville, MD). At the study laboratory, all dose formulations were stored protected from light in a plastic carboy at refrigerated temperatures (2°C–8°C) and used within 42 days.
The homogeneity and stability of the dose formulations for lots S37784 (Emim-Cl), 99/787 (Bmim-Cl), 99/831 (Bmpy-Cl), and 99/830 (NBuPy-Cl) were determined by the analytical laboratory using HPLC/UV or HPLC/ELSD (Table A-1, Systems B, B, D, and B, respectively). Homogeneity was confirmed for the highest and lowest dose formulations of each ionic liquid. Dose formulations were considered stable if the measured concentrations were statistically no different from day 0 concentrations using the test variability limit statistical analysis. The storage stability of the 3 mg/mL Emim-Cl dose formulation was confirmed when protected from light for ≤35 days at room temperature, ≤21 days under refrigeration, and for ≤7 days under simulated animal room temperature. Storage stability of 0.3 mg/mL Bmim-Cl and 1 mg/mL Bmpy-Cl dose formulations were confirmed for ≤42 days at room and refrigerated temperatures and for ≤7 days under simulated animal room conditions. The storage stability of 1 mg/mL NBuPy-Cl dose formulation was confirmed for ≤35 days at room and refrigerated temperatures and for ≤4 days under simulated animal room conditions.
Analyses of preadministration and postadministration dose formulations for the 2-week studies of Emim-Cl, Bmim-Cl, and NBuPy-Cl were conducted once for each study by MRIGlobal analytical chemistry laboratory using HPLC/UV (Table A-1, System B). HPLC/ELSD (Table A-1, System D) was used to conduct analysis of preadministration and postadministration dose formulations of Bmpy-Cl. Postadministration dose formulation analysis results are averages from animal room drinking water bottles and bulk containers. All dose formulations were within 10% of the target concentrations for all four chemicals (Emim-Cl [Table A-5], Bmim-Cl [Table A-8], Bmpy-Cl [Table A-11], and NBuPy-Cl [Table A-14]). The pH of Emim-Cl and Bmpy-Cl dose formulations were measured postadministration and are reported in Table A-17 and Table A-18, respectively.
A.2.2. Three-month Studies
The dose formulations for the 3-month studies were prepared at the Battelle study laboratory (Columbus, OH) by mixing Emim-Cl, Bmim-Cl, Bmpy-Cl, or NBuPy-Cl with tap water to give the required concentrations for each species (Table A-4). Dose formulations of Emim-Cl were prepared at four concentrations of 0, 1, 3, and 10 mg/mL for the rat study and 0, 3, 10, and 30 mg/mL for the mouse study with lot STBB3624. Dose formulations of Bmim-Cl were prepared at four concentrations of 0, 0.1, 0.3, and 1 mg/mL for the rat study and 0, 0.3, 1, and 3 mg/mL for the mouse study with lot STBB3444. Dose formulations of Bmpy-Cl were prepared at five concentrations of 0, 0.3, 1, 3, and 6 mg/mL for the rat study and 0, 1, 3, 6, and 10 mg/mL for the mouse study with lot 20100610. Dose formulations of NBuPy-Cl were prepared at four concentrations of 0, 0.3, 1, and 3 mg/mL for the rat study and 0, 1, 3, and 6 mg/mL for the mouse study with lot 20100610. The formulations were stored protected from light in a plastic carboy at refrigerated temperatures (2°C–8°C). Emim-Cl and NBuPy-Cl formulations were used within 35 days of preparation, and Bmim-Cl and Bmpy-Cl formulations were used within 42 days of preparation.
The storage stability of 1 mg/mL Emim-Cl, 0.1 mg/mL Bmim-Cl, and 0.3 mg/mL NBuPy-Cl dose formulations at refrigerated and room temperatures were analyzed by the study laboratory using HPLC/UV (Table A-1, System B). HPLC/CAD (Table A-1, System E) was used to conduct similar analyses of 0.3 mg/mL Bmpy-Cl dose formulations. Dose formulations were considered stable if the measured concentrations were within 10% of the day 0 concentrations and no signs of degradation were detected in the chromatograms. All four IL dose formulations were considered stable for ≤42 days when stored refrigerated or at room temperature, protected from light.
Analyses of preadministration and postadministration dose formulations for the 3-month studies of Emim-Cl, Bmim-Cl, and NBuPy-Cl were conducted once after each new formulation preparation at the Battelle study laboratory using HPLC/UV (Table A-1, System B). HPLC/CAD (Table A-1, System E) was used to conduct similar analyses of the dose formulations for the 3-month study of Bmpy-Cl. All preadministration dose formulations for all four chemicals were within 10% of the target concentrations. All animal room samples for Emim-Cl (Table A-6, Table A-7) and Bmim-Cl (Table A-9, Table A-10) were within 10% of the target concentrations. All animal room samples for Bmpy-Cl (Table A-12, Table A-13) were within 10% of the target concentrations, with the exception of three samples for the rat study and five samples for the mouse study. For the rat study, one 0.3 mg/mL formulation was 14.0% and 15.8% above target for the animal room and carboy samples, respectively, and one 1 mg/mL formulation was 10.7% above target for the carboy sample. For the mouse study, two 10 mg/mL formulations were 11.7% and 12.3% above target in the animal room and 13.7% and 14.3% above target in the carboys. Additionally, one 1 mg/mL formulation was 10.7% above target for the carboy sample. All animal room samples for NBuPy-Cl (Table A-15, Table A-16) were within 10% of the target concentrations, with the exception of one carboy sample for the rat study, which was 13.1% above the target concentration of 0.3 mg/mL.
Table A-1. Liquid and Ion Chromatography Systems Used in the Two-week and Three-month Drinking Water Studies of Ionic Liquids
| Chromatography | Detection System | Column | Mobile Phase |
|---|---|---|---|
| High-performance liquid chromatography systems | |||
| System A | |||
| High-performance liquid chromatography | Ultraviolet (240 nm) | Supelco Discovery Cyano (150 mm × 4.6 mm ID, 5 μm particle size) | A: Acetonitrile B: Aqueous ~33 mM ammonium acetate, acidified with acetic acid to pH ~4.0 Gradient program: A:B Isocratic 85:15, 0.8 mL/min flow rate |
| System B | |||
| High-performance liquid chromatography | Ultraviolet (210 nm) | Supelco Discovery Cyano (150 mm × 4.6 mm ID, 5 μm particle size) | A: Acetonitrile B: Aqueous ~40 mM ammonium acetate with 0.5% acetic acid Gradient program: A:B Isocratic 90:10, 0.8–1.0 mL/min flow rate |
| System C | |||
| High-performance liquid chromatography | Evaporative light scattering | Supelco Discovery Cyano (150 mm × 4.6 mm ID, 5 μm particle size) | A: Acetonitrile B: Aqueous ~33 mM ammonium acetate, acidified with acetic acid to pH ~4.0 Gradient program: A:B Isocratic 85:15, 0.8 mL/min flow rate |
| System D | |||
| High-performance liquid chromatography | Evaporative light scattering | Supelco Discovery Cyano (150 mm × 4.6 mm ID, 5 μm particle size) | A: Acetonitrile B: Aqueous ~40 mM ammonium acetate, acidified with 0.5% acetic acid Gradient program: A:B Isocratic 90:10, 0.8–1.0 mL/min flow rate |
| System E | |||
| High-performance liquid chromatography | Charged aerosol detector | Supelco Discovery Cyano (150 mm × 4.6 mm ID, 5 μm particle size) | A: Acetonitrile B: ~40 mM Ammonium acetate with 0.5% acetic acid Gradient program: A:B Isocratic 90:10, 0.8 mL/min flow rate |
| Ion chromatography systems | |||
| System F | |||
| Ion chromatography | Conductivity | Transgenomic ICSep AN2 (250 mm × 4.6 mm ID) | Mobile Phase: Aqueous ~3.2 mM sodium carbonate and ~1.0 mM sodium bicarbonate, 1 mL/min flow rate External Water: ~0.5% Aqueous sulfuric acid, 4 mL/min flow rate |
| System G | |||
| Ion chromatography | Conductivity | Transgenomic ICSep AN2 (250 mm × 4.6 mm ID) with Transgenomic ICSep AN2 Guard (50 mm × 4.6 mm ID) | Mobile Phase: Aqueous ~3.2 mM sodium carbonate and ~1.0 mM sodium bicarbonate, 1 mL/min flow rate External Water: ~0.5% Aqueous sulfuric acid, 4 mL/min flow rate |
Table A-2. Gas Chromatography Systems Used in the Two-week and Three-month Drinking Water Studies of Ionic Liquids
| Detection System | Column | Carrier Gas | Oven Temperature Program |
|---|---|---|---|
| System H | |||
| Flame ionization (260°C) | Phenomenex Zebron ZB-624 (30 m × 0.53 mm ID, 3.0-μm film thickness) | Helium, 2.55 mL/min | 50°C for 6 min, then 8°C/min to 210°C, held for 4 min |
| System I | |||
| Flame ionization (250°C) | Rxi624SilMS (30 m × 0.32 mm ID, 1.8-μm film thickness) | Helium, 2.37 mL/min | 40°C for 20 min, then 10°C/min to 240°C, held for 20 min |
| System J | |||
| Flame ionization (250°C) | Stabilwax (30 m × 0.32 mm ID, 0.25-μm film thickness) | Helium, 2.46 mL/min | 50°C for 20 min, then 6°C/min to 165°C, held for 20 min |
| System K | |||
| Electron ionization mass spectrometry | Rxi-624Sil mS (30 m × 0.32 mm ID, 1.8-μm film thickness) | Helium, 3.3 mL/min | 40°C for 20 min, then 10°C/min to 240°C, held for 20 min |
Table A-3. Preparation and Storage of Dose Formulations in the Two-week Drinking Water Studies of Ionic Liquids
| Emim-Cl | Bmim-Cl | Bmpy-Cl | NBuPy-Cl |
|---|---|---|---|
| Preparation | |||
| The appropriate amount of test article was weighed and transferred into a 1-L volumetric flask. The contents were diluted to volume with tap water and mixed by inversion. The formulation was transferred to a 10-L plastic carboy. After using the same volumetric flask to weigh and transfer nine additional 1-L aliquots to the carboy, the 10-L formulation was mixed well. The doses were prepared once. | |||
| Chemical lot number | |||
| S37784 and S46787a | 99/787 | 99/831 | 99/830 |
| Maximum storage timeb | |||
| 42 days | |||
| Storage conditions | |||
| Plastic carboys covered with aluminum foil. Stored refrigerated at 2°C–8°C. | |||
| Analytical laboratory | |||
| MRIGlobal (Kansas City MO) | |||
| Study laboratory | |||
| BioReliance (Rockville, Maryland) | |||
Table A-4. Preparation and Storage of Dose Formulations in the Three-month Drinking Water Studies of Ionic Liquids
| Emim-Cl | Bmim-Cl | Bmpy-Cl | NBuPy-Cl |
|---|---|---|---|
| Preparation | |||
| An appropriate amount of vehicle (tap water) was added to the container holding the preweighed test article. The container was sealed, shaken, and mixed by sonication and/or vortexing until the contents were a solution. The solution was then transferred into a plastic carboy containing approximately half the required amount of vehicle. The test article container was rinsed with vehicle at least three times, and the rinses were transferred into the carboy. Approximately 90% of the final total vehicle volume was added to the carboy, and the formulation was stirred with an overhead stirrer. Approximately 200 mL was dispensed through the spigot into a beaker and poured back into the carboy. The beaker was rinsed with vehicle thoroughly, and the rinse was added into the carboy. The carboy was diluted to final volume with vehicle. The formulation was stirred with an overhead stirrer. | |||
| Chemical lot number | |||
| STBB3624 | STBB3444 | 20100610 | 20100610 |
| Maximum storage time | |||
| 35 days | 42 days | 42 days | 35 days |
| Storage conditions | |||
| Plastic carboys stored refrigerated at 2°C–8°C. | |||
| Study laboratory | |||
| Battelle (Columbus, OH) | |||
Table A-5. Results of Analyses of Dose Formulations Administered to Male and Female Rats and Mice in the Two-week Drinking Water Studies of 1-Ethyl-3-Methylimidazolium Chloride
| Date Prepared | Date Analyzeda | Target Concentration (mg/mL) | Determined Concentration (mg/mL)b | Difference from Target (%) |
|---|---|---|---|---|
| February 26, 2009 | March 4, 2009 | 3 | 3.0 ± 0.03 | −0.4 |
| 10 | 10.1 ± 0.1 | 1.2 | ||
| 30 | 30.8 ± 0.2 | 2.8 | ||
| 100 | 100.6 ± 0.9 | 0.6 | ||
| Animal room samples (rats)c | ||||
| February 26, 2009 | April 2, 2009 | 3 | 3.0 ± 0.0 | −0.8 |
| 10 | 10.0 ± 0.0 | −0.2 | ||
| 30 | 30.5 ± 0.2 | 1.6 | ||
| 100 | 100.1 ± 0.4 | 0.1 | ||
| Animal room samples (mice)c | ||||
| February 26, 2009 | April 2, 2009 | 3 | 3.0 ± 0.0 | −1.5 |
| 10 | 10.0 ± 0.0 | −0.3 | ||
| 30 | 30.3 ± 0.1 | 1.2 | ||
| 100 | 100.1 ± 0.6 | 0.1 | ||
Table A-6. Results of Analyses of Dose Formulations Administered to Male and Female Rats in the Three-month Drinking Water Study of 1-Ethyl-3-Methylimidazolium Chloride
| Date Prepared | Date Analyzed | Target Concentration (mg/mL) | Determined Concentration (mg/mL)a,b | Difference from Target (%) |
|---|---|---|---|---|
| April 19, 2013 | April 19, 2013 | 0 | BLOQ | NA |
| 1 | 0.999 ± 0.002 | −0.1 | ||
| 3 | 2.97 ± 0.01 | −0.9 | ||
| 10 | 10.2 ± 0.1 | 2.3 | ||
| June 4, 2013 | June 6, 2013 | 0 | BLOQ | NA |
| 1 | 1.00 ± 0.01 | 0.2 | ||
| 3 | 3.04 ± 0.00 | 1.3 | ||
| 10 | 10.0 ± 0.1 | 0.3 | ||
| July 15, 2013 | July 16, 2013 | 0 | BLOQ | NA |
| 1 | 0.992 ± 0.002 | −0.8 | ||
| 3 | 2.93 ± 0.01 | −2.5 | ||
| 10 | 10.1 ± 0.1 | 0.7 | ||
| Animal room samples | ||||
| April 19, 2013 (drinking water bottle) | May 24, 2013 | 0 | BLOQ | NA |
| 1 | 1.03 ± 0.00 | 3.0 | ||
| 3 | 3.03 ± 0.01 | 0.9 | ||
| 10 | 10.2 ± 0.1 | 2.3 | ||
| April 19, 2013 (carboy) | May 24, 2013 | 0 | BLOQ | NA |
| 1 | 1.03 ± 0.0 | 3.0 | ||
| 3 | 3.03 ± 0.01 | 1.1 | ||
| 10 | 10.3 ± 0.1 | 2.7 | ||
| June 4, 2013 (drinking water bottle) | July 9, 2013 | 0 | BLOQ | NA |
| 1 | 0.998 ± 0.002 | –0.2 | ||
| 3 | 3.03 ± 0.01 | 1.1 | ||
| 10 | 10.2 ± 0.1 | 1.7 | ||
| June 4, 2013 (carboy) | July 9, 2013 | 0 | BLOQ | NA |
| 1 | 0.986 ± 0.009 | –1.4 | ||
| 3 | 2.99 ± 0.01 | −0.2 | ||
| 10 | 10.0 ± 0.1 | 0.4 | ||
| July 15, 2013 (drinking water bottle) | August 9, 2013 | 0 | BLOQ | NA |
| 1 | 0.996 ± 0.007 | −0.4 | ||
| 3 | 2.95 ± 0.01 | −1.5 | ||
| 10 | 10.2 ± 0.0 | 2.0 | ||
| July 15, 2013 (carboy) | August 9, 2013 | 0 | BLOQ | NA |
| 1 | 1.01 ± 0.01 | 1.0 | ||
| 3 | 2.98 ± 0.02 | −0.7 | ||
| 10 | 10.2 ± 0.1 | 1.7 | ||
Table A-7. Results of Analyses of Dose Formulations Administered to Male and Female Mice in the Three-month Drinking Water Study of 1-Ethyl-3-Methylimidazolium Chloride
| Date Prepared | Date Analyzed | Target Concentration (mg/mL) | Determined Concentration (mg/mL)a,b | Difference from Target (%) |
|---|---|---|---|---|
| April 19, 2013 | April 19, 2013 | 0 | BLOQ | NA |
| 3 | 2.97 ± 0.01 | −0.9 | ||
| 10 | 10.2 ± 0.1 | 2.3 | ||
| 30 | 30.4 ± 0.1 | 1.4 | ||
| June 4, 2013 | June 6, 2013 | 0 | BLOQ | NA |
| 3 | 3.04 ± 0.00 | 1.3 | ||
| 10 | 10.0 ± 0.1 | 0.3 | ||
| 30 | 30.2 ± 0.2 | 0.7 | ||
| July 15, 2013 | July 16, 2013 | 0 | BLOQ | NA |
| 3 | 2.93 ± 0.01 | −2.5 | ||
| 10 | 10.1 ± 0.1 | 0.7 | ||
| 30 | 30.0 ± 0.1 | 0 | ||
| Animal room samples | ||||
| April 19, 2013 (drinking water bottle) | May 24, 2013 | 0 | BLOQ | NA |
| 3 | 3.04 ± 0.00 | 1.3 | ||
| 10 | 10.2 ± 0.1 | 1.7 | ||
| 30 | 31.3 ± 0.1 | 4.2 | ||
| April 19, 2013 (carboy) | May 24, 2013 | 0 | BLOQ | NA |
| 3 | 3.03 ± 0.01 | 1.1 | ||
| 10 | 10.3 ± 0.1 | 2.7 | ||
| 30 | 31.1 ± 0.1 | 3.7 | ||
| June 4, 2013 (drinking water bottle) | July 9, 2013 | 0 | BLOQ | NA |
| 3 | 2.99 ± 0.01 | −0.5 | ||
| 10 | 10.1 ± 0.1 | 0.7 | ||
| 30 | 29.6 ± 0.2 | −1.4 | ||
| June 4, 2013 (carboy) | July 9, 2013 | 0 | BLOQ | NA |
| 3 | 2.99 ± 0.01 | −0.2 | ||
| 10 | 10.0 ± 0.1 | 0.4 | ||
| 30 | 29.3 ± 0.1 | −2.3 | ||
| July 15, 2013 (drinking water bottle) | August 9, 2013 | 0 | BLOQ | NA |
| 3 | 2.93 ± 0.01 | −2.2 | ||
| 10 | 10.2 ± 0.0 | 2 | ||
| 30 | 30.2 ± 0.2 | 0.6 | ||
| July 15, 2013 (carboy) | August 9, 2013 | 0 | BLOQ | NA |
| 3 | 2.98 ± 0.02 | −0.7 | ||
| 10 | 10.2 ± 0.1 | 1.7 | ||
| 30 | 30.1 ± 0.0 | 0.3 | ||
Table A-8. Results of Analyses of Dose Formulations Administered to Male and Female Rats and Mice in the Two-week Drinking Water Studies of 1-Butyl-3-Methylimidazolium Chloride
| Date Prepared | Date Analyzeda | Target Concentration (mg/mL) | Determined Concentration (mg/mL)b | Difference from Target (%) |
|---|---|---|---|---|
| February 25, 2009 | February 25, 2009 | 0.3 | 0.3 ± 0.0 | 5.1 |
| 1 | 1.0 ± 0.0 | 1.8 | ||
| 3 | 3.1 ± 0.0 | 3.0 | ||
| 6 | 6.2 ± 0.1 | 3.1 | ||
| Animal room samples (rats)c | ||||
| February 25, 2009 | April 6, 2009 | 0.3 | 0.3 ± 0.0 | 2.8 |
| 1 | 1.0 ± 0.0 | 0.0 | ||
| 3 | 3.0 ± 0.0 | 1.0 | ||
| 6 | NA | NA | ||
| Animal room samples (mice)c | ||||
| February 25, 2009 | April 6, 2009 | 0.3 | NA | NA |
| 1 | 1.0 ± 0.0 | −0.3 | ||
| 3 | 3.0 ± 0.0 | 0.9 | ||
| 6 | 5.9 ± 0.2 | −2.1 | ||
Table A-9. Results of Analyses of Dose Formulations Administered to Male and Female Rats in the Three-month Drinking Water Study of 1-Butyl-3-Methylimidazolium Chloride
| Date Prepared | Date Analyzed | Target Concentration (mg/mL) | Determined Concentration (mg/mL)a,b | Difference from Target (%) |
|---|---|---|---|---|
| April 15, 2013 | April 16, 2013 | 0 | BLOQ | NA |
| 0.1 | 0.0989 ± 0.0003 | −1.1 | ||
| 0.3 | 0.306 ± 0.000 | 2.0 | ||
| 1 | 0.999 ± 0.001 | −0.1 | ||
| May 6, 2013 | May 7, 2013 | 0 | BLOQ | NA |
| 0.1 | 0.0981 ± 0.0006 | −1.9 | ||
| 0.3 | 0.302 ± 0.000 | 0.7 | ||
| 1 | 1.02 ± 0.00 | 2.0 | ||
| June 17, 2013 | June 17, 2013 | 0 | BLOQ | NA |
| 0.1 | 0.102 ± 0.001 | 1.7 | ||
| 0.3 | 0.307 ± 0.001 | 2.2 | ||
| 1 | 1.03 ± 0.01 | 3.3 | ||
| Animal room samples | ||||
| April 15, 2013 (drinking water bottle) | May 17, 2013 | 0 | BLOQ | NA |
| 0.1 | 0.0991 ± 0.0001 | −0.9 | ||
| 0.3 | 0.312 ± 0.000 | 4.0 | ||
| 1 | 1.02 ± 0.00 | 2.0 | ||
| April 15, 2013 (carboy) | May 17, 2013 | 0 | BLOQ | NA |
| 0.1 | 0.0993 ± 0.0002 | −0.7 | ||
| 0.3 | 0.311 ± 0.001 | 3.5 | ||
| 1 | 1.02 ± 0.01 | 1.7 | ||
| May 6, 2013 (drinking water bottle) | June 7, 2013 | 0 | BLOQ | NA |
| 0.1 | 0.0953 ± 0.0005 | −4.7 | ||
| 0.3 | 0.301 ± 0.001 | 0.2 | ||
| 1 | 0.997 ± 0.001 | −0.3 | ||
| May 6, 2013 (carboy) | June 7, 2013 | 0 | BLOQ | NA |
| 0.1 | 0.0951 ± 0.0003 | −4.9 | ||
| 0.3 | 0.300 ± 0.000 | 0.0 | ||
| 1 | 0.994 ± 0.002 | −0.6 | ||
| June 17, 2013 (drinking water bottle) | July 26, 2013 | 0 | BLOQ | NA |
| 0.1 | 0.108 ± 0.001 | 7.7 | ||
| 0.3 | 0.329 ± 0.003 | 9.6 | ||
| 1 | 1.08 ± 0.01 | 8.3 | ||
| June 17, 2013 (carboy) | July 26, 2013 | 0 | BLOQ | NA |
| 0.1 | 0.106 ± 0.001 | 6.3 | ||
| 0.3 | 0.325 ± 0.001 | 8.5 | ||
| 1 | 1.08 ± 0.00 | 8.0 | ||
Table A-10. Results of Analyses of Dose Formulations Administered to Male and Female Mice in the Three-month Drinking Water Study of 1-Butyl-3-Methylimidazolium Chloride
| Date Prepared | Date Analyzed | Target Concentration (mg/mL) | Determined Concentration (mg/mL)a,b | Difference from Target (%) |
|---|---|---|---|---|
| April 15, 2013 | April 16, 2013 | 0 | BLOQ | NA |
| 0.3 | 0.306 ± 0.000 | 2.0 | ||
| 1 | 0.999 ± 0.001 | −0.1 | ||
| 3 | 2.92 ± 0.00 | −2.7 | ||
| May 6, 2013 | May 7, 2013 | 0 | BLOQ | NA |
| 0.3 | 0.302 ± 0.000 | 0.7 | ||
| 1 | 1.02 ± 0.00 | 2.0 | ||
| 3 | 3.06 ± 0.0 | 2.0 | ||
| June 17, 2013 | June 17, 2013 | 0 | BLOQ | NA |
| 0.3 | 0.307 ± 0.001 | 2.2 | ||
| 1 | 1.03 ± 0.01 | 3.3 | ||
| 3 | 3.14 ± 0.00 | 4.7 | ||
| Animal room samples | ||||
| April 15, 2013 (drinking water bottle) | May 17, 2013 | 0 | BLOQ | NA |
| 0.3 | 0.309 ± 0.001 | 2.9 | ||
| 1 | 1.02 ± 0.00 | 2.0 | ||
| 3 | 2.97 ± 0.01 | −0.9 | ||
| April 15, 2013 (carboy) | May 17, 2013 | 0 | BLOQ | NA |
| 0.3 | 0.311 ± 0.001 | 3.5 | ||
| 1 | 1.02 ± 0.01 | 1.7 | ||
| 3 | 2.98 ± 0.00 | −0.7 | ||
| May 6, 2013 (drinking water bottle) | June 7, 2013 | 0 | BLOQ | NA |
| 0.3 | 0.304 ± 0.000 | 1.3 | ||
| 1 | 1.00 ± 0.00 | 0.0 | ||
| 3 | 2.99 ± 0.01 | −0.5 | ||
| May 6, 2013 (carboy) | June 7, 2013 | 0 | BLOQ | NA |
| 0.3 | 0.300 ± 0.000 | 0.0 | ||
| 1 | 0.994 ± 0.002 | −0.6 | ||
| 3 | 2.98 ± 0.00 | −0.7 | ||
| June 17, 2013 (drinking water bottle) | July 26, 2013 | 0 | BLOQ | NA |
| 0.3 | 0.306 ± 0.000 | 2.0 | ||
| 1 | 1.02 ± 0.00 | 2.0 | ||
| 3 | 3.11 ± 0.01 | 3.5 | ||
| June 17, 2013 (carboy) | July 26, 2013 | 0 | BLOQ | NA |
| 0.3 | 0.325 ± 0.001 | 8.5 | ||
| 1 | 1.08 ± 0.00 | 8.0 | ||
| 3 | 3.12 ± 0.00 | 4.0 | ||
Table A-11. Results of Analyses of Dose Formulations Administered to Male and Female Rats and Mice in the Two-week Drinking Water Studies of 1-Butyl-1-Methylpyrrolidinium Chloride
| Date Prepared | Date Analyzeda | Target Concentration (mg/mL) | Determined Concentration (mg/mL)b | Difference from Target (%) |
|---|---|---|---|---|
| February 24, 2009 | March 2, 2009 | 1 | 1.1 ± 0.0 | 5.6 |
| 3 | 3.3 ± 0.0 | 10.0 | ||
| 6 | 6.4 ± 0.1 | 7.1 | ||
| 10 | 10.3 ± 0.1 | 3.2 | ||
| Animal room samples (rats)c | ||||
| February 24, 2009 | April 6, 2009 | 1 | 1.1 ± 0.0 | 5.6 |
| 3 | 3.3 ± 0.0 | 9.4 | ||
| 6 | 6.5 ± 0.1 | 8.1 | ||
| 10 | NA | NA | ||
| Animal room samples (mice)c | ||||
| February 24, 2009 | April 6, 2009 | 1 | NA | NA |
| 3 | 3.3 ± 0.0 | 9.1 | ||
| 6 | 6.3 ± 0.1 | 5.6 | ||
| 10 | 10.2 ± 0.1 | 2.2 | ||
Table A-12. Results of Analyses of Dose Formulations Administered to Male and Female Rats in the Three-month Drinking Water Study of 1-Butyl-1-Methylpyrrolidinium Chloride
| Date Prepared | Date Analyzed | Target Concentration (mg/mL) | Determined Concentration (mg/mL)a,b | Difference from Target (%) |
|---|---|---|---|---|
| August 5, 2013 | August 7, 2013 | 0 | BLOQ | NA |
| 0.3 | 0.292 ± 0.003 | −2.7 | ||
| 1 | 1.05 ± 0.01 | 5.3 | ||
| 3 | 3.08 ± 0.01 | 2.5 | ||
| 6 | 6.09 ± 0.08 | 1.5 | ||
| September 25, 2013 | September 26, 2013 | 0 | BLOQ | NA |
| 0.3 | 0.297 ± 0.003 | −0.9 | ||
| 1 | 1.03 ± 0.00 | 3.0 | ||
| 3 | 3.14 ± 0.02 | 4.6 | ||
| 6 | 6.07 ± 0.01 | 1.2 | ||
| October 18, 2013 | October 21, 2013 | 0 | BLOQ | NA |
| 0.3 | 0.293 ± 0.011 | −2.2 | ||
| 1 | 1.02 ± 0.00 | 2.0 | ||
| 3 | 3.06 ± 0.05 | 2.1 | ||
| 6 | 6.05 ± 0.09 | 0.8 | ||
| Animal room samples | ||||
| August 5, 2013 (drinking water bottle) | September 13, 2013 | 0 | BLOQ | NA |
| 0.3 | 0.299 ± 0.001 | −0.5 | ||
| 1 | 1.03 ± 0.00 | 3.0 | ||
| 3 | 2.96 ± 0.02 | −1.2 | ||
| 6 | 5.97 ± 0.03 | −0.5 | ||
| August 5, 2013 (carboy) | September 13, 2013 | 0 | BLOQ | NA |
| 0.3 | 0.301 ± 0.003 | 0.2 | ||
| 1 | 1.04 ± 0.01 | 4.3 | ||
| 3 | 3.01 ± 0.03 | 0.3 | ||
| 6 | 5.86 ± 0.08 | −2.4 | ||
| September 25, 2013 (drinking water bottle) | November 4, 2013 | 0 | BLOQ | NA |
| 0.3 | 0.342 ± 0.002 | 14 | ||
| 1 | 1.08 ± 0.01 | 7.7 | ||
| 3 | 3.13 ± 0.02 | 4.4 | ||
| 6 | 6.30 ± 0.02 | 5.0 | ||
| September 25, 2013 (carboy) | November 4, 2013 | 0 | BLOQ | NA |
| 0.3 | 0.347 ± 0.001 | 15.8 | ||
| 1 | 1.06 ± 0.01 | 6.3 | ||
| 3 | 3.15 ± 0.04 | 5.1 | ||
| 6 | 6.31 ± 0.02 | 5.2 | ||
| October 18, 2013 (drinking water bottle) | November 22, 2013 | 0 | BLOQ | NA |
| 0.3 | 0.317 ± 0.001 | 5.8 | ||
| 1 | 1.09 ± 0.00 | 9.0 | ||
| 3 | 3.18 ± 0.05 | 5.9 | ||
| 6 | 6.57 ± 0.03 | 9.6 | ||
| October 18, 2013 (carboy) | November 22, 2013 | 0 | BLOQ | NA |
| 0.3 | 0.321 ± 0.006 | 7.1 | ||
| 1 | 1.11 ± 0.01 | 10.7 | ||
| 3 | 3.24 ± 0.03 | 7.9 | ||
| 6 | 6.55 ± 0.04 | 9.1 | ||
Table A-13. Results of Analyses of Dose Formulations Administered to Male and Female Mice in the Three-month Drinking Water Study of 1-Butyl-1-Methylpyrrolidinium Chloride
| Date Prepared | Date Analyzed | Target Concentration (mg/mL) | Determined Concentration (mg/mL)a,b | Difference from Target (%) |
|---|---|---|---|---|
| August 5, 2013 | August 7, 2013 | 0 | BLOQ | NA |
| 1 | 1.05 ± 0.01 | 5.3 | ||
| 3 | 3.08 ± 0.01 | 2.5 | ||
| 6 | 6.09 ± 0.08 | 1.5 | ||
| 10 | 10.5 ± 0.2 | 5.3 | ||
| September 25, 2013 | September 26, 2013 | 0 | BLOQ | NA |
| 1 | 1.03 ± 0.00 | 3.0 | ||
| 3 | 3.14 ± 0.02 | 4.6 | ||
| 6 | 6.07 ± 0.01 | 1.2 | ||
| 10 | 10.7 ± 0.1 | 6.7 | ||
| October 18, 2013 | October 21, 2013 | 0 | BLOQ | NA |
| 1 | 1.02 ± 0.00 | 2.0 | ||
| 3 | 3.06 ± 0.05 | 2.1 | ||
| 6 | 6.05 ± 0.09 | 0.8 | ||
| 10 | 10.6 ± 0.1 | 6.3 | ||
| Animal room samples | ||||
| August 5, 2013 (drinking water bottle) | September 13, 2013 | 0 | BLOQ | NA |
| 1 | 1.02 ± 0.01 | 2.3 | ||
| 3 | 2.97 ± 0.01 | −1.0 | ||
| 6 | 6.06 ± 0.07 | 0.9 | ||
| 10 | 10.4 ± 0.0 | 4.0 | ||
| August 5, 2013 (carboy) | September 13, 2013 | 0 | BLOQ | NA |
| 1 | 1.04 ± 0.01 | 4.3 | ||
| 3 | 3.01 ± 0.03 | 0.3 | ||
| 6 | 5.86 ± 0.08 | −2.4 | ||
| 10 | 10.2 ± 0.1 | 2.3 | ||
| September 25, 2013 (drinking water bottle) | November 4, 2013 | 0 | BLOQ | NA |
| 1 | 1.08 ± 0.01 | 8.0 | ||
| 3 | 3.15 ± 0.02 | 5.1 | ||
| 6 | 6.19 ± 0.07 | 3.2 | ||
| 10 | 11.2 ± 0.1 | 11.7 | ||
| September 25, 2013 (carboy) | November 4, 2013 | 0 | BLOQ | NA |
| 1 | 1.06 ± 0.01 | 6.3 | ||
| 3 | 3.15 ± 0.04 | 5.1 | ||
| 6 | 6.31 ± 0.02 | 5.2 | ||
| 10 | 11.4 ± 0.1 | 13.7 | ||
| October 18, 2013 (drinking water bottle) | November 22, 2013 | 0 | BLOQ | NA |
| 1 | 1.07 ± 0.01 | 7.3 | ||
| 3 | 3.11 ± 0.06 | 3.7 | ||
| 6 | 6.36 ± 0.05 | 5.9 | ||
| 10 | 11.2 ± 0.1 | 12.3 | ||
| October 18, 2013 (carboy) | November 22, 2013 | 0 | BLOQ | NA |
| 1 | 1.11 ± 0.01 | 10.7 | ||
| 3 | 3.24 ± 0.03 | 7.9 | ||
| 6 | 6.55 ± 0.04 | 9.1 | ||
| 10 | 11.4 ± 0.1 | 14.3 | ||
Table A-14. Results of Analyses of Dose Formulations Administered to Male and Female Rats and Mice in the Two-week Drinking Water Studies of N-Butylpyridinium Chloride
| Date Prepared | Date Analyzeda | Target Concentration (mg/mL) | Determined Concentration (mg/mL)b,c | Difference from Target (%) |
|---|---|---|---|---|
| February 23, 2009 | February 23, 2009 | 0 | BLOQ | NA |
| 1 | 1.0 ± 0.0 | 1.6 | ||
| 3 | 3.0 ± 0.0 | −0.9 | ||
| 6 | 6.0 ± 0.1 | −0.3 | ||
| Animal room samples (rats)c | ||||
| February 23, 2009 | April 2, 2009 | 0 | BLOQ | NA |
| 1 | 1.0 ± 0.0 | 0.0 | ||
| 3 | 3.0 ± 0.0 | –0.3 | ||
| 6 | 6.0 ± 0.0 | 0.0 | ||
| Animal room samples (mice)d | ||||
| February 23, 2009 | April 2, 2009 | 0 | BLOQ | NA |
| 1 | 1.0 ± 0.0 | −0.4 | ||
| 3 | 3.0 ± 0.0 | –0.2 | ||
| 6 | 6.0 ± 0.0 | 0.2 | ||
Table A-15. Results of Analyses of Dose Formulations Administered to Male and Female Rats in the Three-month Drinking Water Study of N-Butylpyridinium Chloride
| Date Prepared | Date Analyzed | Target Concentration (mg/mL) | Determined Concentration (mg/mL)a,b | Difference from Target (%) |
|---|---|---|---|---|
| September 3, 2013 | September 3, 2013 | 0 | BLOQ | NA |
| 0.3 | 0.297 ± 0.001 | −1.0 | ||
| 1 | 1.02 ± 0.01 | 1.7 | ||
| 3 | 3.09 ± 0.02 | 2.9 | ||
| October 11, 2013 | October 14, 2013 | 0 | BLOQ | NA |
| 0.3 | 0.310 ± 0.002 | 3.2 | ||
| 1 | 1.07 ± 0.00 | 7.0 | ||
| 3 | 3.04 ± 0.02 | 1.4 | ||
| November 25, 2013 | December 2, 2013 | 0 | BLOQ | NA |
| 0.3 | 0.300 ± 0.005 | 0.1 | ||
| 1 | 1.01 ± 0.01 | 0.7 | ||
| December 3, 2013 | 3 | 3.04 ± 0.02 | 1.5 | |
| Animal room samples | ||||
| September 3, 2013 (drinking water bottle) | October 4, 2013 | 0 | BLOQ | NA |
| 0.3 | 0.305 ± 0.002 | 1.6 | ||
| 1 | 1.02 ± 0.01 | 2.3 | ||
| 3 | 3.06 ± 0.02 | 2.1 | ||
| September 3, 2013 (carboy) | October 4, 2013 | 0 | BLOQ | NA |
| 0.3 | 0.306 ± 0.002 | 2.1 | ||
| 1 | 1.03 ± 0.00 | 3.0 | ||
| 3 | 3.07 ± 0.02 | 2.5 | ||
| October 11, 2013 (drinking water bottle) | November 6, 2013 | 0 | BLOQ | NA |
| 0.3 | 0.300 ± 0.001 | 0.0 | ||
| 1 | 1.03 ± 0.01 | 2.7 | ||
| 3 | 3.07 ± 0.00 | 2.3 | ||
| October 11, 2013 (carboy) | November 6, 2013 | 0 | BLOQ | NA |
| 0.3 | 0.301 ± 0.002 | 0.2 | ||
| 1 | 1.05 ± 0.02 | 4.7 | ||
| 3 | 3.09 ± 0.04 | 2.9 | ||
| November 25, 2013 (drinking water bottle) | December 19, 2013 | 0 | BLOQ | NA |
| 0.3 | 0.328 ± 0.004 | 9.4 | ||
| 1 | 1.03 ± 0.00 | 3.0 | ||
| 3 | 3.07 ± 0.02 | 2.3 | ||
| November 25, 2013 (carboy) | December 19, 2013 | 0 | BLOQ | NA |
| 0.3 | 0.339 ± 0.001 | 13.1 | ||
| 1 | 1.03 ± 0.00 | 3.0 | ||
| 3 | 3.05 ± 0.01 | 1.6 | ||
Table A-16. Results of Analyses of Dose Formulations Administered to Male and Female Mice in the Three-month Drinking Water Study of N-Butylpyridinium Chloride
| Date Prepared | Date Analyzed | Target Concentration (mg/mL) | Determined Concentration (mg/mL)a,b | Difference from Target (%) |
|---|---|---|---|---|
| September 3, 2013 | September 3, 2013 | 0 | BLOQ | NA |
| 1 | 1.02 ± 0.01 | 1.7 | ||
| 3 | 3.09 ± 0.02 | 2.9 | ||
| 6 | 6.23 ± 0.03 | 3.8 | ||
| October 11, 2013 | October 14, 2013 | 0 | BLOQ | NA |
| 1 | 1.07 ± 0.00 | 7.0 | ||
| 3 | 3.04 ± 0.02 | 1.4 | ||
| 6 | 6.06 ± 0.01 | 1.1 | ||
| November 25, 2013 | December 2, 2013 | 0 | BLOQ | NA |
| 1 | 1.01 ± 0.01 | 0.7 | ||
| December 3, 2013 | 3 | 3.04 ± 0.02 | 1.5 | |
| 6 | 5.89 ± 0.25 | −1.9 | ||
| Animal room samples | ||||
| September 3, 2013 (drinking water bottle) | October 4, 2013 | 0 | BLOQ | NA |
| 1 | 1.02 ± 0.00 | 2.0 | ||
| 3 | 3.03 ± 0.08 | 1.0 | ||
| 6 | 6.21 ± 0.04 | 3.5 | ||
| September 3, 2013 (carboy) | October 4, 2013 | 0 | BLOQ | NA |
| 1 | 1.03 ± 0.00 | 3.0 | ||
| 3 | 3.07 ± 0.02 | 2.5 | ||
| 6 | 6.27 ± 0.01 | 4.6 | ||
| October 11, 2013 (drinking water bottle) | November 6, 2013 | 0 | BLOQ | NA |
| 1 | 1.03 ± 0.01 | 3.3 | ||
| 3 | 3.11 ± 0.02 | 3.8 | ||
| 6 | 6.16 ± 0.03 | 2.7 | ||
| October 11, 2013 (carboy) | November 6, 2013 | 0 | BLOQ | NA |
| 1 | 1.05 ± 0.02 | 4.7 | ||
| 3 | 3.09 ± 0.04 | 2.9 | ||
| 6 | 6.13 ± 0.04 | 2.2 | ||
| November 25, 2013 (drinking water bottle) | December 19, 2013 | 0 | BLOQ | NA |
| 1 | 1.01 ± 0.00 | 1.0 | ||
| 3 | 3.01 ± 0.01 | 0.4 | ||
| 6 | 6.00 ± 0.03 | −0.1 | ||
| November 25, 2013 (carboy) | December 19, 2013 | 0 | BLOQ | NA |
| 1 | 1.03 ± 0.00 | 3.0 | ||
| 3 | 3.05 ± 0.01 | 1.6 | ||
| 6 | 6.03 ± 0.07 | 0.4 | ||
Table A-17. Results of pH Analyses of Dose Formulations Administered to Male and Female Rats and Mice in the Two-week Drinking Water Studies of 1-Ethyl-3-Methylimidazolium Chloride
| Target Concentration (mg/mL) | Species | Precipitate Observed in One or More Samples | Average pH Across Measured Samplesa |
|---|---|---|---|
| 3 | Rats | No | 8.7 ± 0.3 |
| 10 | Rats | No | 8.1 ± 0.0 |
| 30 | Rats | No | 7.3 ± 0.4 |
| 100 | Rats | No | 7.1 ± 0.0 |
| 3 | Mice | No | 8.3 ± 0.3 |
| 10 | Mice | No | 7.9 ± 0.1 |
| 30 | Mice | No | 7.7 ± 0.1 |
| 100 | Mice | No | 7.1 ± 0.0 |
Table A-18. Results of pH Analyses of Dose Formulations Administered to Male and Female Rats and Mice in the Two-week Drinking Water Studies of 1-Butyl-1-Methylpyrrolidinium Chloride
| Target Concentration (mg/mL) | Species | Precipitate Observed in One or More Samples | Average pH Across Measured Samplesa |
|---|---|---|---|
| 1 | Rats | No | 9.1 ± 0.5 |
| 3 | Rats | No | 8.4 ± 0.1 |
| 6 | Rats | No | 8.5 ± 0.3 |
| 3 | Mice | Yes | 8.3 ± 0.1 |
| 6 | Mice | Yes | 8.5 ± 0.1 |
| 10 | Mice | Yes | 8.9 ± 0.3 |
Figure A-1. Infrared Absorption Spectrum of 1-Ethyl-3-Methylimidazolium Chloride (Lot S37784), Nujol Mineral Oil
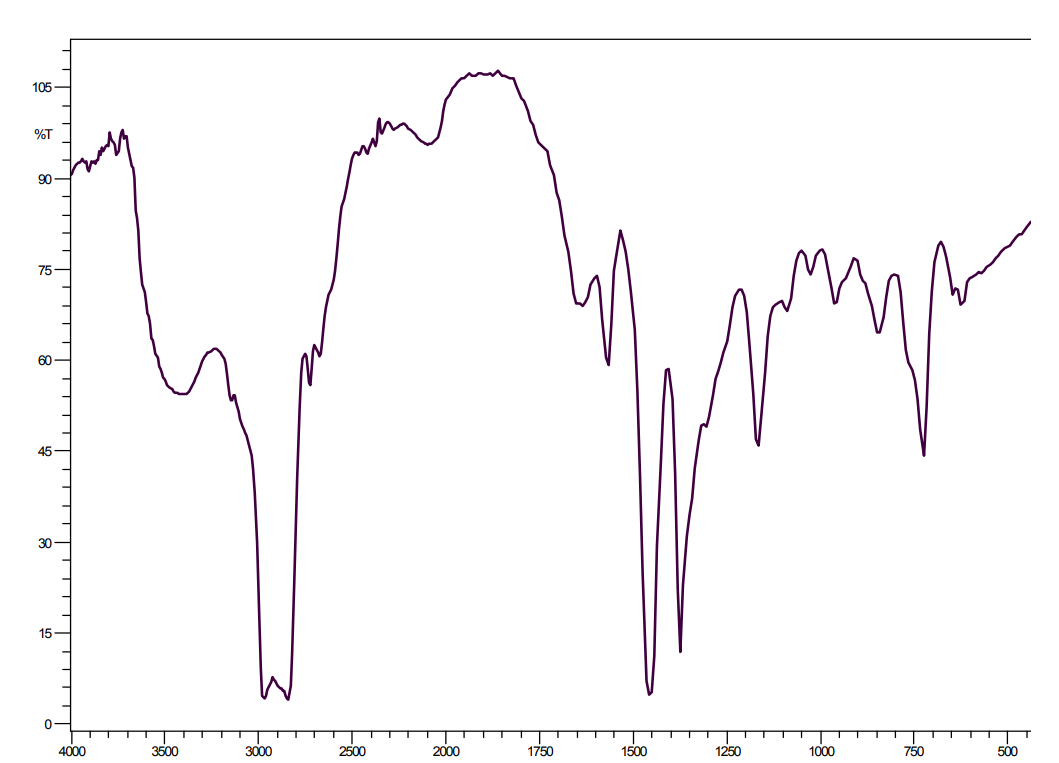
Figure A-2. Infrared Absorption Spectrum of 1-Ethyl-3-Methylimidazolium Chloride (Lot STBB3624), Neat
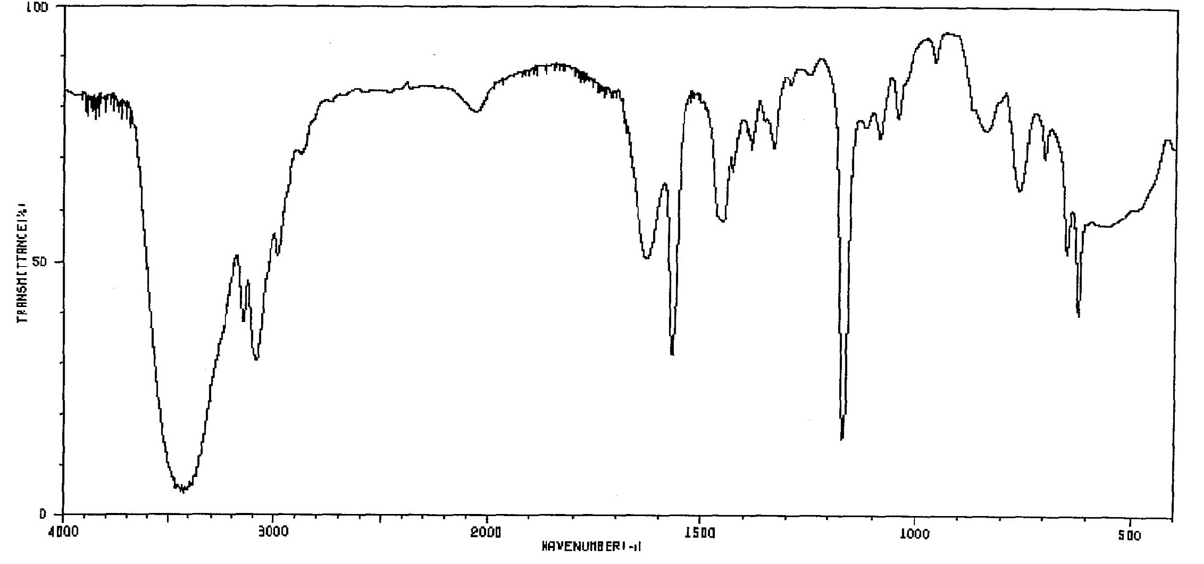
Figure A-3. 1H Nuclear Magnetic Resonance Spectrum of 1-Ethyl-3-Methylimidazolium Chloride (Lot S37784)
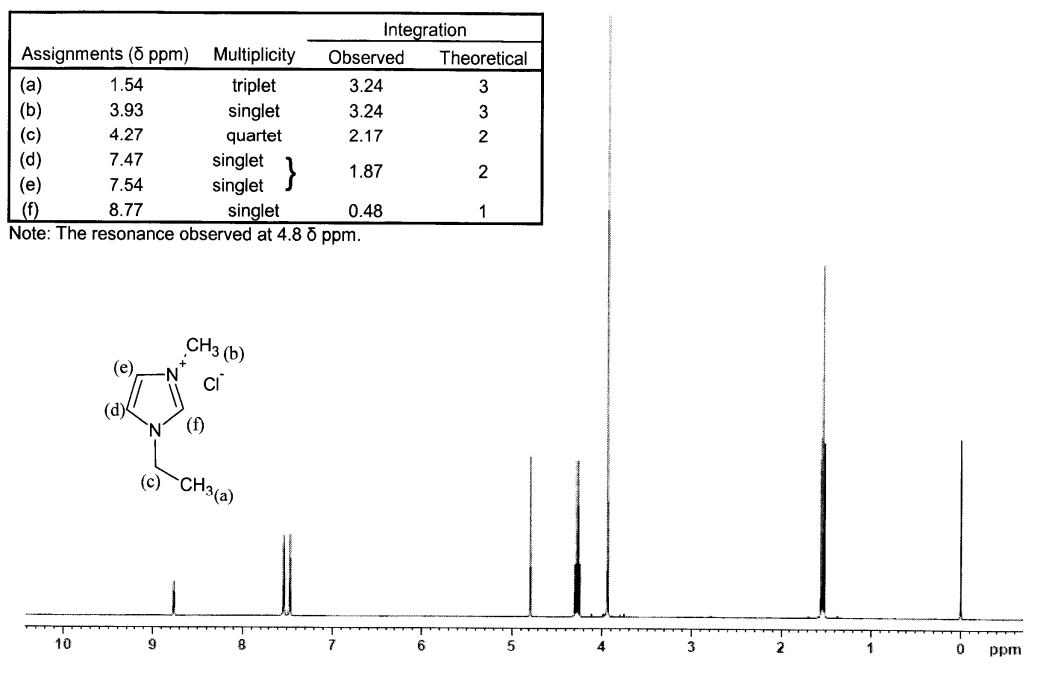
Figure A-4. Infrared Absorption Spectrum of 1-Butyl-3-Methylimidazolium Chloride (Lot STBB3444), Nujol Mineral Oil
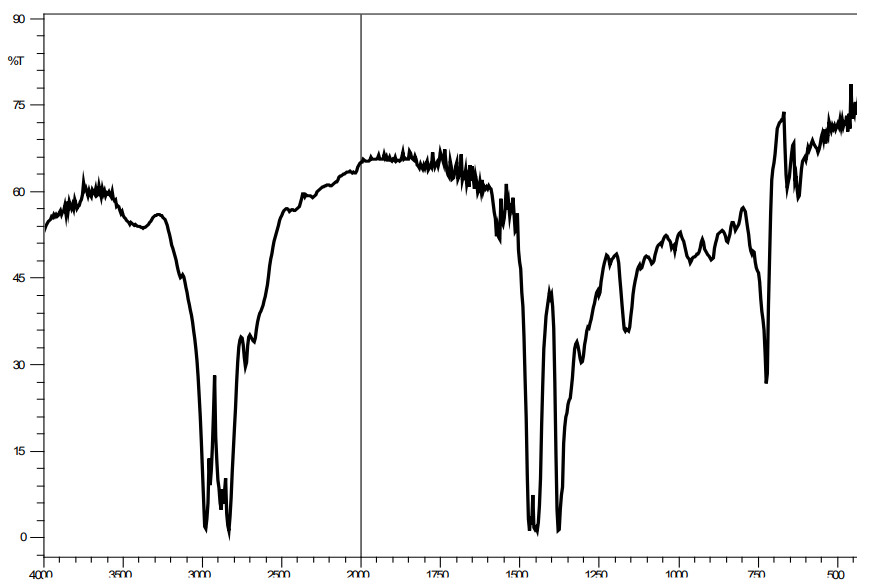
Figure A-5. Infrared Absorption Spectrum of 1-Butyl-3-Methylimidazolium Chloride (Lot STBB3444), Neat
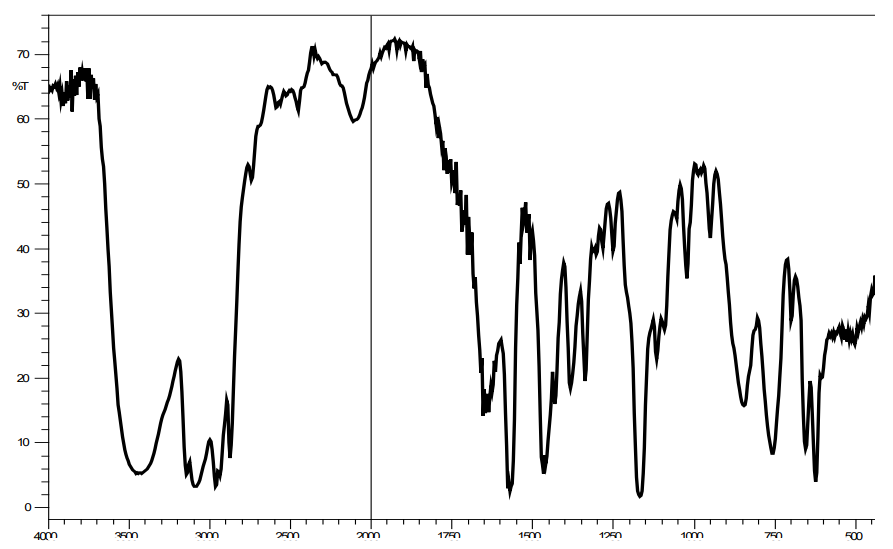
Figure A-6. 1H Nuclear Magnetic Resonance Spectrum of 1-Butyl-3-Methylimidazolium Chloride (Lot STBB3444)
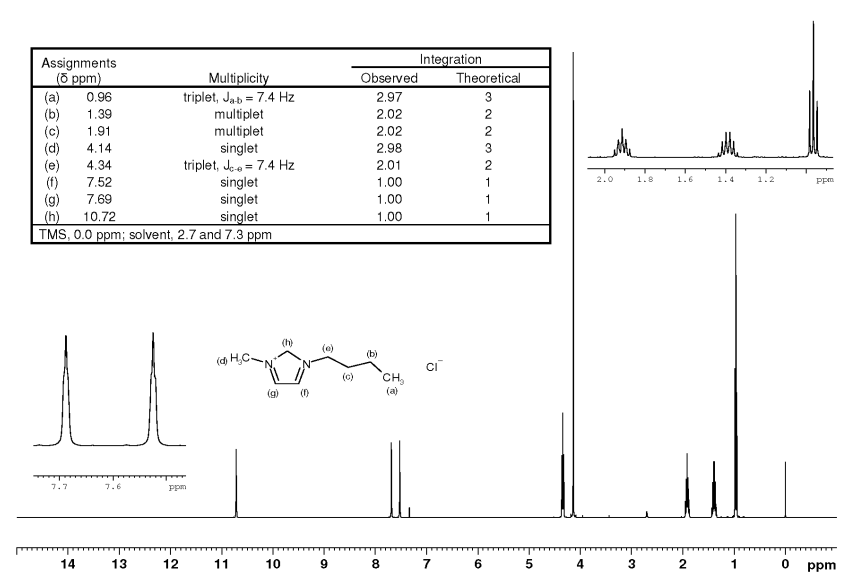
Figure A-7. Infrared Absorption Spectrum of 1-Butyl-1-Methylpyrrolidinium Chloride (Lot 20100610), Nujol Mineral Oil
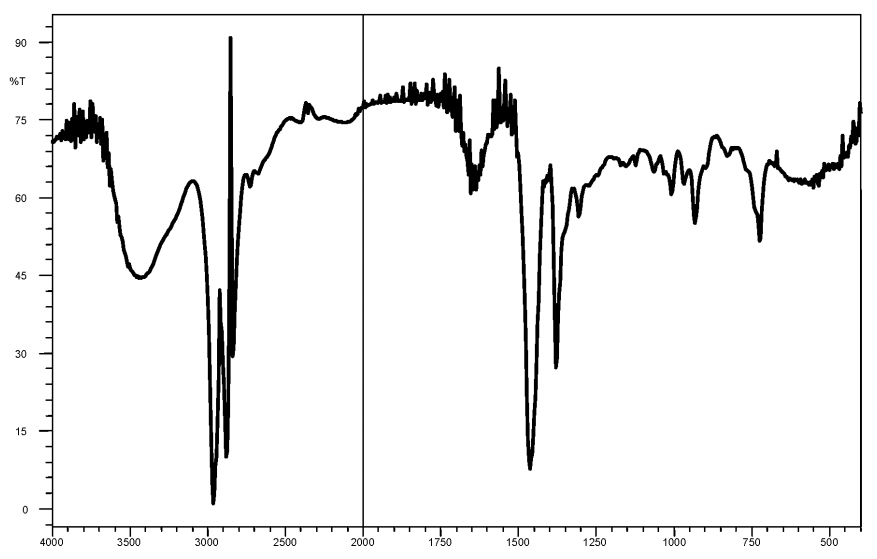
Figure A-8. Infrared Absorption Spectrum of 1-Butyl-1-Methylpyrrolidinium Chloride (Lot 20100610), Neat
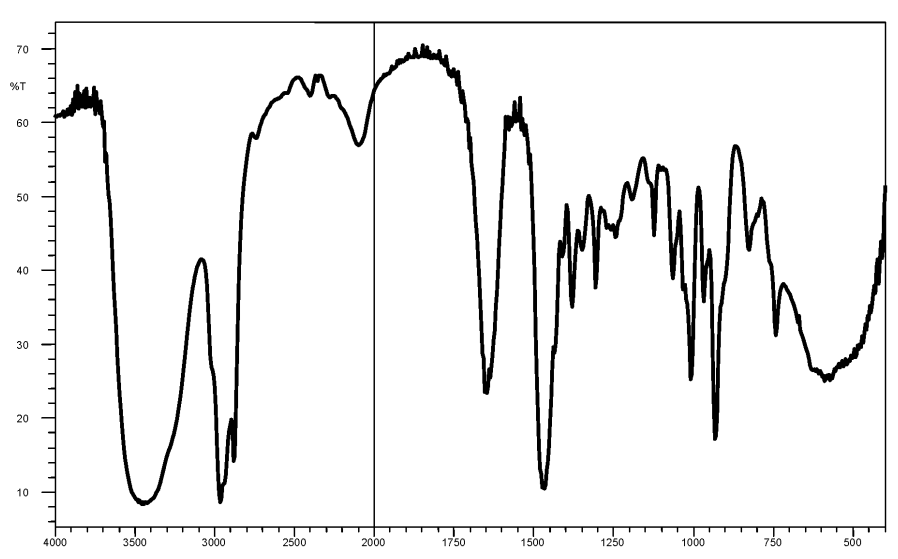
Figure A-9. 1H Nuclear Magnetic Resonance Spectrum of 1-Butyl-1-Methylpyrrolidinium Chloride (Lot 20100610)
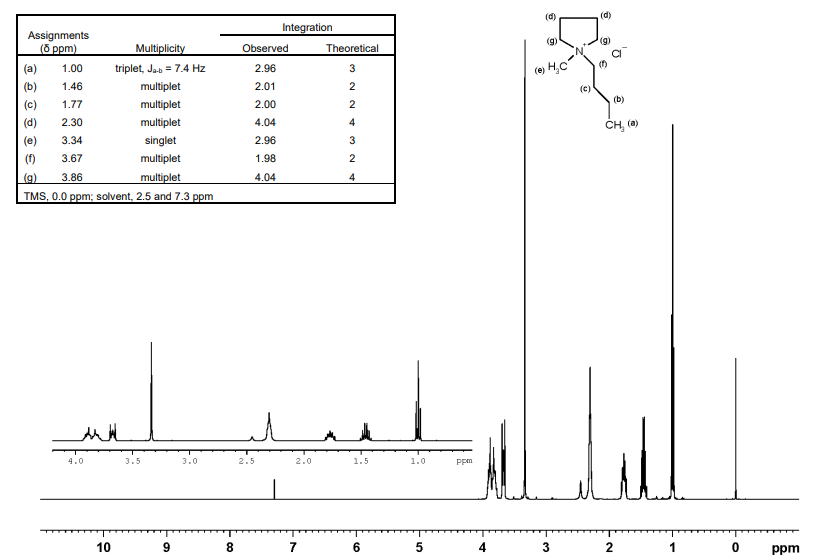
Figure A-10. Infrared Absorption Spectrum of N-Butylpyridinium Chloride (Lot 99/830), Nujol Mineral Oil
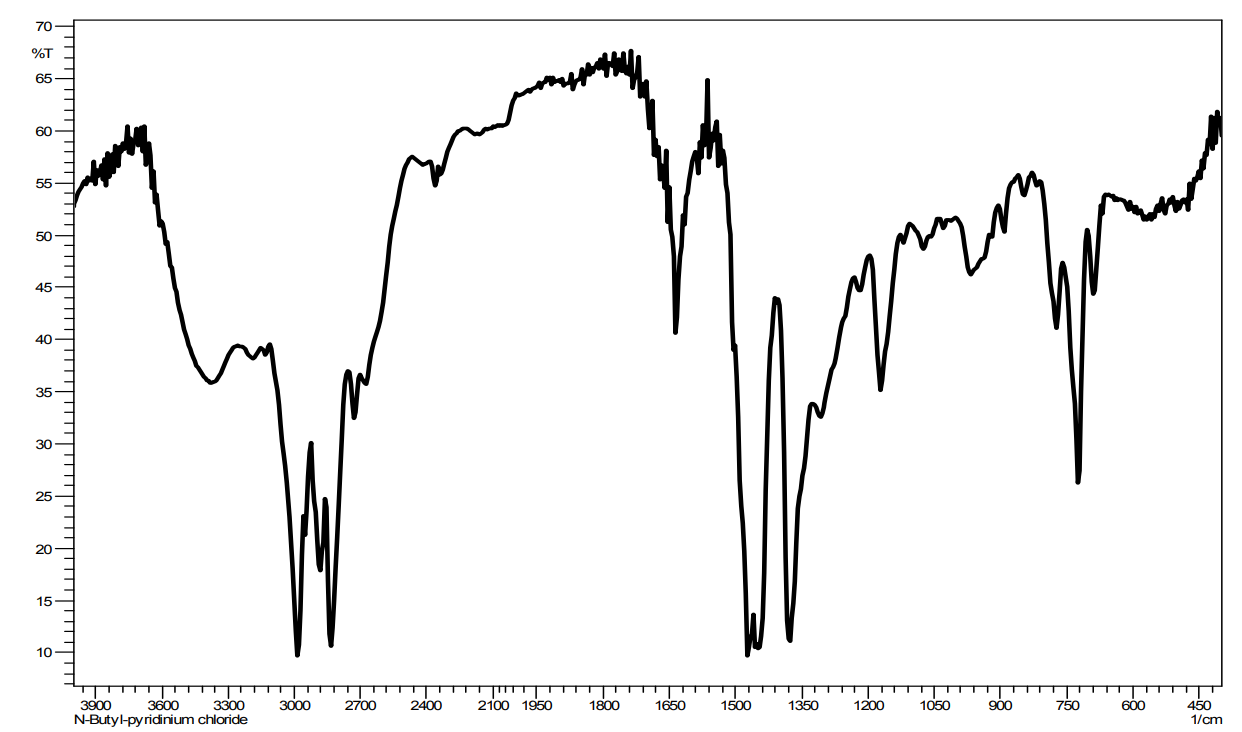
Figure A-11. Infrared Absorption Spectrum of N-Butylpyridinium Chloride (Lot 20100610), Neat
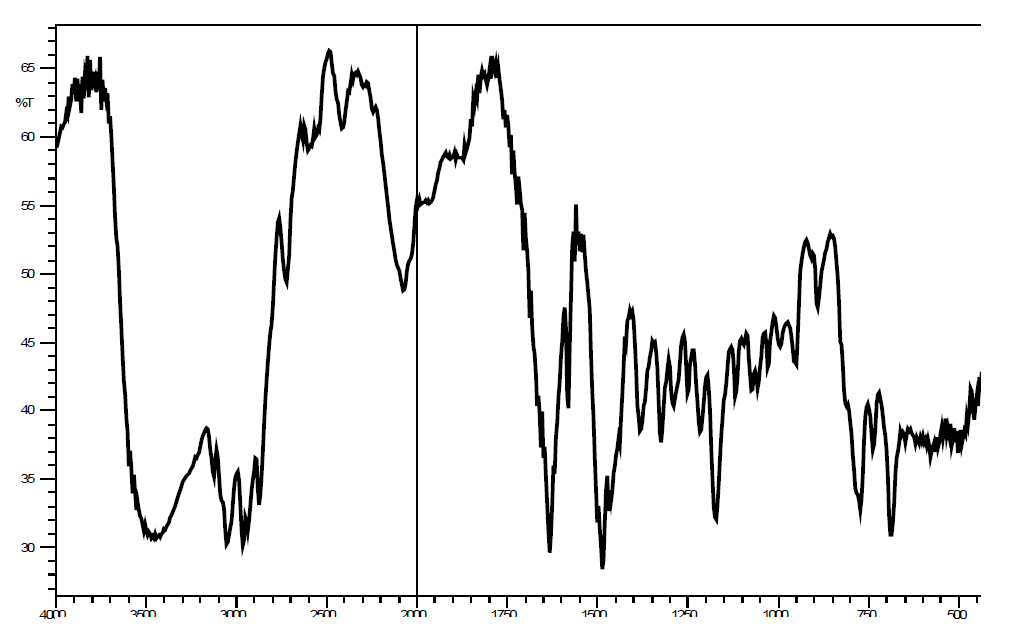
Figure A-12. 1H Nuclear Magnetic Resonance Spectrum of N-Butylpyridinium Chloride (Lot 99/830)
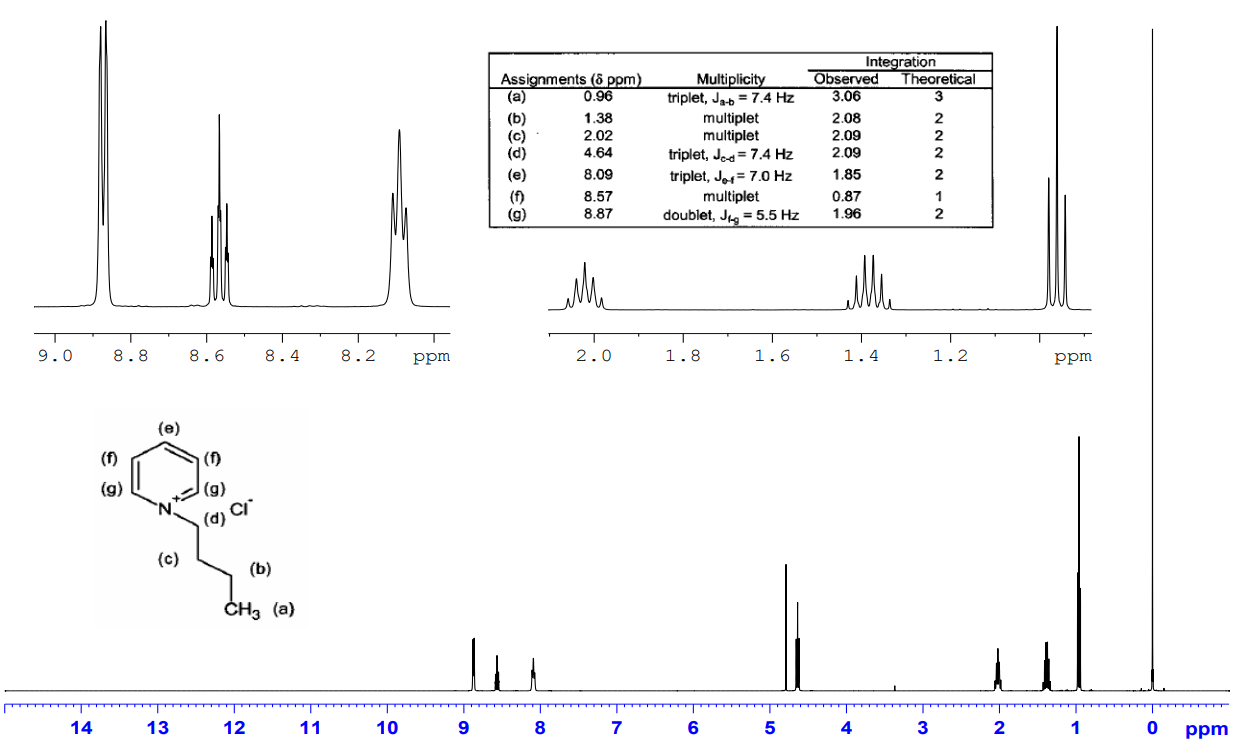
Appendix B. Ingredients, Nutrient Composition, and Contaminant Levels in NTP-2000 Rat and Mouse Ration
Table B-1. Ingredients of NTP-2000 Rat and Mouse Ration
| Ingredients | Percent by Weight |
|---|---|
| Ground hard winter wheat | 23 |
| Ground #2 yellow shelled corn | 22.44 |
| Wheat middlings | 15 |
| Oat hulls | 8.5 |
| Alfalfa meal (dehydrated, 17% protein) | 7.5 |
| Purified cellulose | 5.5 |
| Soybean meal (49% protein) | 4 |
| Fish meal (60% protein) | 4 |
| Corn oil (without preservatives) | 3 |
| Soy oil (without preservatives) | 3 |
| Dried brewer’s yeast | 1 |
| Calcium carbonate (USP) | 0.9 |
| Vitamin premixa | 0.5 |
| Mineral premixb | 0.5 |
| Calcium phosphate, dibasic (USP) | 0.4 |
| Sodium chloride | 0.3 |
| Choline chloride (70% choline) | 0.26 |
| Methionine | 0.2 |
Table B-1. Ingredients of NTP-2000 Rat and Mouse Ration
| Ingredients | Percent by Weight |
|---|---|
| Ground hard winter wheat | 23 |
| Ground #2 yellow shelled corn | 22.44 |
| Wheat middlings | 15 |
| Oat hulls | 8.5 |
| Alfalfa meal (dehydrated, 17% protein) | 7.5 |
| Purified cellulose | 5.5 |
| Soybean meal (49% protein) | 4 |
| Fish meal (60% protein) | 4 |
| Corn oil (without preservatives) | 3 |
| Soy oil (without preservatives) | 3 |
| Dried brewer’s yeast | 1 |
| Calcium carbonate (USP) | 0.9 |
| Vitamin premixa | 0.5 |
| Mineral premixb | 0.5 |
| Calcium phosphate, dibasic (USP) | 0.4 |
| Sodium chloride | 0.3 |
| Choline chloride (70% choline) | 0.26 |
| Methionine | 0.2 |
Table B-2. Vitamins and Minerals in NTP-2000 Rat and Mouse Ration
| Amounta | Source | |
|---|---|---|
| Vitamins | ||
| Vitamin A | 4,000 IU | Stabilized vitamin A palmitate or acetate |
| Vitamin D | 1,000 IU | D-activated animal sterol |
| Vitamin K | 1.0 mg | Menadione sodium bisulfite complex |
| α-Tocopheryl acetate | 100 IU | – |
| Niacin | 23 mg | – |
| Folic acid | 1.1 mg | – |
| d-Pantothenic acid | 10 mg | d-Calcium pantothenate |
| Riboflavin | 3.3 mg | – |
| Thiamine | 4 mg | Thiamine mononitrate |
| B12 | 52 μg | – |
| Pyridoxine | 6.3 mg | Pyridoxine hydrochloride |
| Biotin | 0.2 mg | d-Biotin |
| Minerals | ||
| Magnesium | 514 mg | Magnesium oxide |
| Iron | 35 mg | Iron sulfate |
| Zinc | 12 mg | Zinc oxide |
| Manganese | 10 mg | Manganese oxide |
| Copper | 2.0 mg | Copper sulfate |
| Iodine | 0.2 mg | Calcium iodate |
| Chromium | 0.2 mg | Chromium acetate |
Table B-2. Vitamins and Minerals in NTP-2000 Rat and Mouse Ration
| Amounta | Source | |
|---|---|---|
| Vitamins | ||
| Vitamin A | 4,000 IU | Stabilized vitamin A palmitate or acetate |
| Vitamin D | 1,000 IU | D-activated animal sterol |
| Vitamin K | 1.0 mg | Menadione sodium bisulfite complex |
| α-Tocopheryl acetate | 100 IU | – |
| Niacin | 23 mg | – |
| Folic acid | 1.1 mg | – |
| d-Pantothenic acid | 10 mg | d-Calcium pantothenate |
| Riboflavin | 3.3 mg | – |
| Thiamine | 4 mg | Thiamine mononitrate |
| B12 | 52 μg | – |
| Pyridoxine | 6.3 mg | Pyridoxine hydrochloride |
| Biotin | 0.2 mg | d-Biotin |
| Minerals | ||
| Magnesium | 514 mg | Magnesium oxide |
| Iron | 35 mg | Iron sulfate |
| Zinc | 12 mg | Zinc oxide |
| Manganese | 10 mg | Manganese oxide |
| Copper | 2.0 mg | Copper sulfate |
| Iodine | 0.2 mg | Calcium iodate |
| Chromium | 0.2 mg | Chromium acetate |
Table B-3. Nutrient Composition of NTP-2000 Rat and Mouse Ration in the Two-week Studies
| Nutrient | Mean ± Standard Deviation | Range | Number of Samples |
|---|---|---|---|
| Protein (% by weight) | 13.74 | – | 1 |
| Crude fat (% by weight) | 7.8 | – | 1 |
| Crude fiber (% by weight) | 9.4 | – | 1 |
| Ash (% by weight) | 5.2 | – | 1 |
| Amino acids (% of total diet) | |||
| Arginine | 0.805 ± 0.075 | 0.67–0.97 | 29 |
| Cystine | 0.220 ± 0.022 | 0.15–0.25 | 29 |
| Glycine | 0.702 ± 0.038 | 0.62–0.80 | 29 |
| Histidine | 0.342 ± 0.070 | 0.27–0.68 | 29 |
| Isoleucine | 0.549 ± 0.040 | 0.43–0.66 | 29 |
| Leucine | 1.097 ± 0.063 | 0.96–1.24 | 29 |
| Lysine | 0.700 ± 0.104 | 0.31–0.86 | 29 |
| Methionine | 0.409 ± 0.042 | 0.26–0.49 | 29 |
| Phenylalanine | 0.623 ± 0.047 | 0.47–0.72 | 29 |
| Threonine | 0.513 ± 0.041 | 0.43–0.61 | 29 |
| Tryptophan | 0.155 ± 0.027 | 0.11–0.20 | 29 |
| Tyrosine | 0.422 ± 0.066 | 0.28–0.54 | 29 |
| Valine | 0.666 ± 0.040 | 0.55–0.73 | 29 |
| Essential fatty acids (% of total diet) | |||
| Linoleic | 3.945 ± 0.235 | 3.49–4.55 | 29 |
| Linolenic | 0.297 ± 0.064 | 0.005–0.368 | 29 |
| Vitamins | |||
| Vitamin A (IU/kg) | 5,120 | 1 | |
| Vitamin D (IU/kg)a | 1,000 | – | – |
| α-Tocopherol (ppm) | 2,455 ± 12,817 | 13.6–69,100 | 29 |
| Thiamine (ppm)b | 6.5 | – | 1 |
| Riboflavin (ppm) | 8.17 ± 2.84 | 4.2–17.5 | 29 |
| Niacin (ppm) | 78.66 ± 8.11 | 66.4–98.2 | 29 |
| Pantothenic acid (ppm) | 26.42 ± 11.05 | 17.4–81.0 | 29 |
| Pyridoxine (ppm)b | 9.75 ± 2.05 | 6.44–14.3 | 29 |
| Folic acid (ppm) | 1.58 ± 0.43 | 1.15–3.27 | 29 |
| Biotin (ppm) | 0.323 ± 0.093 | 0.2–0.704 | 29 |
| B12 (ppb) | 50.41 ± 34.9 | 18.3–174 | 29 |
| Choline (as chloride) (ppm) | 2,593 ± 633 | 1,160–3,790 | 29 |
| Minerals | |||
| Calcium (%) | 0.887 | – | 1 |
| Phosphorus (%) | 0.544 | – | 1 |
| Potassium (%) | 0.668 ± 0.029 | 0.626–0.733 | 29 |
| Chloride (%) | 0.392 ± 0.044 | 0.3–0.517 | 29 |
| Sodium (%) | 0.195 ± 0.027 | 0.16–0.283 | 29 |
| Magnesium (%) | 0.217 ± 0.054 | 0.185–0.49 | 29 |
| Iron (ppm) | 191.6 ± 36.18 | 135–311 | 29 |
| Manganese (ppm) | 50.11 ± 9.42 | 21.0–73.1 | 29 |
| Zinc (ppm) | 57.3 ± 25.55 | 43.3–184.0 | 29 |
| Copper (ppm) | 7.57 ± 2.49 | 3.21–16.3 | 29 |
| Iodine (ppm) | 0.513 ± 0.221 | 0–0.972 | 29 |
| Chromium (ppm) | 1.017 ± 1.038 | 0.33–3.97 | 29 |
| Cobalt (ppm) | 0.222 ± 0.152 | 0.0857–0.864 | 29 |
Table B-3. Nutrient Composition of NTP-2000 Rat and Mouse Ration in the Two-week Studies
| Nutrient | Mean ± Standard Deviation | Range | Number of Samples |
|---|---|---|---|
| Protein (% by weight) | 13.74 | – | 1 |
| Crude fat (% by weight) | 7.8 | – | 1 |
| Crude fiber (% by weight) | 9.4 | – | 1 |
| Ash (% by weight) | 5.2 | – | 1 |
| Amino acids (% of total diet) | |||
| Arginine | 0.805 ± 0.075 | 0.67–0.97 | 29 |
| Cystine | 0.220 ± 0.022 | 0.15–0.25 | 29 |
| Glycine | 0.702 ± 0.038 | 0.62–0.80 | 29 |
| Histidine | 0.342 ± 0.070 | 0.27–0.68 | 29 |
| Isoleucine | 0.549 ± 0.040 | 0.43–0.66 | 29 |
| Leucine | 1.097 ± 0.063 | 0.96–1.24 | 29 |
| Lysine | 0.700 ± 0.104 | 0.31–0.86 | 29 |
| Methionine | 0.409 ± 0.042 | 0.26–0.49 | 29 |
| Phenylalanine | 0.623 ± 0.047 | 0.47–0.72 | 29 |
| Threonine | 0.513 ± 0.041 | 0.43–0.61 | 29 |
| Tryptophan | 0.155 ± 0.027 | 0.11–0.20 | 29 |
| Tyrosine | 0.422 ± 0.066 | 0.28–0.54 | 29 |
| Valine | 0.666 ± 0.040 | 0.55–0.73 | 29 |
| Essential fatty acids (% of total diet) | |||
| Linoleic | 3.945 ± 0.235 | 3.49–4.55 | 29 |
| Linolenic | 0.297 ± 0.064 | 0.005–0.368 | 29 |
| Vitamins | |||
| Vitamin A (IU/kg) | 5,120 | 1 | |
| Vitamin D (IU/kg)a | 1,000 | – | – |
| α-Tocopherol (ppm) | 2,455 ± 12,817 | 13.6–69,100 | 29 |
| Thiamine (ppm)b | 6.5 | – | 1 |
| Riboflavin (ppm) | 8.17 ± 2.84 | 4.2–17.5 | 29 |
| Niacin (ppm) | 78.66 ± 8.11 | 66.4–98.2 | 29 |
| Pantothenic acid (ppm) | 26.42 ± 11.05 | 17.4–81.0 | 29 |
| Pyridoxine (ppm)b | 9.75 ± 2.05 | 6.44–14.3 | 29 |
| Folic acid (ppm) | 1.58 ± 0.43 | 1.15–3.27 | 29 |
| Biotin (ppm) | 0.323 ± 0.093 | 0.2–0.704 | 29 |
| B12 (ppb) | 50.41 ± 34.9 | 18.3–174 | 29 |
| Choline (as chloride) (ppm) | 2,593 ± 633 | 1,160–3,790 | 29 |
| Minerals | |||
| Calcium (%) | 0.887 | – | 1 |
| Phosphorus (%) | 0.544 | – | 1 |
| Potassium (%) | 0.668 ± 0.029 | 0.626–0.733 | 29 |
| Chloride (%) | 0.392 ± 0.044 | 0.3–0.517 | 29 |
| Sodium (%) | 0.195 ± 0.027 | 0.16–0.283 | 29 |
| Magnesium (%) | 0.217 ± 0.054 | 0.185–0.49 | 29 |
| Iron (ppm) | 191.6 ± 36.18 | 135–311 | 29 |
| Manganese (ppm) | 50.11 ± 9.42 | 21.0–73.1 | 29 |
| Zinc (ppm) | 57.3 ± 25.55 | 43.3–184.0 | 29 |
| Copper (ppm) | 7.57 ± 2.49 | 3.21–16.3 | 29 |
| Iodine (ppm) | 0.513 ± 0.221 | 0–0.972 | 29 |
| Chromium (ppm) | 1.017 ± 1.038 | 0.33–3.97 | 29 |
| Cobalt (ppm) | 0.222 ± 0.152 | 0.0857–0.864 | 29 |
Table B-4. Nutrient Composition of NTP-2000 Rat and Mouse Ration in the Three-month Studies of 1-Ethyl-3-Methylimidazolium Chloride
| Nutrient | Mean ± Standard Deviation | Range | Number of Samples |
|---|---|---|---|
| Protein (% by weight) | 14.53 ± 0.435 | 13.9–14.9 | 4 |
| Crude fat (% by weight) | 8.4 ± 0.082 | 8.3–8.5 | 4 |
| Crude fiber (% by weight) | 9.34 ± 0.572 | 8.6–9.97 | 4 |
| Ash (% by weight) | 4.93 ± 0.149 | 4.79–5.14 | 4 |
| Amino acids (% of total diet) | |||
| Arginine | 0.805 ± 0.075 | 0.67–0.97 | 29 |
| Cystine | 0.220 ± 0.022 | 0.15–0.25 | 29 |
| Glycine | 0.702 ± 0.038 | 0.62–0.80 | 29 |
| Histidine | 0.342 ± 0.070 | 0.27–0.68 | 29 |
| Isoleucine | 0.549 ± 0.040 | 0.43–0.66 | 29 |
| Leucine | 1.097 ± 0.063 | 0.96–1.24 | 29 |
| Lysine | 0.700 ± 0.104 | 0.31–0.86 | 29 |
| Methionine | 0.409 ± 0.042 | 0.26–0.49 | 29 |
| Phenylalanine | 0.623 ± 0.047 | 0.471–0.72 | 29 |
| Threonine | 0.513 ± 0.041 | 0.43–0.61 | 29 |
| Tryptophan | 0.155 ± 0.027 | 0.11–0.2 | 29 |
| Tyrosine | 0.422 ± 0.066 | 0.28–0.54 | 29 |
| Valine | 0.666 ± 0.040 | 0.55–0.73 | 29 |
| Essential fatty acids (% of total diet) | |||
| Linoleic | 3.94 ± 0.235 | 3.49–4.55 | 29 |
| Linolenic | 0.297 ± 0.064 | 0.005–0.368 | 29 |
| Vitamins | |||
| Vitamin A (IU/kg) | 3,620 ± 63.48 | 2,820–4,140 | 4 |
| Vitamin D (IU/kg) | 1,000a | – | – |
| α-Tocopherol (ppm) | 2,455 ± 12,817 | 13.6–69,100 | 29 |
| Thiamine (ppm)b | 7.2 ± 0.141 | 7.0–7.3 | 4 |
| Riboflavin (ppm) | 8.17 ± 2.84 | 4.2–17.5 | 29 |
| Niacin (ppm) | 78.66 ± 8.11 | 66.4–98.2 | 29 |
| Pantothenic acid (ppm) | 26.42 ± 11.05 | 17.4–81.0 | 29 |
| Pyridoxine (ppm)b | 9.75 ± 2.05 | 6.44–14.3 | 29 |
| Folic acid (ppm) | 1.58 ± 0.43 | 1.15–3.27 | 29 |
| Biotin (ppm) | 0.323 ± 0.093 | 0.2–0.704 | 29 |
| B12 (ppb) | 50.41 ± 34.9 | 18.3–174 | 29 |
| Choline (as chloride) (ppm) | 2,593 ± 633 | 1,160–3,790 | 29 |
| Minerals | |||
| Calcium (%) | 0.904 ± 0.033 | 0.867–0.947 | 4 |
| Phosphorus (%) | 0.539 ± 0.020 | 0.51–0.553 | 4 |
| Potassium (%) | 0.668 ± 0.029 | 0.626–0.733 | 29 |
| Chloride (%) | 0.392 ± 0.044 | 0.3–0.517 | 29 |
| Sodium (%) | 0.195 ± 0.027 | 0.16–0.283 | 29 |
| Magnesium (%) | 0.217 ± 0.054 | 0.185–0.49 | 29 |
| Iron (ppm) | 191.6 ± 36.18 | 135–311 | 29 |
| Manganese (ppm) | 50.11 ± 9.42 | 21–73.1 | 29 |
| Zinc (ppm) | 57.3 ± 25.55 | 43.3–184 | 29 |
| Copper (ppm) | 7.57 ± 2.49 | 3.21–16.3 | 29 |
| Iodine (ppm) | 0.513 ± 0.221 | 0–0.972 | 29 |
| Chromium (ppm) | 1.017 ± 1.038 | 0.33–3.97 | 29 |
| Cobalt (ppm) | 0.222 ± 0.152 | 0.0857–0.864 | 29 |
Table B-4. Nutrient Composition of NTP-2000 Rat and Mouse Ration in the Three-month Studies of 1-Ethyl-3-Methylimidazolium Chloride
| Nutrient | Mean ± Standard Deviation | Range | Number of Samples |
|---|---|---|---|
| Protein (% by weight) | 14.53 ± 0.435 | 13.9–14.9 | 4 |
| Crude fat (% by weight) | 8.4 ± 0.082 | 8.3–8.5 | 4 |
| Crude fiber (% by weight) | 9.34 ± 0.572 | 8.6–9.97 | 4 |
| Ash (% by weight) | 4.93 ± 0.149 | 4.79–5.14 | 4 |
| Amino acids (% of total diet) | |||
| Arginine | 0.805 ± 0.075 | 0.67–0.97 | 29 |
| Cystine | 0.220 ± 0.022 | 0.15–0.25 | 29 |
| Glycine | 0.702 ± 0.038 | 0.62–0.80 | 29 |
| Histidine | 0.342 ± 0.070 | 0.27–0.68 | 29 |
| Isoleucine | 0.549 ± 0.040 | 0.43–0.66 | 29 |
| Leucine | 1.097 ± 0.063 | 0.96–1.24 | 29 |
| Lysine | 0.700 ± 0.104 | 0.31–0.86 | 29 |
| Methionine | 0.409 ± 0.042 | 0.26–0.49 | 29 |
| Phenylalanine | 0.623 ± 0.047 | 0.471–0.72 | 29 |
| Threonine | 0.513 ± 0.041 | 0.43–0.61 | 29 |
| Tryptophan | 0.155 ± 0.027 | 0.11–0.2 | 29 |
| Tyrosine | 0.422 ± 0.066 | 0.28–0.54 | 29 |
| Valine | 0.666 ± 0.040 | 0.55–0.73 | 29 |
| Essential fatty acids (% of total diet) | |||
| Linoleic | 3.94 ± 0.235 | 3.49–4.55 | 29 |
| Linolenic | 0.297 ± 0.064 | 0.005–0.368 | 29 |
| Vitamins | |||
| Vitamin A (IU/kg) | 3,620 ± 63.48 | 2,820–4,140 | 4 |
| Vitamin D (IU/kg) | 1,000a | – | – |
| α-Tocopherol (ppm) | 2,455 ± 12,817 | 13.6–69,100 | 29 |
| Thiamine (ppm)b | 7.2 ± 0.141 | 7.0–7.3 | 4 |
| Riboflavin (ppm) | 8.17 ± 2.84 | 4.2–17.5 | 29 |
| Niacin (ppm) | 78.66 ± 8.11 | 66.4–98.2 | 29 |
| Pantothenic acid (ppm) | 26.42 ± 11.05 | 17.4–81.0 | 29 |
| Pyridoxine (ppm)b | 9.75 ± 2.05 | 6.44–14.3 | 29 |
| Folic acid (ppm) | 1.58 ± 0.43 | 1.15–3.27 | 29 |
| Biotin (ppm) | 0.323 ± 0.093 | 0.2–0.704 | 29 |
| B12 (ppb) | 50.41 ± 34.9 | 18.3–174 | 29 |
| Choline (as chloride) (ppm) | 2,593 ± 633 | 1,160–3,790 | 29 |
| Minerals | |||
| Calcium (%) | 0.904 ± 0.033 | 0.867–0.947 | 4 |
| Phosphorus (%) | 0.539 ± 0.020 | 0.51–0.553 | 4 |
| Potassium (%) | 0.668 ± 0.029 | 0.626–0.733 | 29 |
| Chloride (%) | 0.392 ± 0.044 | 0.3–0.517 | 29 |
| Sodium (%) | 0.195 ± 0.027 | 0.16–0.283 | 29 |
| Magnesium (%) | 0.217 ± 0.054 | 0.185–0.49 | 29 |
| Iron (ppm) | 191.6 ± 36.18 | 135–311 | 29 |
| Manganese (ppm) | 50.11 ± 9.42 | 21–73.1 | 29 |
| Zinc (ppm) | 57.3 ± 25.55 | 43.3–184 | 29 |
| Copper (ppm) | 7.57 ± 2.49 | 3.21–16.3 | 29 |
| Iodine (ppm) | 0.513 ± 0.221 | 0–0.972 | 29 |
| Chromium (ppm) | 1.017 ± 1.038 | 0.33–3.97 | 29 |
| Cobalt (ppm) | 0.222 ± 0.152 | 0.0857–0.864 | 29 |
Table B-5. Nutrient Composition of NTP-2000 Rat and Mouse Ration in the Three-month Studies of 1-Butyl-3-Methylimidazolium Chloride
| Nutrient | Mean ± Standard Deviation | Range | Number of Samples |
|---|---|---|---|
| Protein (% by weight) | 14.43 ± 0.457 | 13.9–14.9 | 4 |
| Crude fat (% by weight) | 8.38 ± 0.096 | 8.3–8.5 | 4 |
| Crude fiber (% by weight) | 9.36 ± 0.570 | 8.6–9.97 | 4 |
| Ash (% by weight) | 4.99 ± 0.117 | 4.88–5.14 | 4 |
| Amino acids (% of total diet) | |||
| Arginine | 0.805 ± 0.075 | 0.6–0.97 | 29 |
| Cystine | 0.220 ± 0.022 | 0.15–0.25 | 29 |
| Glycine | 0.702 ± 0.038 | 0.62–0.80 | 29 |
| Histidine | 0.342 ± 0.070 | 0.27–0.68 | 29 |
| Isoleucine | 0.549 ± 0.040 | 0.43–0.66 | 29 |
| Leucine | 1.097 ± 0.063 | 0.96–1.24 | 29 |
| Lysine | 0.700 ± 0.104 | 0.31–0.86 | 29 |
| Methionine | 0.409 ± 0.042 | 0.26–0.49 | 29 |
| Phenylalanine | 0.623 ± 0.047 | 0.471–0.72 | 29 |
| Threonine | 0.513 ± 0.041 | 0.43–0.61 | 29 |
| Tryptophan | 0.155 ± 0.027 | 0.11–0.2 | 29 |
| Tyrosine | 0.422 ± 0.066 | 0.28–0.54 | 29 |
| Valine | 0.666 ± 0.040 | 0.55–0.73 | 29 |
| Essential fatty acids (% of total diet) | |||
| Linoleic | 3.94 ± 0.235 | 3.49–4.55 | 29 |
| Linolenic | 0.297 ± 0.064 | 0.005–0.368 | 29 |
| Vitamins | |||
| Vitamin A (IU/kg) | 3,585 ± 654 | 2,820–4,140 | 4 |
| Vitamin D (IU/kg)a | 1,000 | – | – |
| α-Tocopherol (ppm) | 2,455 ± 12,817 | 13.6–69,100 | 29 |
| Thiamine (ppm)b | 7.3 ± 0.082 | 7.2–7.4 | 4 |
| Riboflavin (ppm) | 8.17 ± 2.84 | 4.2–17.5 | 29 |
| Niacin (ppm) | 78.66 ± 8.11 | 66.4–98.2 | 29 |
| Pantothenic acid (ppm) | 26.42 ± 11.05 | 17.4–81.0 | 29 |
| Pyridoxine (ppm)b | 9.75 ± 2.05 | 6.44–14.3 | 29 |
| Folic acid (ppm) | 1.58 ± 0.43 | 1.15–3.27 | 29 |
| Biotin (ppm) | 0.323 ± 0.093 | 0.2–0.704 | 29 |
| B12 (ppb) | 50.41 ± 34.9 | 18.3–174 | 29 |
| Choline (as chloride) (ppm) | 2,593 ± 633 | 1,160–3,790 | 29 |
| Minerals | |||
| Calcium (%) | 0.891 ± 0.017 | 0.867–0.905 | 4 |
| Phosphorus (%) | 0.535 ± 0.018 | 0.51–0.53 | 4 |
| Potassium (%) | 0.668 ± 0.029 | 0.626–0.733 | 29 |
| Chloride (%) | 0.392 ± 0.044 | 0.3–0.517 | 29 |
| Sodium (%) | 0.195 ± 0.027 | 0.16–0.283 | 29 |
| Magnesium (%) | 0.217 ± 0.054 | 0.185–0.49 | 29 |
| Iron (ppm) | 191.6 ± 36.18 | 135–311 | 29 |
| Manganese (ppm) | 50.11 ± 9.42 | 21–73.1 | 29 |
| Zinc (ppm) | 57.3 ± 25.55 | 43.3–184 | 29 |
| Copper (ppm) | 7.57 ± 2.49 | 3.21–16.3 | 29 |
| Iodine (ppm) | 0.513 ± 0.221 | 0–0.972 | 29 |
| Chromium (ppm) | 1.017 ± 1.038 | 0.33–3.97 | 29 |
| Cobalt (ppm) | 0.222 ± 0.152 | 0.0857–0.864 | 29 |
Table B-5. Nutrient Composition of NTP-2000 Rat and Mouse Ration in the Three-month Studies of 1-Butyl-3-Methylimidazolium Chloride
| Nutrient | Mean ± Standard Deviation | Range | Number of Samples |
|---|---|---|---|
| Protein (% by weight) | 14.43 ± 0.457 | 13.9–14.9 | 4 |
| Crude fat (% by weight) | 8.38 ± 0.096 | 8.3–8.5 | 4 |
| Crude fiber (% by weight) | 9.36 ± 0.570 | 8.6–9.97 | 4 |
| Ash (% by weight) | 4.99 ± 0.117 | 4.88–5.14 | 4 |
| Amino acids (% of total diet) | |||
| Arginine | 0.805 ± 0.075 | 0.6–0.97 | 29 |
| Cystine | 0.220 ± 0.022 | 0.15–0.25 | 29 |
| Glycine | 0.702 ± 0.038 | 0.62–0.80 | 29 |
| Histidine | 0.342 ± 0.070 | 0.27–0.68 | 29 |
| Isoleucine | 0.549 ± 0.040 | 0.43–0.66 | 29 |
| Leucine | 1.097 ± 0.063 | 0.96–1.24 | 29 |
| Lysine | 0.700 ± 0.104 | 0.31–0.86 | 29 |
| Methionine | 0.409 ± 0.042 | 0.26–0.49 | 29 |
| Phenylalanine | 0.623 ± 0.047 | 0.471–0.72 | 29 |
| Threonine | 0.513 ± 0.041 | 0.43–0.61 | 29 |
| Tryptophan | 0.155 ± 0.027 | 0.11–0.2 | 29 |
| Tyrosine | 0.422 ± 0.066 | 0.28–0.54 | 29 |
| Valine | 0.666 ± 0.040 | 0.55–0.73 | 29 |
| Essential fatty acids (% of total diet) | |||
| Linoleic | 3.94 ± 0.235 | 3.49–4.55 | 29 |
| Linolenic | 0.297 ± 0.064 | 0.005–0.368 | 29 |
| Vitamins | |||
| Vitamin A (IU/kg) | 3,585 ± 654 | 2,820–4,140 | 4 |
| Vitamin D (IU/kg)a | 1,000 | – | – |
| α-Tocopherol (ppm) | 2,455 ± 12,817 | 13.6–69,100 | 29 |
| Thiamine (ppm)b | 7.3 ± 0.082 | 7.2–7.4 | 4 |
| Riboflavin (ppm) | 8.17 ± 2.84 | 4.2–17.5 | 29 |
| Niacin (ppm) | 78.66 ± 8.11 | 66.4–98.2 | 29 |
| Pantothenic acid (ppm) | 26.42 ± 11.05 | 17.4–81.0 | 29 |
| Pyridoxine (ppm)b | 9.75 ± 2.05 | 6.44–14.3 | 29 |
| Folic acid (ppm) | 1.58 ± 0.43 | 1.15–3.27 | 29 |
| Biotin (ppm) | 0.323 ± 0.093 | 0.2–0.704 | 29 |
| B12 (ppb) | 50.41 ± 34.9 | 18.3–174 | 29 |
| Choline (as chloride) (ppm) | 2,593 ± 633 | 1,160–3,790 | 29 |
| Minerals | |||
| Calcium (%) | 0.891 ± 0.017 | 0.867–0.905 | 4 |
| Phosphorus (%) | 0.535 ± 0.018 | 0.51–0.53 | 4 |
| Potassium (%) | 0.668 ± 0.029 | 0.626–0.733 | 29 |
| Chloride (%) | 0.392 ± 0.044 | 0.3–0.517 | 29 |
| Sodium (%) | 0.195 ± 0.027 | 0.16–0.283 | 29 |
| Magnesium (%) | 0.217 ± 0.054 | 0.185–0.49 | 29 |
| Iron (ppm) | 191.6 ± 36.18 | 135–311 | 29 |
| Manganese (ppm) | 50.11 ± 9.42 | 21–73.1 | 29 |
| Zinc (ppm) | 57.3 ± 25.55 | 43.3–184 | 29 |
| Copper (ppm) | 7.57 ± 2.49 | 3.21–16.3 | 29 |
| Iodine (ppm) | 0.513 ± 0.221 | 0–0.972 | 29 |
| Chromium (ppm) | 1.017 ± 1.038 | 0.33–3.97 | 29 |
| Cobalt (ppm) | 0.222 ± 0.152 | 0.0857–0.864 | 29 |
Table B-6. Nutrient Composition of NTP-2000 Rat and Mouse Ration in the Three-month Studies of 1-Butyl-1-Methylpyrrolidinium Chloride
| Nutrient | Mean ± Standard Deviation | Range | Number of Samples |
|---|---|---|---|
| Protein (% by weight) | 14.55 ± 0.532 | 13.9–15.2 | 4 |
| Crude fat (% by weight) | 8.28 ± 0.320 | 7.8–8.5 | 4 |
| Crude fiber (% by weight) | 9.48 ± 0.337 | 9.12–9.83 | 4 |
| Ash (% by weight) | 4.88 ± 0.132 | 4.79–5.07 | 4 |
| Amino acids (% of total diet) | |||
| Arginine | 0.805 ± 0.075 | 0.67–0.97 | 29 |
| Cystine | 0.220 ± 0.022 | 0.15–0.25 | 29 |
| Glycine | 0.702 ± 0.038 | 0.62–0.80 | 29 |
| Histidine | 0.342 ± 0.070 | 0.27–0.68 | 29 |
| Isoleucine | 0.549 ± 0.040 | 0.43–0.66 | 29 |
| Leucine | 1.097 ± 0.063 | 0.96–1.24 | 29 |
| Lysine | 0.700 ± 0.104 | 0.31–0.86 | 29 |
| Methionine | 0.409 ± 0.042 | 0.26–0.49 | 29 |
| Phenylalanine | 0.623 ± 0.047 | 0.471–0.72 | 29 |
| Threonine | 0.513 ± 0.041 | 0.43–0.61 | 29 |
| Tryptophan | 0.155 ± 0.027 | 0.11–0.2 | 29 |
| Tyrosine | 0.422 ± 0.066 | 0.28–0.54 | 29 |
| Valine | 0.666 ± 0.040 | 0.55–0.73 | 29 |
| Essential fatty acids (% of total diet) | |||
| Linoleic | 3.94 ± 0.235 | 3.49–4.55 | 29 |
| Linolenic | 0.297 ± 0.064 | 0.005–0.368 | 29 |
| Vitamins | |||
| Vitamin A (IU/kg) | 3,443 ± 30.23 | 3,040–3,740 | 4 |
| Vitamin D (IU/kg)a | 1,000 | – | – |
| α-Tocopherol (ppm) | 2,455 ± 12,817 | 13.6–69,100 | 29 |
| Thiamine (ppm)b | 7.55 ±0.580 | 7.0–8.3 | 4 |
| Riboflavin (ppm) | 8.17 ± 2.84 | 4.2–17.5 | 29 |
| Niacin (ppm) | 78.66 ± 8.11 | 66.4–98.2 | 29 |
| Pantothenic acid (ppm) | 26.42 ± 11.05 | 17.4–81.0 | 29 |
| Pyridoxine (ppm)b | 9.75 ± 2.05 | 6.44–14.3 | 29 |
| Folic acid (ppm) | 1.58 ± 0.43 | 1.15–3.27 | 29 |
| Biotin (ppm) | 0.323 ± 0.093 | 0.2–0.704 | 29 |
| B12 (ppb) | 50.41 ± 34.9 | 18.3–174 | 29 |
| Choline (as chloride) (ppm) | 2,593 ± 633 | 1,160–3,790 | 29 |
| Minerals | |||
| Calcium (%) | 0.886 ± 0.138 | 0.697–1.02 | 4 |
| Phosphorus (%) | 0.570 ± 0.030 | 0.553–0.615 | 4 |
| Potassium (%) | 0.668 ± 0.029 | 0.626–0.733 | 29 |
| Chloride (%) | 0.392 ± 0.044 | 0.3–0.517 | 29 |
| Sodium (%) | 0.195 ± 0.027 | 0.16–0.283 | 29 |
| Magnesium (%) | 0.217 ± 0.054 | 0.185–0.49 | 29 |
| Iron (ppm) | 191.6 ± 36.18 | 135–311 | 29 |
| Manganese (ppm) | 50.11 ± 9.42 | 21–73.1 | 29 |
| Zinc (ppm) | 57.3 ± 25.55 | 43.3–184 | 29 |
| Copper (ppm) | 7.57 ± 2.49 | 3.21–16.3 | 29 |
| Iodine (ppm) | 0.513 ± 0.221 | 0–0.972 | 29 |
| Chromium (ppm) | 1.017 ± 1.038 | 0.33–3.97 | 29 |
| Cobalt (ppm) | 0.222 ± 0.152 | 0.0857–0.864 | 29 |
Table B-6. Nutrient Composition of NTP-2000 Rat and Mouse Ration in the Three-month Studies of 1-Butyl-1-Methylpyrrolidinium Chloride
| Nutrient | Mean ± Standard Deviation | Range | Number of Samples |
|---|---|---|---|
| Protein (% by weight) | 14.55 ± 0.532 | 13.9–15.2 | 4 |
| Crude fat (% by weight) | 8.28 ± 0.320 | 7.8–8.5 | 4 |
| Crude fiber (% by weight) | 9.48 ± 0.337 | 9.12–9.83 | 4 |
| Ash (% by weight) | 4.88 ± 0.132 | 4.79–5.07 | 4 |
| Amino acids (% of total diet) | |||
| Arginine | 0.805 ± 0.075 | 0.67–0.97 | 29 |
| Cystine | 0.220 ± 0.022 | 0.15–0.25 | 29 |
| Glycine | 0.702 ± 0.038 | 0.62–0.80 | 29 |
| Histidine | 0.342 ± 0.070 | 0.27–0.68 | 29 |
| Isoleucine | 0.549 ± 0.040 | 0.43–0.66 | 29 |
| Leucine | 1.097 ± 0.063 | 0.96–1.24 | 29 |
| Lysine | 0.700 ± 0.104 | 0.31–0.86 | 29 |
| Methionine | 0.409 ± 0.042 | 0.26–0.49 | 29 |
| Phenylalanine | 0.623 ± 0.047 | 0.471–0.72 | 29 |
| Threonine | 0.513 ± 0.041 | 0.43–0.61 | 29 |
| Tryptophan | 0.155 ± 0.027 | 0.11–0.2 | 29 |
| Tyrosine | 0.422 ± 0.066 | 0.28–0.54 | 29 |
| Valine | 0.666 ± 0.040 | 0.55–0.73 | 29 |
| Essential fatty acids (% of total diet) | |||
| Linoleic | 3.94 ± 0.235 | 3.49–4.55 | 29 |
| Linolenic | 0.297 ± 0.064 | 0.005–0.368 | 29 |
| Vitamins | |||
| Vitamin A (IU/kg) | 3,443 ± 30.23 | 3,040–3,740 | 4 |
| Vitamin D (IU/kg)a | 1,000 | – | – |
| α-Tocopherol (ppm) | 2,455 ± 12,817 | 13.6–69,100 | 29 |
| Thiamine (ppm)b | 7.55 ±0.580 | 7.0–8.3 | 4 |
| Riboflavin (ppm) | 8.17 ± 2.84 | 4.2–17.5 | 29 |
| Niacin (ppm) | 78.66 ± 8.11 | 66.4–98.2 | 29 |
| Pantothenic acid (ppm) | 26.42 ± 11.05 | 17.4–81.0 | 29 |
| Pyridoxine (ppm)b | 9.75 ± 2.05 | 6.44–14.3 | 29 |
| Folic acid (ppm) | 1.58 ± 0.43 | 1.15–3.27 | 29 |
| Biotin (ppm) | 0.323 ± 0.093 | 0.2–0.704 | 29 |
| B12 (ppb) | 50.41 ± 34.9 | 18.3–174 | 29 |
| Choline (as chloride) (ppm) | 2,593 ± 633 | 1,160–3,790 | 29 |
| Minerals | |||
| Calcium (%) | 0.886 ± 0.138 | 0.697–1.02 | 4 |
| Phosphorus (%) | 0.570 ± 0.030 | 0.553–0.615 | 4 |
| Potassium (%) | 0.668 ± 0.029 | 0.626–0.733 | 29 |
| Chloride (%) | 0.392 ± 0.044 | 0.3–0.517 | 29 |
| Sodium (%) | 0.195 ± 0.027 | 0.16–0.283 | 29 |
| Magnesium (%) | 0.217 ± 0.054 | 0.185–0.49 | 29 |
| Iron (ppm) | 191.6 ± 36.18 | 135–311 | 29 |
| Manganese (ppm) | 50.11 ± 9.42 | 21–73.1 | 29 |
| Zinc (ppm) | 57.3 ± 25.55 | 43.3–184 | 29 |
| Copper (ppm) | 7.57 ± 2.49 | 3.21–16.3 | 29 |
| Iodine (ppm) | 0.513 ± 0.221 | 0–0.972 | 29 |
| Chromium (ppm) | 1.017 ± 1.038 | 0.33–3.97 | 29 |
| Cobalt (ppm) | 0.222 ± 0.152 | 0.0857–0.864 | 29 |
Table B-7. Nutrient Composition of NTP-2000 Rat and Mouse Ration in the Three-month Studies of N-Butylpyridinium Chloride
| Nutrient | Mean ± Standard Deviation | Range | Number of Samples |
|---|---|---|---|
| Protein (% by weight) | 14.43 ± 0.574 | 13.9–15.2 | 4 |
| Crude fat (% by weight) | 8.1 ± 0.408 | 7.7–8.5 | 4 |
| Crude fiber (% by weight) | 9.56 ± 0.308 | 9.12–9.83 | 4 |
| Ash (% by weight) | 4.91 ± 0.119 | 4.8–5.07 | 4 |
| Amino acids (% of total diet) | |||
| Arginine | 0.805 ± 0.075 | 0.67–0.97 | 29 |
| Cystine | 0.220 ± 0.022 | 0.15–0.25 | 29 |
| Glycine | 0.702 ± 0.038 | 0.62–0.80 | 29 |
| Histidine | 0.342 ± 0.070 | 0.27–0.68 | 29 |
| Isoleucine | 0.549 ± 0.040 | 0.43–0.66 | 29 |
| Leucine | 1.097 ± 0.063 | 0.96–1.24 | 29 |
| Lysine | 0.700 ± 0.104 | 0.31–0.86 | 29 |
| Methionine | 0.409 ± 0.042 | 0.26–0.49 | 29 |
| Phenylalanine | 0.623 ± 0.047 | 0.471–0.72 | 29 |
| Threonine | 0.513 ± 0.041 | 0.43–0.61 | 29 |
| Tryptophan | 0.155 ± 0.027 | 0.11–0.2 | 29 |
| Tyrosine | 0.422 ± 0.066 | 0.28–0.54 | 29 |
| Valine | 0.666 ± 0.040 | 0.55–0.73 | 29 |
| Essential fatty acids (% of total diet) | |||
| Linoleic | 3.94 ± 0.235 | 3.49–4.55 | 29 |
| Linolenic | 0.297 ± 0.064 | 0.005–0.368 | 29 |
| Vitamins | |||
| Vitamin A (IU/kg) | 3,648 ± 48.61 | 3,040–4,220 | 4 |
| Vitamin D (IU/kg)a | 1,000 | – | – |
| α-Tocopherol (ppm) | 2,455 ± 12,817 | 13.6–69,100 | 29 |
| Thiamine (ppm)b | 7.5 ±0.648 | 6.8–8.3 | 4 |
| Riboflavin (ppm) | 8.17 ± 2.84 | 4.2–17.5 | 29 |
| Niacin (ppm) | 78.66 ± 8.11 | 66.4–98.2 | 29 |
| Pantothenic acid (ppm) | 26.42 ± 11.05 | 17.4–81.0 | 29 |
| Pyridoxine (ppm)b | 9.75 ± 2.05 | 6.44–14.3 | 29 |
| Folic acid (ppm) | 1.58 ± 0.43 | 1.15–3.27 | 29 |
| Biotin (ppm) | 0.323 ± 0.093 | 0.2–0.704 | 29 |
| B12 (ppb) | 50.41 ± 34.9 | 18.3–174 | 29 |
| Choline (as chloride) (ppm) | 2,593 ± 633 | 1,160–3,790 | 29 |
| Minerals | |||
| Calcium (%) | 0.902 ± 0.151 | 0.697–1.02 | 4 |
| Phosphorus (%) | 0.580 ± 0.030 | 0.553–0.615 | 4 |
| Potassium (%) | 0.668 ± 0.029 | 0.626–0.733 | 29 |
| Chloride (%) | 0.392 ± 0.044 | 0.3–0.517 | 29 |
| Sodium (%) | 0.195 ± 0.027 | 0.16–0.283 | 29 |
| Magnesium (%) | 0.217 ± 0.054 | 0.185–0.49 | 29 |
| Iron (ppm) | 191.6 ± 36.18 | 135–311 | 29 |
| Manganese (ppm) | 50.11 ± 9.42 | 21–73.1 | 29 |
| Zinc (ppm) | 57.3 ± 25.55 | 43.3–184 | 29 |
| Copper (ppm) | 7.57 ± 2.49 | 3.21–16.3 | 29 |
| Iodine (ppm) | 0.513 ± 0.221 | 0–0.972 | 29 |
| Chromium (ppm) | 1.017 ± 1.038 | 0.33–3.97 | 29 |
| Cobalt (ppm) | 0.222 ± 0.152 | 0.0857–0.864 | 29 |
Table B-7. Nutrient Composition of NTP-2000 Rat and Mouse Ration in the Three-month Studies of N-Butylpyridinium Chloride
| Nutrient | Mean ± Standard Deviation | Range | Number of Samples |
|---|---|---|---|
| Protein (% by weight) | 14.43 ± 0.574 | 13.9–15.2 | 4 |
| Crude fat (% by weight) | 8.1 ± 0.408 | 7.7–8.5 | 4 |
| Crude fiber (% by weight) | 9.56 ± 0.308 | 9.12–9.83 | 4 |
| Ash (% by weight) | 4.91 ± 0.119 | 4.8–5.07 | 4 |
| Amino acids (% of total diet) | |||
| Arginine | 0.805 ± 0.075 | 0.67–0.97 | 29 |
| Cystine | 0.220 ± 0.022 | 0.15–0.25 | 29 |
| Glycine | 0.702 ± 0.038 | 0.62–0.80 | 29 |
| Histidine | 0.342 ± 0.070 | 0.27–0.68 | 29 |
| Isoleucine | 0.549 ± 0.040 | 0.43–0.66 | 29 |
| Leucine | 1.097 ± 0.063 | 0.96–1.24 | 29 |
| Lysine | 0.700 ± 0.104 | 0.31–0.86 | 29 |
| Methionine | 0.409 ± 0.042 | 0.26–0.49 | 29 |
| Phenylalanine | 0.623 ± 0.047 | 0.471–0.72 | 29 |
| Threonine | 0.513 ± 0.041 | 0.43–0.61 | 29 |
| Tryptophan | 0.155 ± 0.027 | 0.11–0.2 | 29 |
| Tyrosine | 0.422 ± 0.066 | 0.28–0.54 | 29 |
| Valine | 0.666 ± 0.040 | 0.55–0.73 | 29 |
| Essential fatty acids (% of total diet) | |||
| Linoleic | 3.94 ± 0.235 | 3.49–4.55 | 29 |
| Linolenic | 0.297 ± 0.064 | 0.005–0.368 | 29 |
| Vitamins | |||
| Vitamin A (IU/kg) | 3,648 ± 48.61 | 3,040–4,220 | 4 |
| Vitamin D (IU/kg)a | 1,000 | – | – |
| α-Tocopherol (ppm) | 2,455 ± 12,817 | 13.6–69,100 | 29 |
| Thiamine (ppm)b | 7.5 ±0.648 | 6.8–8.3 | 4 |
| Riboflavin (ppm) | 8.17 ± 2.84 | 4.2–17.5 | 29 |
| Niacin (ppm) | 78.66 ± 8.11 | 66.4–98.2 | 29 |
| Pantothenic acid (ppm) | 26.42 ± 11.05 | 17.4–81.0 | 29 |
| Pyridoxine (ppm)b | 9.75 ± 2.05 | 6.44–14.3 | 29 |
| Folic acid (ppm) | 1.58 ± 0.43 | 1.15–3.27 | 29 |
| Biotin (ppm) | 0.323 ± 0.093 | 0.2–0.704 | 29 |
| B12 (ppb) | 50.41 ± 34.9 | 18.3–174 | 29 |
| Choline (as chloride) (ppm) | 2,593 ± 633 | 1,160–3,790 | 29 |
| Minerals | |||
| Calcium (%) | 0.902 ± 0.151 | 0.697–1.02 | 4 |
| Phosphorus (%) | 0.580 ± 0.030 | 0.553–0.615 | 4 |
| Potassium (%) | 0.668 ± 0.029 | 0.626–0.733 | 29 |
| Chloride (%) | 0.392 ± 0.044 | 0.3–0.517 | 29 |
| Sodium (%) | 0.195 ± 0.027 | 0.16–0.283 | 29 |
| Magnesium (%) | 0.217 ± 0.054 | 0.185–0.49 | 29 |
| Iron (ppm) | 191.6 ± 36.18 | 135–311 | 29 |
| Manganese (ppm) | 50.11 ± 9.42 | 21–73.1 | 29 |
| Zinc (ppm) | 57.3 ± 25.55 | 43.3–184 | 29 |
| Copper (ppm) | 7.57 ± 2.49 | 3.21–16.3 | 29 |
| Iodine (ppm) | 0.513 ± 0.221 | 0–0.972 | 29 |
| Chromium (ppm) | 1.017 ± 1.038 | 0.33–3.97 | 29 |
| Cobalt (ppm) | 0.222 ± 0.152 | 0.0857–0.864 | 29 |
Table B-8. Contaminant Levels in NTP-2000 Rat and Mouse Ration in the Two-week Studies
| Level | Number of Samples | |
|---|---|---|
| Contaminants | ||
| Arsenic (ppm) | 0.169 | 1 |
| Cadmium (ppm) | 0.068 | 1 |
| Lead (ppm) | 0.097 | 1 |
| Mercury (ppm) | 0.022 | 1 |
| Selenium (ppm) | 0.252 | 1 |
| Aflatoxins (ppb)a | <5.0 | 1 |
| Nitrate nitrogen (ppm)b | 10 | 1 |
| Nitrite nitrogen (ppm)a,b | <0.61 | 1 |
| BHA (ppm)a,c | <1.00 | 1 |
| BHT (ppm)a,c | <1.00 | 1 |
| Aerobic plate count (CFU/g) | <10.0 | 1 |
| Coliform (MPN/g) | <3.0 | 1 |
| Escherichia coli (MPN/g)a | <10.0 | 1 |
| Salmonella (MPN/g) | Negative | 1 |
| Total nitrosamines (ppb)d | 11.3 | 1 |
| N-Ndimethylamine (ppb)d | 1.1 | 1 |
| N-Npyrrolidine (ppb)d | 10.2 | 1 |
| Pesticides (ppm) | ||
| α-BHCa | <0.01 | 1 |
| β-BHCa | <0.02 | 1 |
| γ-BHCa | <0.01 | 1 |
| δ-BHCa | <0.01 | 1 |
| Heptachlora | <0.01 | 1 |
| Aldrina | <0.01 | 1 |
| Heptachlor epoxidea | <0.01 | 1 |
| DDEa | <0.01 | 1 |
| DDDa | <0.01 | 1 |
| DDTa | <0.01 | 1 |
| HCBa | <0.01 | 1 |
| Mirexa | <0.01 | 1 |
| Methoxychlora | <0.05 | 1 |
| Dieldrina | <0.01 | 1 |
| Endrina | <0.01 | 1 |
| Telodrina | <0.01 | 1 |
| Chlordanea | <0.05 | 1 |
| Toxaphenea | <0.10 | 1 |
| Estimated PCBsa | <0.20 | 1 |
| Ronnela | <0.01 | 1 |
| Ethiona | <0.02 | 1 |
| Trithiona | <0.05 | 1 |
| Diazinona | <0.10 | 1 |
| Methyl chlorpyrifos | 0.18 | 1 |
| Methyl parathiona | <0.02 | 1 |
| Ethyl parathiona | <0.02 | 1 |
| Malathion | 0.0324 | 1 |
| Endosulfan Ia | <0.01 | 1 |
| Endosulfan IIa | <0.01 | 1 |
| Endosulfane sulfatea | <0.03 | 1 |
Table B-8. Contaminant Levels in NTP-2000 Rat and Mouse Ration in the Two-week Studies
| Level | Number of Samples | |
|---|---|---|
| Contaminants | ||
| Arsenic (ppm) | 0.169 | 1 |
| Cadmium (ppm) | 0.068 | 1 |
| Lead (ppm) | 0.097 | 1 |
| Mercury (ppm) | 0.022 | 1 |
| Selenium (ppm) | 0.252 | 1 |
| Aflatoxins (ppb)a | <5.0 | 1 |
| Nitrate nitrogen (ppm)b | 10 | 1 |
| Nitrite nitrogen (ppm)a,b | <0.61 | 1 |
| BHA (ppm)a,c | <1.00 | 1 |
| BHT (ppm)a,c | <1.00 | 1 |
| Aerobic plate count (CFU/g) | <10.0 | 1 |
| Coliform (MPN/g) | <3.0 | 1 |
| Escherichia coli (MPN/g)a | <10.0 | 1 |
| Salmonella (MPN/g) | Negative | 1 |
| Total nitrosamines (ppb)d | 11.3 | 1 |
| N-Ndimethylamine (ppb)d | 1.1 | 1 |
| N-Npyrrolidine (ppb)d | 10.2 | 1 |
| Pesticides (ppm) | ||
| α-BHCa | <0.01 | 1 |
| β-BHCa | <0.02 | 1 |
| γ-BHCa | <0.01 | 1 |
| δ-BHCa | <0.01 | 1 |
| Heptachlora | <0.01 | 1 |
| Aldrina | <0.01 | 1 |
| Heptachlor epoxidea | <0.01 | 1 |
| DDEa | <0.01 | 1 |
| DDDa | <0.01 | 1 |
| DDTa | <0.01 | 1 |
| HCBa | <0.01 | 1 |
| Mirexa | <0.01 | 1 |
| Methoxychlora | <0.05 | 1 |
| Dieldrina | <0.01 | 1 |
| Endrina | <0.01 | 1 |
| Telodrina | <0.01 | 1 |
| Chlordanea | <0.05 | 1 |
| Toxaphenea | <0.10 | 1 |
| Estimated PCBsa | <0.20 | 1 |
| Ronnela | <0.01 | 1 |
| Ethiona | <0.02 | 1 |
| Trithiona | <0.05 | 1 |
| Diazinona | <0.10 | 1 |
| Methyl chlorpyrifos | 0.18 | 1 |
| Methyl parathiona | <0.02 | 1 |
| Ethyl parathiona | <0.02 | 1 |
| Malathion | 0.0324 | 1 |
| Endosulfan Ia | <0.01 | 1 |
| Endosulfan IIa | <0.01 | 1 |
| Endosulfane sulfatea | <0.03 | 1 |
Table B-9. Contaminant Levels in NTP-2000 Rat and Mouse Ration in the Three-month Studies of 1-Ethyl-3-Methylimidazolium Chloride
| Mean ± Standard Deviation | Range | Number of Samples | |
|---|---|---|---|
| Contaminants | |||
| Arsenic (ppm) | 0.170 ± 0.023 | 0.143–0.192 | 4 |
| Cadmium (ppm) | 0.047 ± 0.006 | 0.043–0.055 | 4 |
| Lead (ppm) | 0.096 ± 0.030 | 0.066–0.122 | 4 |
| Mercury (ppm) | 0.010 ± 0.001 | 0.01–0.011 | 4 |
| Selenium (ppm) | 0.159 ± 0.003 | 0.155–0.162 | 4 |
| Aflatoxins (ppb)a | <5.0 | – | 4 |
| Nitrate nitrogen (ppm)b | 14.23 ± 5.57 | 10.0–22.0 | 4 |
| Nitrite nitrogen (ppm)a,b | <0.61 | – | 4 |
| BHA (ppm)a,c | <1.00 | – | 4 |
| BHT (ppm)a,c | <1.00 | – | 4 |
| Aerobic plate count (CFU/g) | <10.0 | – | 4 |
| Coliform (MPN/g) | <3.0 | – | 4 |
| Escherichia coli (MPN/g)a | <10.0 | – | 4 |
| Salmonella (MPN/g) | Negative | – | 4 |
| Total nitrosamines (ppb)d | 7.625 ± 2.082 | 5.4–9.04 | 4 |
| N-Ndimethylamine (ppb)d | 0.975 ± 1.127 | 0–2 | 4 |
| N-Npyrrolidine (ppb)d | 6.65 ± 0.995 | 5.4–7.5 | 4 |
| Pesticides (ppm) | |||
| α-BHCa | <0.01 | – | 4 |
| β-BHCa | <0.02 | – | 4 |
| γ-BHCa | <0.01 | – | 4 |
| δ-BHCa | <0.01 | – | 4 |
| Heptachlora | <0.01 | – | 4 |
| Aldrina | <0.01 | – | 4 |
| Heptachlor epoxidea | <0.01 | – | 4 |
| DDEa | <0.01 | – | 4 |
| DDDa | <0.01 | – | 4 |
| DDTa | <0.01 | – | 4 |
| HCBa | <0.01 | – | 4 |
| Mirexa | <0.01 | – | 4 |
| Methoxychlora | <0.05 | – | 4 |
| Dieldrina | <0.01 | – | 4 |
| Endrina | <0.01 | – | 4 |
| Telodrina | <0.01 | – | 4 |
| Chlordanea | <0.05 | – | 4 |
| Toxaphenea | <0.10 | – | 4 |
| Estimated PCBsa | <0.20 | – | 4 |
| Ronnela | <0.01 | – | 4 |
| Ethiona | <0.02 | – | 4 |
| Trithiona | <0.05 | – | 4 |
| Diazinona | <0.10 | – | 4 |
| Methyl chlorpyrifos | 0.074 ± 0.055 | 0.02–0.015 | 4 |
| Methyl parathiona | <0.02 | – | 4 |
| Ethyl parathiona | <0.02 | – | 4 |
| Malathion | 0.029 ± 0.014 | 0.02–0.05 | 4 |
| Endosulfan Ia | <0.01 | – | 4 |
| Endosulfan IIa | <0.01 | – | 4 |
| Endosulfane sulfatea | <0.03 | – | 4 |
Table B-9. Contaminant Levels in NTP-2000 Rat and Mouse Ration in the Three-month Studies of 1-Ethyl-3-Methylimidazolium Chloride
| Mean ± Standard Deviation | Range | Number of Samples | |
|---|---|---|---|
| Contaminants | |||
| Arsenic (ppm) | 0.170 ± 0.023 | 0.143–0.192 | 4 |
| Cadmium (ppm) | 0.047 ± 0.006 | 0.043–0.055 | 4 |
| Lead (ppm) | 0.096 ± 0.030 | 0.066–0.122 | 4 |
| Mercury (ppm) | 0.010 ± 0.001 | 0.01–0.011 | 4 |
| Selenium (ppm) | 0.159 ± 0.003 | 0.155–0.162 | 4 |
| Aflatoxins (ppb)a | <5.0 | – | 4 |
| Nitrate nitrogen (ppm)b | 14.23 ± 5.57 | 10.0–22.0 | 4 |
| Nitrite nitrogen (ppm)a,b | <0.61 | – | 4 |
| BHA (ppm)a,c | <1.00 | – | 4 |
| BHT (ppm)a,c | <1.00 | – | 4 |
| Aerobic plate count (CFU/g) | <10.0 | – | 4 |
| Coliform (MPN/g) | <3.0 | – | 4 |
| Escherichia coli (MPN/g)a | <10.0 | – | 4 |
| Salmonella (MPN/g) | Negative | – | 4 |
| Total nitrosamines (ppb)d | 7.625 ± 2.082 | 5.4–9.04 | 4 |
| N-Ndimethylamine (ppb)d | 0.975 ± 1.127 | 0–2 | 4 |
| N-Npyrrolidine (ppb)d | 6.65 ± 0.995 | 5.4–7.5 | 4 |
| Pesticides (ppm) | |||
| α-BHCa | <0.01 | – | 4 |
| β-BHCa | <0.02 | – | 4 |
| γ-BHCa | <0.01 | – | 4 |
| δ-BHCa | <0.01 | – | 4 |
| Heptachlora | <0.01 | – | 4 |
| Aldrina | <0.01 | – | 4 |
| Heptachlor epoxidea | <0.01 | – | 4 |
| DDEa | <0.01 | – | 4 |
| DDDa | <0.01 | – | 4 |
| DDTa | <0.01 | – | 4 |
| HCBa | <0.01 | – | 4 |
| Mirexa | <0.01 | – | 4 |
| Methoxychlora | <0.05 | – | 4 |
| Dieldrina | <0.01 | – | 4 |
| Endrina | <0.01 | – | 4 |
| Telodrina | <0.01 | – | 4 |
| Chlordanea | <0.05 | – | 4 |
| Toxaphenea | <0.10 | – | 4 |
| Estimated PCBsa | <0.20 | – | 4 |
| Ronnela | <0.01 | – | 4 |
| Ethiona | <0.02 | – | 4 |
| Trithiona | <0.05 | – | 4 |
| Diazinona | <0.10 | – | 4 |
| Methyl chlorpyrifos | 0.074 ± 0.055 | 0.02–0.015 | 4 |
| Methyl parathiona | <0.02 | – | 4 |
| Ethyl parathiona | <0.02 | – | 4 |
| Malathion | 0.029 ± 0.014 | 0.02–0.05 | 4 |
| Endosulfan Ia | <0.01 | – | 4 |
| Endosulfan IIa | <0.01 | – | 4 |
| Endosulfane sulfatea | <0.03 | – | 4 |
Table B-10. Contaminant Levels in NTP-2000 Rat and Mouse Ration in the Three-month Studies of 1-Butyl-3-Methylimidazolium Chloride
| Mean ± Standard Deviation | Range | Number of Samples | |
|---|---|---|---|
| Contaminants | |||
| Arsenic (ppm) | 0.163 ± 0.021 | 0.143–0.192 | 4 |
| Cadmium (ppm) | 0.046 ± 0.004 | 0.043–0.052 | 4 |
| Lead (ppm) | 0.084 ± 0.025 | 0.066–0.121 | 4 |
| Mercury (ppm) | 0.01 | 0.01–0.01 | 4 |
| Selenium (ppm) | 0.155 ± 0.005 | 0.147–0.159 | 4 |
| Aflatoxins (ppb)a | <5.0 | – | 4 |
| Nitrate nitrogen (ppm)b | 18.83 ± 8.29 | 10.0–28.8 | 4 |
| Nitrite nitrogen (ppm)a,b | <0.61 | – | 4 |
| BHA (ppm)a,c | <1.00 | – | 4 |
| BHT (ppm)a,c | <1.00 | – | 4 |
| Aerobic plate count (CFU/g) | <10.0 | – | 4 |
| Coliform (MPN/g) | <3.0 | – | 4 |
| Escherichia coli (MPN/g)a | <10.0 | – | 4 |
| Salmonella (MPN/g) | Negative | – | 4 |
| Total nitrosamines (ppb)d | 6.125 ± 2.497 | 3.4–9.4 | 4 |
| N-Ndimethylamine (ppb)d | 0.65 ± 0.896 | 0.0–1.9 | 4 |
| N-Npyrrolidine (ppb)d | 5.475 ± 2.040 | 2.7–7.5 | 4 |
| Pesticides (ppm) | |||
| α-BHCa | <0.01 | – | 4 |
| β-BHCa | <0.02 | – | 4 |
| γ-BHCa | <0.01 | – | 4 |
| δ-BHCa | <0.01 | – | 4 |
| Heptachlora | <0.01 | – | 4 |
| Aldrina | <0.01 | – | 4 |
| Heptachlor epoxidea | <0.01 | – | 4 |
| DDEa | <0.01 | – | 4 |
| DDDa | <0.01 | – | 4 |
| DDTa | <0.01 | – | 4 |
| HCBa | <0.01 | – | 4 |
| Mirexa | <0.01 | – | 4 |
| Methoxychlora | <0.05 | – | 4 |
| Dieldrina | <0.01 | – | 4 |
| Endrina | <0.01 | – | 4 |
| Telodrina | <0.01 | – | 4 |
| Chlordanea | <0.05 | – | 4 |
| Toxaphenea | <0.10 | – | 4 |
| Estimated PCBsa | <0.20 | – | 4 |
| Ronnela | <0.01 | – | 4 |
| Ethiona | <0.02 | – | 4 |
| Trithiona | <0.05 | – | 4 |
| Diazinona | <0.10 | – | 4 |
| Methyl chlorpyrifos | 0.065 ± 0.061 | 0.02–0.15 | 4 |
| Methyl parathiona | <0.02 | – | 4 |
| Ethyl parathiona | <0.02 | – | 4 |
| Malathion | 0.0213 ± 0.003 | 0.02–0.025 | 4 |
| Endosulfan Ia | <0.01 | – | 4 |
| Endosulfan IIa | <0.01 | – | 4 |
| Endosulfane sulfatea | <0.03 | – | 4 |
Table B-10. Contaminant Levels in NTP-2000 Rat and Mouse Ration in the Three-month Studies of 1-Butyl-3-Methylimidazolium Chloride
| Mean ± Standard Deviation | Range | Number of Samples | |
|---|---|---|---|
| Contaminants | |||
| Arsenic (ppm) | 0.163 ± 0.021 | 0.143–0.192 | 4 |
| Cadmium (ppm) | 0.046 ± 0.004 | 0.043–0.052 | 4 |
| Lead (ppm) | 0.084 ± 0.025 | 0.066–0.121 | 4 |
| Mercury (ppm) | 0.01 | 0.01–0.01 | 4 |
| Selenium (ppm) | 0.155 ± 0.005 | 0.147–0.159 | 4 |
| Aflatoxins (ppb)a | <5.0 | – | 4 |
| Nitrate nitrogen (ppm)b | 18.83 ± 8.29 | 10.0–28.8 | 4 |
| Nitrite nitrogen (ppm)a,b | <0.61 | – | 4 |
| BHA (ppm)a,c | <1.00 | – | 4 |
| BHT (ppm)a,c | <1.00 | – | 4 |
| Aerobic plate count (CFU/g) | <10.0 | – | 4 |
| Coliform (MPN/g) | <3.0 | – | 4 |
| Escherichia coli (MPN/g)a | <10.0 | – | 4 |
| Salmonella (MPN/g) | Negative | – | 4 |
| Total nitrosamines (ppb)d | 6.125 ± 2.497 | 3.4–9.4 | 4 |
| N-Ndimethylamine (ppb)d | 0.65 ± 0.896 | 0.0–1.9 | 4 |
| N-Npyrrolidine (ppb)d | 5.475 ± 2.040 | 2.7–7.5 | 4 |
| Pesticides (ppm) | |||
| α-BHCa | <0.01 | – | 4 |
| β-BHCa | <0.02 | – | 4 |
| γ-BHCa | <0.01 | – | 4 |
| δ-BHCa | <0.01 | – | 4 |
| Heptachlora | <0.01 | – | 4 |
| Aldrina | <0.01 | – | 4 |
| Heptachlor epoxidea | <0.01 | – | 4 |
| DDEa | <0.01 | – | 4 |
| DDDa | <0.01 | – | 4 |
| DDTa | <0.01 | – | 4 |
| HCBa | <0.01 | – | 4 |
| Mirexa | <0.01 | – | 4 |
| Methoxychlora | <0.05 | – | 4 |
| Dieldrina | <0.01 | – | 4 |
| Endrina | <0.01 | – | 4 |
| Telodrina | <0.01 | – | 4 |
| Chlordanea | <0.05 | – | 4 |
| Toxaphenea | <0.10 | – | 4 |
| Estimated PCBsa | <0.20 | – | 4 |
| Ronnela | <0.01 | – | 4 |
| Ethiona | <0.02 | – | 4 |
| Trithiona | <0.05 | – | 4 |
| Diazinona | <0.10 | – | 4 |
| Methyl chlorpyrifos | 0.065 ± 0.061 | 0.02–0.15 | 4 |
| Methyl parathiona | <0.02 | – | 4 |
| Ethyl parathiona | <0.02 | – | 4 |
| Malathion | 0.0213 ± 0.003 | 0.02–0.025 | 4 |
| Endosulfan Ia | <0.01 | – | 4 |
| Endosulfan IIa | <0.01 | – | 4 |
| Endosulfane sulfatea | <0.03 | – | 4 |
Table B-11. Contaminant Levels in NTP-2000 Rat and Mouse Ration in the Three-Month Studies of 1-Butyl-1-Methylpyrrolidinium Chloride
| Mean ± Standard Deviation | Range | Number of Samples | |
|---|---|---|---|
| Contaminants | |||
| Arsenic (ppm) | 0.171 ± 0.023 | 0.149–0.196 | 4 |
| Cadmium (ppm) | 0.052 ± 0.005 | 0.046–0.058 | 4 |
| Lead (ppm) | 0.104 ± 0.020 | 0.078–0.122 | 4 |
| Mercury (ppm) | 0.011 ± 0.001 | 0.01–0.011 | 4 |
| Selenium (ppm) | 0.173 ± 0.01 | 0.162–0.186 | 4 |
| Aflatoxins (ppb)a | <5.0 | – | 4 |
| Nitrate nitrogen (ppm)b | 22.38 ± 16.84 | 10–45.9 | 4 |
| Nitrite nitrogen (ppm)a,b | <0.61 | – | 4 |
| BHA (ppm)a,c | <1.00 | – | 4 |
| BHT (ppm)a,c | <1.00 | – | 4 |
| Aerobic plate count (CFU/g) | 46.25 ± 44.98 | 10–110 | 4 |
| Coliform (MPN/g) | <3.0 | – | 4 |
| Escherichia coli (MPN/g)a | <10.0 | – | 4 |
| Salmonella (MPN/g) | Negative | – | 4 |
| Total nitrosamines (ppb)d | 9.9 ± 2.23 | 7.4–12.8 | 4 |
| N-Ndimethylamine (ppb)d | 2.175 ± 1.978 | 0–4.8 | 4 |
| N-Npyrrolidine (ppb)d | 7.725 ± 0.378 | 7.4–8.1 | 4 |
| Pesticides (ppm) | |||
| α-BHCa | <0.01 | – | 4 |
| β-BHCa | <0.02 | – | 4 |
| γ-BHCa | <0.01 | – | 4 |
| δ-BHCa | <0.01 | – | 4 |
| Heptachlora | <0.01 | – | 4 |
| Aldrina | <0.01 | – | 4 |
| Heptachlor epoxidea | <0.01 | – | 4 |
| DDEa | <0.01 | – | 4 |
| DDDa | <0.01 | – | 4 |
| DDTa | <0.01 | – | 4 |
| HCBa | <0.01 | – | 4 |
| Mirexa | <0.01 | – | 4 |
| Methoxychlora | <0.05 | – | 4 |
| Dieldrina | <0.01 | – | 4 |
| Endrina | <0.01 | – | 4 |
| Telodrina | <0.01 | – | 4 |
| Chlordanea | <0.05 | – | 4 |
| Toxaphenea | <0.10 | – | 4 |
| Estimated PCBsa | <0.20 | – | 4 |
| Ronnela | <0.01 | – | 4 |
| Ethiona | <0.02 | – | 4 |
| Trithiona | <0.05 | – | 4 |
| Diazinona | <0.10 | – | 4 |
| Methyl chlorpyrifos | 0.058 ± 0.025 | 0.025–0.084 | 4 |
| Methyl parathiona | <0.02 | – | 4 |
| Ethyl parathiona | <0.02 | – | 4 |
| Malathion | 0.090 ± 0.067 | 0.02–0.169 | 4 |
| Endosulfan Ia | <0.01 | – | 4 |
| Endosulfan IIa | <0.01 | – | 4 |
| Endosulfane sulfatea | <0.03 | – | 4 |
Table B-11. Contaminant Levels in NTP-2000 Rat and Mouse Ration in the Three-Month Studies of 1-Butyl-1-Methylpyrrolidinium Chloride
| Mean ± Standard Deviation | Range | Number of Samples | |
|---|---|---|---|
| Contaminants | |||
| Arsenic (ppm) | 0.171 ± 0.023 | 0.149–0.196 | 4 |
| Cadmium (ppm) | 0.052 ± 0.005 | 0.046–0.058 | 4 |
| Lead (ppm) | 0.104 ± 0.020 | 0.078–0.122 | 4 |
| Mercury (ppm) | 0.011 ± 0.001 | 0.01–0.011 | 4 |
| Selenium (ppm) | 0.173 ± 0.01 | 0.162–0.186 | 4 |
| Aflatoxins (ppb)a | <5.0 | – | 4 |
| Nitrate nitrogen (ppm)b | 22.38 ± 16.84 | 10–45.9 | 4 |
| Nitrite nitrogen (ppm)a,b | <0.61 | – | 4 |
| BHA (ppm)a,c | <1.00 | – | 4 |
| BHT (ppm)a,c | <1.00 | – | 4 |
| Aerobic plate count (CFU/g) | 46.25 ± 44.98 | 10–110 | 4 |
| Coliform (MPN/g) | <3.0 | – | 4 |
| Escherichia coli (MPN/g)a | <10.0 | – | 4 |
| Salmonella (MPN/g) | Negative | – | 4 |
| Total nitrosamines (ppb)d | 9.9 ± 2.23 | 7.4–12.8 | 4 |
| N-Ndimethylamine (ppb)d | 2.175 ± 1.978 | 0–4.8 | 4 |
| N-Npyrrolidine (ppb)d | 7.725 ± 0.378 | 7.4–8.1 | 4 |
| Pesticides (ppm) | |||
| α-BHCa | <0.01 | – | 4 |
| β-BHCa | <0.02 | – | 4 |
| γ-BHCa | <0.01 | – | 4 |
| δ-BHCa | <0.01 | – | 4 |
| Heptachlora | <0.01 | – | 4 |
| Aldrina | <0.01 | – | 4 |
| Heptachlor epoxidea | <0.01 | – | 4 |
| DDEa | <0.01 | – | 4 |
| DDDa | <0.01 | – | 4 |
| DDTa | <0.01 | – | 4 |
| HCBa | <0.01 | – | 4 |
| Mirexa | <0.01 | – | 4 |
| Methoxychlora | <0.05 | – | 4 |
| Dieldrina | <0.01 | – | 4 |
| Endrina | <0.01 | – | 4 |
| Telodrina | <0.01 | – | 4 |
| Chlordanea | <0.05 | – | 4 |
| Toxaphenea | <0.10 | – | 4 |
| Estimated PCBsa | <0.20 | – | 4 |
| Ronnela | <0.01 | – | 4 |
| Ethiona | <0.02 | – | 4 |
| Trithiona | <0.05 | – | 4 |
| Diazinona | <0.10 | – | 4 |
| Methyl chlorpyrifos | 0.058 ± 0.025 | 0.025–0.084 | 4 |
| Methyl parathiona | <0.02 | – | 4 |
| Ethyl parathiona | <0.02 | – | 4 |
| Malathion | 0.090 ± 0.067 | 0.02–0.169 | 4 |
| Endosulfan Ia | <0.01 | – | 4 |
| Endosulfan IIa | <0.01 | – | 4 |
| Endosulfane sulfatea | <0.03 | – | 4 |
Table B-12. Contaminant Levels in NTP-2000 Rat and Mouse Ration in the Three-month Studies of N-Butylpyridinium Chloride
| Mean ± Standard Deviation | Range | Number of Samples | |
|---|---|---|---|
| Contaminants | |||
| Arsenic (ppm) | 0.179 ± 0.033 | 0.149–0.216 | 4 |
| Cadmium (ppm) | 0.051 ± 0.005 | 0.046–0.058 | 4 |
| Lead (ppm) | 0.101 ± 0.162 | 0.078–0.115 | 4 |
| Mercury (ppm) | 0.010 ± 0.001 | 0.01–0.011 | 4 |
| Selenium (ppm) | 0.171 ± 0.013 | 0.155–0.186 | 4 |
| Aflatoxins (ppb)a | <5.0 | – | 4 |
| Nitrate nitrogen (ppm)b | 26.625 ± 5.57 | 10.0–45.9 | 4 |
| Nitrite nitrogen (ppm)a,b | <0.61 | – | 4 |
| BHA (ppm)a,c | <1.00 | – | 4 |
| BHT (ppm)a,c | <1.00 | – | 4 |
| Aerobic plate count (CFU/g) | 46.25 ± 44.98 | 10–110 | 4 |
| Coliform (MPN/g) | <3.0 | – | 4 |
| Escherichia coli (MPN/g)a | <10.0 | – | 4 |
| Salmonella (MPN/g) | Negative | – | 4 |
| Total nitrosamines (ppb)d | 9.75 ± 2.29 | 7.4–12.8 | 4 |
| N-Ndimethylamine (ppb)d | 1.975 ± 2.040 | 0–4.8 | 4 |
| N-Npyrrolidine (ppb)d | 7.775 ± 0.330 | 7.4–8.1 | 4 |
| Pesticides (ppm) | |||
| α-BHCa | <0.01 | – | 4 |
| β-BHCa | <0.02 | – | 4 |
| γ-BHCa | <0.01 | – | 4 |
| δ-BHCa | <0.01 | – | 4 |
| Heptachlora | <0.01 | – | 4 |
| Aldrina | <0.01 | – | 4 |
| Heptachlor epoxidea | <0.01 | – | 4 |
| DDEa | <0.01 | – | 4 |
| DDDa | <0.01 | – | 4 |
| DDTa | <0.01 | – | 4 |
| HCBa | <0.01 | – | 4 |
| Mirexa | <0.01 | – | 4 |
| Methoxychlora | <0.05 | – | 4 |
| Dieldrina | <0.01 | – | 4 |
| Endrina | <0.01 | – | 4 |
| Telodrina | <0.01 | – | 4 |
| Chlordanea | <0.05 | – | 4 |
| Toxaphenea | <0.10 | – | 4 |
| Estimated PCBsa | <0.20 | – | 4 |
| Ronnela | <0.01 | – | 4 |
| Ethiona | <0.02 | – | 4 |
| Trithiona | <0.05 | – | 4 |
| Diazinona | <0.10 | – | 4 |
| Methyl chlorpyrifos | 0.216 ± 0.315 | 0.025–0.686 | 4 |
| Methyl parathiona | <0.02 | – | 4 |
| Ethyl parathiona | <0.02 | – | 4 |
| Malathion | 0.082 ± 0.074 | 0.02–0.169 | 4 |
| Endosulfan Ia | <0.01 | – | 4 |
| Endosulfan IIa | <0.01 | – | 4 |
| Endosulfane sulfatea | <0.03 | – | 4 |
Table B-12. Contaminant Levels in NTP-2000 Rat and Mouse Ration in the Three-month Studies of N-Butylpyridinium Chloride
| Mean ± Standard Deviation | Range | Number of Samples | |
|---|---|---|---|
| Contaminants | |||
| Arsenic (ppm) | 0.179 ± 0.033 | 0.149–0.216 | 4 |
| Cadmium (ppm) | 0.051 ± 0.005 | 0.046–0.058 | 4 |
| Lead (ppm) | 0.101 ± 0.162 | 0.078–0.115 | 4 |
| Mercury (ppm) | 0.010 ± 0.001 | 0.01–0.011 | 4 |
| Selenium (ppm) | 0.171 ± 0.013 | 0.155–0.186 | 4 |
| Aflatoxins (ppb)a | <5.0 | – | 4 |
| Nitrate nitrogen (ppm)b | 26.625 ± 5.57 | 10.0–45.9 | 4 |
| Nitrite nitrogen (ppm)a,b | <0.61 | – | 4 |
| BHA (ppm)a,c | <1.00 | – | 4 |
| BHT (ppm)a,c | <1.00 | – | 4 |
| Aerobic plate count (CFU/g) | 46.25 ± 44.98 | 10–110 | 4 |
| Coliform (MPN/g) | <3.0 | – | 4 |
| Escherichia coli (MPN/g)a | <10.0 | – | 4 |
| Salmonella (MPN/g) | Negative | – | 4 |
| Total nitrosamines (ppb)d | 9.75 ± 2.29 | 7.4–12.8 | 4 |
| N-Ndimethylamine (ppb)d | 1.975 ± 2.040 | 0–4.8 | 4 |
| N-Npyrrolidine (ppb)d | 7.775 ± 0.330 | 7.4–8.1 | 4 |
| Pesticides (ppm) | |||
| α-BHCa | <0.01 | – | 4 |
| β-BHCa | <0.02 | – | 4 |
| γ-BHCa | <0.01 | – | 4 |
| δ-BHCa | <0.01 | – | 4 |
| Heptachlora | <0.01 | – | 4 |
| Aldrina | <0.01 | – | 4 |
| Heptachlor epoxidea | <0.01 | – | 4 |
| DDEa | <0.01 | – | 4 |
| DDDa | <0.01 | – | 4 |
| DDTa | <0.01 | – | 4 |
| HCBa | <0.01 | – | 4 |
| Mirexa | <0.01 | – | 4 |
| Methoxychlora | <0.05 | – | 4 |
| Dieldrina | <0.01 | – | 4 |
| Endrina | <0.01 | – | 4 |
| Telodrina | <0.01 | – | 4 |
| Chlordanea | <0.05 | – | 4 |
| Toxaphenea | <0.10 | – | 4 |
| Estimated PCBsa | <0.20 | – | 4 |
| Ronnela | <0.01 | – | 4 |
| Ethiona | <0.02 | – | 4 |
| Trithiona | <0.05 | – | 4 |
| Diazinona | <0.10 | – | 4 |
| Methyl chlorpyrifos | 0.216 ± 0.315 | 0.025–0.686 | 4 |
| Methyl parathiona | <0.02 | – | 4 |
| Ethyl parathiona | <0.02 | – | 4 |
| Malathion | 0.082 ± 0.074 | 0.02–0.169 | 4 |
| Endosulfan Ia | <0.01 | – | 4 |
| Endosulfan IIa | <0.01 | – | 4 |
| Endosulfane sulfatea | <0.03 | – | 4 |
Appendix C. Sentinel Animal Program
C.1. Methods
Rodents used in the National Toxicology Program are produced in optimally clean facilities to eliminate potential pathogens that might affect study results. The Sentinel Animal Program is part of the periodic monitoring of animal health that occurs during the toxicological evaluation of test compounds. Under this program, the disease state of the rodents is monitored via sera or feces from extra (sentinel) or exposed animals in the study rooms. The sentinel animals and the study animals are subject to identical environmental conditions. Furthermore, the sentinel animals come from the same production source and weanling groups as the animals used for the studies of test compounds.
In these toxicity studies, blood samples were collected from each sentinel animal and allowed to clot, and the serum was separated. Additionally, fecal samples were collected and tested for endoparasites and Helicobacter species. All samples were processed appropriately with serology testing sent to IDEXX BioResearch (formerly Rodent Animal Diagnostic Laboratory [RADIL], University of Missouri), Columbia, MO, for determination of the presence of pathogens. Evaluation for endo- and ectoparasites was performed in-house by the testing laboratory.
The laboratory methods and agents for which testing was performed are tabulated below; the times at which samples were collected during the studies are also listed (Table C-1, Table C-2, Table C-3, Table C-4, Table C-5, Table C-6, Table C-7, Table C-8).
C.2. Results
C.2.1. 1-Ethyl-3-Methylimidazolium Chloride (Emim-Cl)
Rats: All test results were negative.
Mice: All test results were negative.
Table C-1. Methods and Results for Sentinel Animal Testing in Male and Female Rats in the Three-month Study of 1-Ethyl-3-Methylimidazolium Chloride
| Collection Time Points | Quarantine | 4 Weeks | Study Termination |
|---|---|---|---|
| Number examined (males/females) | 5/5 | 5/5 | 5/5 |
| Method/test | |||
| Multiplex fluorescent immunoassay (MFI) | |||
| Kilham rat virus (KRV) | − | − | − |
| Mycoplasma pulmonis | − | − | − |
| Parvo NS-1 | − | − | − |
| Pneumonia virus of mice (PVM) | − | − | − |
| Rat coronavirus/sialodacryoadenitis virus (RCV/SDA) | − | − | − |
| Rat minute virus (RMV) | − | − | − |
| Rat parvo virus (RPV) | − | − | − |
| Rat theilovirus (RTV) | − | − | − |
| Sendai | − | − | − |
| Theiler’s murine encephalomyelitis virus (TMEV) | − | − | − |
| Toolan’s H-1 | − | − | − |
| Immunofluorescence assay (IFA) | |||
| Pneumocystis carinii | NT | NT | − |
| In-house evaluation | |||
| Endoparasites (evaluation of cecal content) | − | − | NT |
| Ectoparasites (evaluation of perianal surface) | − | − | NT |
Table C-2. Methods and Results for Sentinel Animal Testing in Male and Female Mice in the Three-month Study of 1-Ethyl-3-Methylimidazolium Chloride
| Collection Time Points | Quarantine | 4 Weeks | Study Termination |
|---|---|---|---|
| Number examined (males/females) | 5/5 | 5/5 | 5/5 |
| Method/test | |||
| Multiplex fluorescent immunoassay (MFI) | |||
| Ectromelia virus | − | − | − |
| Epizootic diarrhea of infant mice (EDIM) | − | − | − |
| Lymphocytic choriomeningitis virus | − | − | − |
| Mycoplasma pulmonis | − | − | − |
| Mouse hepatitis virus (MHV) | − | − | − |
| Mouse norovirus (MNV) | − | − | − |
| Parvo NS-1 | |||
| Mouse parvovirus (MPV) | − | − | − |
| Minute virus of mice (MVM) | − | − | − |
| Pneumonia virus of mice (PVM) | − | − | − |
| Reovirus (REO3) | − | − | − |
| Sendai | − | − | − |
| Theiler’s murine encephalomyelitis virus (TMEV) GDVII | − | − | − |
| In-house evaluation | |||
| Endoparasites (evaluation of cecal content) | − | − | NT |
| Ectoparasites (evaluation of perianal surface) | − | − | NT |
C.2.2. 1-Butyl-3-Methylimidazolium Chloride (Bmim-Cl)
Rats: All test results were negative.
Mice: All test results were negative.
Table C-3. Methods and Results for Sentinel Animal Testing in Male and Female Rats in the Three-month Study of 1-Butyl-3-Methylimidazolium Chloride
| Collection Time Points | Quarantine | 4 Weeks | Study Termination |
|---|---|---|---|
| Number examined (males/females) | 5/5 | 5/5 | 5/5 |
| Method/test | |||
| Multiplex fluorescent immunoassay (MFI) | |||
| Kilham rat virus (KRV) | − | − | − |
| Mycoplasma pulmonis | − | − | − |
| Parvo NS-1 | − | − | − |
| Pneumonia virus of mice (PVM) | − | − | − |
| Rat coronavirus/sialodacryoadenitis virus (RCV/SDA) | − | − | − |
| Rat minute virus (RMV) | − | − | − |
| Rat parvo virus (RPV) | − | − | − |
| Rat theilovirus (RTV) | − | − | − |
| Sendai | − | − | − |
| Theiler’s murine encephalomyelitis virus (TMEV) | − | − | − |
| Toolan’s H-1 | − | − | − |
| Immunofluorescence assay (IFA) | |||
| Pneumocystis carinii | NT | NT | − |
| Rat coronavirus/sialodacryoadenitis virus (RCV/SDA) | NT | NT | − |
| In-house evaluation | |||
| Endoparasites (evaluation of cecal content) | − | − | NT |
| Ectoparasites (evaluation of perianal surface) | − | − | NT |
Table C-4. Methods and Results for Sentinel Animal Testing in Male and Female Mice in the Three-month Study of 1-Butyl-3-Methylimidazolium Chloride
| Collection Time Points | Quarantine | 4 Weeks | Study Termination |
|---|---|---|---|
| Number examined (males/females) | 5/5 | 5/5 | 5/5 |
| Method/test | |||
| Multiplex fluorescent immunoassay (MFI) | |||
| Ectromelia virus | − | − | − |
| Epizootic diarrhea of infant mice (EDIM) | − | − | − |
| Lymphocytic choriomeningitis virus | − | − | − |
| Mycoplasma pulmonis | − | − | − |
| Mouse hepatitis virus (MHV) | − | − | − |
| Mouse norovirus (MNV) | − | − | − |
| Parvo NS-1 | − | − | − |
| Mouse parvovirus (MPV) | − | − | − |
| Minute virus of mice (MVM) | − | − | − |
| Pneumonia virus of mice (PVM) | − | − | − |
| Reovirus (REO3) | − | − | − |
| Sendai | − | − | − |
| Theiler’s murine encephalomyelitis virus (TMEV) GDVII | − | − | − |
| In-house evaluation | |||
| Endoparasites (evaluation of cecal content) | − | − | NT |
| Ectoparasites (evaluation of perianal surface) | − | − | NT |
C.2.3. 1-Butyl-1-Methylpyrrolidinium Chloride (Bmpy-Cl)
Rats: All test results were negative.
Mice: All test results were negative.
Table C-5. Methods and Results for Sentinel Animal Testing in Male and Female Rats in the Three-month Study of 1-Butyl-1-Methylpyrrolidinium Chloride
| Collection Time Points | Quarantine | 4 Weeks | Study Termination |
|---|---|---|---|
| Number examined (males/females) | 5/5 | 5/5 | 5/5 |
| Method/test | |||
| Multiplex fluorescent immunoassay (MFI) | |||
| Kilham rat virus (KRV) | − | − | − |
| Mycoplasma pulmonis | − | − | − |
| Parvo NS-1 | − | − | − |
| Pneumonia virus of mice (PVM) | − | − | − |
| Rat coronavirus/sialodacryoadenitis virus (RCV/SDA) | − | − | − |
| Rat minute virus (RMV) | − | − | − |
| Rat parvo virus (RPV) | − | − | − |
| Rat theilovirus (RTV) | − | − | − |
| Sendai | − | − | − |
| Theiler’s murine encephalomyelitis virus (TMEV) | − | − | − |
| Toolan’s H-1 | − | − | − |
| Immunofluorescence assay (IFA) | |||
| Pneumocystis carinii | NT | NT | − |
| In-house evaluation | |||
| Endoparasites (evaluation of cecal content) | − | − | NT |
| Ectoparasites (evaluation of perianal surface) | − | − | NT |
Table C-6. Methods and Results for Sentinel Animal Testing in Male and Female Mice in the Three-month Study of 1-Butyl-1-Methylpyrrolidinium Chloride
| Collection Time Points | Quarantine | 4 Weeks | Study Termination |
|---|---|---|---|
| Number examined (males/females) | 5/5 | 5/5 | 5/5 |
| Method/test | |||
| Multiplex fluorescent immunoassay (MFI) | |||
| Ectromelia virus | − | − | − |
| Epizootic diarrhea of infant mice (EDIM) | − | − | − |
| Lymphocytic choriomeningitis virus | − | − | − |
| Mycoplasma pulmonis | − | − | − |
| Mouse hepatitis virus (MHV) | − | − | − |
| Mouse norovirus (MNV) | − | − | − |
| Parvo NS-1 | − | − | − |
| Mouse parvovirus (MPV) | − | − | − |
| Minute virus of mice (MVM) | − | − | − |
| Pneumonia virus of mice (PVM) | − | − | − |
| Reovirus (REO3) | − | − | − |
| Sendai | − | − | − |
| Theiler’s murine encephalomyelitis virus (TMEV) GDVII | − | − | − |
| In-house evaluation | |||
| Endoparasites (evaluation of cecal content) | − | − | NT |
| Ectoparasites (evaluation of perianal surface) | − | − | NT |
C.2.4. N-Butylpyridinium Chloride (NBuPy-Cl)
Rats: All test results were negative.
Mice: All test results were negative.
Table C-7. Methods and Results for Sentinel Animal Testing in Male and Female Rats in the Three-month Study of N-Butylpyridinium Chloride
| Collection Time Points | Quarantine | 4 Weeks | Study Termination |
|---|---|---|---|
| Number examined (males/females) | 5/5 | 5/5 | 5/5 |
| Method/test | |||
| Multiplex fluorescent immunoassay (MFI) | |||
| Kilham rat virus (KRV) | − | − | − |
| Mycoplasma pulmonis | − | − | − |
| Parvo NS-1 | − | − | − |
| Pneumonia virus of mice (PVM) | − | − | − |
| Rat coronavirus/sialodacryoadenitis virus (RCV/SDA) | − | − | − |
| Rat minute virus (RMV) | − | − | − |
| Rat parvo virus (RPV) | − | − | − |
| Rat theilovirus (RTV) | − | − | − |
| Sendai | − | − | − |
| Theiler’s murine encephalomyelitis virus (TMEV) | − | − | − |
| Toolan’s H-1 | − | − | − |
| Immunofluorescence assay (IFA) | |||
| Pneumocystis carinii | NT | NT | − |
| In-house evaluation | |||
| Endoparasites (evaluation of cecal content) | − | − | NT |
| Ectoparasites (evaluation of perianal surface) | − | − | NT |
Table C-8. Methods and Results for Sentinel Animal Testing in Male and Female Mice in the Three-month Study of N-Butylpyridinium Chloride
| Collection Time Points | Quarantine | 4 Weeks | Study Termination |
|---|---|---|---|
| Number examined (males/females) | 5/5 | 5/5 | 5/5 |
| Method/test | |||
| Multiplex fluorescent immunoassay (MFI) | |||
| Ectromelia virus | − | − | − |
| Epizootic diarrhea of infant mice (EDIM) | − | − | − |
| Lymphocytic choriomeningitis virus | − | − | − |
| Mycoplasma pulmonis | − | − | − |
| Mouse hepatitis virus (MHV) | − | − | − |
| Mouse norovirus (MNV) | − | − | − |
| Parvo NS-1 | − | − | − |
| Mouse parvovirus (MPV) | − | − | − |
| Minute virus of mice (MVM) | − | − | − |
| Pneumonia virus of mice (PVM) | − | − | − |
| Reovirus (REO3) | − | − | − |
| Sendai | − | − | − |
| Theiler’s murine encephalomyelitis virus (TMEV) GDVII | − | − | − |
| In-house evaluation | |||
| Endoparasites (evaluation of cecal content) | − | − | NT |
| Ectoparasites (evaluation of perianal surface) | − | − | NT |
Appendix D. Genetic Toxicology
D.1. Evaluation Protocol
The National Toxicology Program (NTP) considers biological as well as statistical factors to determine an overall assay result. For an individual assay, the statistical procedures for data analysis are described in the following protocols. There have been instances, however, in which multiple samples of a chemical were tested in the same assay, and different results were obtained among these samples and/or among laboratories. In such cases, all the data are critically evaluated with attention given to possible protocol variations in determining the weight of evidence for an overall conclusion of chemical activity in an assay. For in vitro assays conducted with and without exogenous metabolic activation, results obtained in the absence of activation are analyzed separately from results obtained in the presence of activation. The summary table in the abstract of this toxicity report presents NTP’s scientific judgment regarding the overall evidence for activity of the chemical in an assay.
D.2. Bacterial Mutagenicity
D.2.1. Bacterial Mutagenicity Test Protocol
Testing procedures were modified from those originally reported by Zeiger et al.138 Coded samples of the same chemical lots used in the 3-month studies of ionic liquids (ILs; 1-ethyl-3-methylimidazolium chloride [Emim-Cl], 1-butyl-3-methylimidazolium chloride [Bmim-Cl], 1-butyl-1-methylpyrrolidinium chloride [Bmpy-Cl], or n-butylpyridinium chloride [NBuPy-Cl]) were incubated with the Salmonella typhimurium (TA98, TA100) or Escherichia coli WP2 uvrA (pKM101) tester strains, either in buffer or S9 mix (metabolic activation enzymes and cofactors from Aroclor 125-induced male Sprague Dawley rat liver [Moltox, Boone, NC]) for 20 minutes at 37°C. Top agar supplemented with L-histidine (or tryptophan for the E. coli strain) and d-biotin was added, and the contents of the tubes were mixed and poured onto the surfaces of minimal glucose agar plates. Histidine- or tryptophan-independent mutant colonies arising on these plates were counted after incubation for 2 days at 37°C.
138. Zeiger E, Anderson B, Haworth S, Lawlor T, Mortelmans K. Salmonella mutagenicity tests: V. Results from the testing of 311 chemicals. Environ Mol Mutagen. 1992; 19 Suppl 21:2-141. DOI: 10.1002/em.2850190603 PubMed: 1541260
Each trial consisted of triplicate plates of concurrent positive and negative controls and five doses of each IL. The highest concentration tested was 10,000 μg/plate for each IL. All trials were repeated.
In this assay, a positive response is defined as a reproducible, dose-related increase in histidine-independent (revertant) colonies in any one strain/activation combination. An equivocal response is defined as an increase in revertants that is not dose-related, is not reproducible, or is not of sufficient magnitude to support a determination of mutagenicity. A negative response is obtained when no increase in revertant colonies is observed after chemical treatment. No minimum percentage or fold increase is required for a chemical to be judged positive or weakly positive, although positive calls are typically reserved for increases in mutant colonies that are at least twofold over background.
D.2.2. Results
The four ILs were tested for induction of gene mutations in the bacterial mutation (Ames) assay. All four ILs—Emim-Cl, Bmim-Cl, Bmpy-Cl, and NBuPy-Cl—were negative for induction of gene mutations in three strains of bacteria (S. typhimurium strains TA98 and TA100, and E. coli strain WP2 uvrA [pKM101]), tested with and without induced rat liver S9 mix at doses up to 10,000 μg/plate (Table D-1, Table D-2, Table D-3, Table D-4).
Table D-1. Mutagenicity of 1-Ethyl-3-Methylimidazolium Chloride in Bacterial Tester Strainsa
| Strain | Concentration (μg/plate) | Without S9 | Without S9 | With 10% Rat S9 | With 10% Rat S9 |
|---|---|---|---|---|---|
| TA98 | |||||
| 0 | 23 ± 2.0 | 24 ± 1.5 | 31 ± 2.4 | 30 ± 3.0 | |
| 1,000 | 18 ± 1.5 | 24 ± 2.3 | 24 ± 1.7 | 24 ± 2.2 | |
| 2,500 | 21 ± 1.9 | 26 ± 4.4 | 19 ± 2.7 | 23 ± 1.7 | |
| 5,000 | 21 ± 3.2 | 22 ± 4.2 | 29 ± 0.7 | 26 ± 1.5 | |
| 7,500 | 16 ± 0.6 | 23 ± 2.0 | 25 ± 6.4 | 30 ± 2.9 | |
| 10,000 | 20 ± 1.2 | 17 ± 2.6 | 17 ± 3.3 | 20 ± 3.5 | |
| Trial summary | Negative | Negative | Negative | Negative | |
| Positive controlb | 420 ± 49.6 | 592 ± 13.9 | 1,119 ± 71.3 | 1,421 ± 43.9 | |
| TA100 | |||||
| 0 | 104 ± 6.5 | 111 ± 1.3 | 115 ± 5.0 | 118 ± 1.9 | |
| 1,000 | 94 ± 1.5 | 110 ± 9.0 | 115 ± 10.4 | 128 ± 6.7 | |
| 2,500 | 95 ± 4.3 | 99 ± 4.5 | 120 ± 4.0 | 124 ± 5.7 | |
| 5,000 | 108 ± 1.8 | 110 ± 2.2 | 113 ± 12.0 | 118 ± 4.3 | |
| 7,500 | 93 ± 5.2 | 107 ± 5.5 | 112 ± 8.3 | 126 ± 11.0 | |
| 10,000 | 97 ± 10.4 | 110 ± 11.3 | 110 ± 4.8 | 127 ± 10.5 | |
| Trial summary | Negative | Negative | Negative | Negative | |
| Positive control | 445 ± 2.3 | 417 ± 15.5 | 1,347 ± 16.2 | 1,610 ± 125.3 | |
| Escherichia coli WP2 uvrA (pKM101) | |||||
| 0 | 179 ± 4.7 | 220 ± 14.5 | 225 ± 15.9 | 226 ± 6.2 | |
| 1,000 | 181 ± 2.5 | 240 ± 6.4 | 256 ± 10.4 | 257 ± 23.1 | |
| 2,500 | 209 ± 14.3 | 290 ± 19.7 | 272 ± 10.2 | 254 ± 19.2 | |
| 5,000 | 191 ± 4.4 | 237 ± 15.2 | 238 ± 14.6 | 291 ± 3.7 | |
| 7,500 | 202 ± 15.7 | 257 ± 10.5 | 241 ± 3.1 | 241 ± 24.3 | |
| 10,000 | 259 ± 16.8 | 290 ± 18.2 | 262 ± 27.0 | 258 ± 18.9 | |
| Trial summary | Negative | Negative | Negative | Negative | |
| Positive control | 827 ± 13.1 | 2,339 ± 28.2 | 1,561 ± 63.3 | 1,156 ± 2.6 | |
Table D-2. Mutagenicity of 1-Butyl-3-Methylimidazolium Chloride in Bacterial Tester Strainsa
| Strain | Concentration (μg/plate) | Without S9 | Without S9 | With 10% Rat S9 | With 10% Rat S9 |
|---|---|---|---|---|---|
| TA98 | |||||
| 0 | 22 ± 1.7 | 23 ± 2.6 | 36 ± 3.1 | 34 ± 2.4 | |
| 1,000 | 24 ± 2.9 | 25 ± 1.9 | 32 ± 3.2 | 33 ± 3.2 | |
| 2,500 | 21 ± 1.0 | 25 ± 2.4 | 28 ± 2.0 | 30 ± 1.9 | |
| 5,000 | 14 ± 2.0 | 23 ± 0.7 | 27 ± 2.7 | 25 ± 2.5 | |
| 7,500 | 19 ± 3.2 | 17 ± 2.3 | 28 ± 3.2 | 27 ± 3.2 | |
| 10,000 | 24 ± 1.9 | 15 ± 1.8 | 34 ± 1.9 | 20 ± 2.6 | |
| Trial summary | Negative | Negative | Negative | Negative | |
| Positive controlb | 669 ± 27.2 | 347 ± 36.2 | 1,393 ± 104.8 | 1,280 ± 128.9 | |
| TA100 | |||||
| 0 | 88 ± 3.5 | 104 ± 5.6 | 70 ± 6.5 | 104 ± 7.2 | |
| 1,000 | 105 ± 6.1 | 108 ± 5.5 | 70 ± 3.8 | 106 ± 5.1 | |
| 2,500 | 88 ± 7.4 | 108 ± 1.2 | 76 ± 2.6 | 113 ± 4.6 | |
| 5,000 | 102 ± 3.5 | 97 ± 4.9 | 80 ± 8.4 | 114 ± 2.2 | |
| 7,500 | 95 ± 7.5 | 90 ± 1.2 | 84 ± 4.4 | 114 ± 3.8 | |
| 10,000 | 105 ± 3.5 | 107 ± 14.2 | 81 ± 6.9 | 142 ± 18.4 | |
| Trial summary | Negative | Negative | Negative | Negative | |
| Positive control | 445 ± 32.3 | 374 ± 76.5 | 1,399 ± 55.7 | 1,682 ± 73.5 | |
| Escherichia coli WP2 uvrA (pKM101) | |||||
| 0 | 167 ± 15.4 | 189 ± 4.6 | 193 ± 6.0 | 215 ± 5.9 | |
| 1,000 | 169 ± 6.1 | 168 ± 7.8 | 198 ± 10.3 | 203 ± 7.7 | |
| 2,500 | 162 ± 5.5 | 168 ± 3.2 | 191 ± 12.0 | 216 ± 5.9 | |
| 5,000 | 137 ± 5.2 | 163 ± 3.6 | 190 ± 10.4 | 223 ± 17.6 | |
| 7,500 | 137 ± 6.7 | 166 ± 7.8 | 198 ± 5.5 | 217 ± 3.7 | |
| 10,000 | 135 ± 2.0 | 189 ± 18.4 | 218 ± 27.4 | 259 ± 22.4 | |
| Trial summary | Negative | Negative | Negative | Negative | |
| Positive control | 1,921 ± 94.3 | 1,699 ± 90.8 | 854 ± 28.5 | 837 ± 34.9 | |
Table D-3. Mutagenicity of 1-Butyl-1-Methylpyrrolidinium Chloride in Bacterial Tester Strainsa
| Strain | Concentration (μg/plate) | Without S9 | Without S9 | With 10% Rat S9 | With 10% Rat S9 |
|---|---|---|---|---|---|
| TA98 | |||||
| 0 | 27 ± 3.5 | 22 ± 1.0 | 33 ± 0.6 | 23 ± 1.5 | |
| 1,000 | 29 ± 1.3 | 22 ± 2.8 | 41 ± 6.9 | 25 ± 0.9 | |
| 2,500 | 30 ± 2.1 | 18 ± 5.7 | 28 ± 3.5 | 15 ± 0.3 | |
| 5,000 | 25 ± 2.2 | 18 ± 3.5 | 36 ± 1.7 | 20 ± 1.9 | |
| 7,500 | 26 ± 1.0 | 20 ± 3.5 | 34 ± 0.9 | 21 ± 1.5 | |
| 10,000 | 25 ± 2.8 | 18 ± 3.2 | 28 ± 4.2 | 18 ± 2.7 | |
| Trial summary | Negative | Negative | Negative | Negative | |
| Positive controlb | 528 ± 63.5 | 640 ± 30.9 | 1,447 ± 15.4 | 1,666 ± 14.0 | |
| TA100 | |||||
| 0 | 100 ± 1.2 | 81 ± 6.7 | 117 ± 3.1 | 110 ± 9.8 | |
| 1,000 | 104 ± 4.9 | 96 ± 6.4 | 117 ± 5.0 | 125 ± 4.0 | |
| 2,500 | 104 ± 3.9 | 82 ± 6.7 | 121 ± 9.0 | 134 ± 13.0 | |
| 5,000 | 96 ± 2.6 | 67 ± 5.9 | 119 ± 6.1 | 108 ± 5.6 | |
| 7,500 | 113 ± 2.0 | 90 ± 9.6 | 122 ± 5.7 | 121 ± 8.8 | |
| 10,000 | 106 ± 4.3 | 104 ± 6.3 | 145 ± 21.9 | 142 ± 21.9 | |
| Trial summary | Negative | Negative | Negative | Negative | |
| Positive control | 475 ± 10.5 | 491 ± 19.2 | 1,650 ± 25.5 | 1,054 ± 14.6 | |
| Escherichia coli WP2 uvrA (pKM101) | |||||
| 0 | 182 ± 19.1 | 155 ± 3.9 | 261 ± 9.5 | 207 ± 12.7 | |
| 1,000 | 218 ± 1.2 | 168 ± 20.5 | 267 ± 0.7 | 235 ± 9.6 | |
| 2,500 | 220 ± 1.5 | 160 ± 4.7 | 259 ± 23.3 | 236 ± 11.8 | |
| 5,000 | 168 ± 6.4 | 141 ± 7.3 | 259 ± 13.0 | 186 ± 8.2 | |
| 7,500 | 147 ± 10.3 | 151 ± 5.8 | 265 ± 16.2 | 190 ± 4.5 | |
| 10,000 | 208 ± 33.9 | 198 ± 13.4 | 271 ± 36.5 | 215 ± 7.2 | |
| Trial summary | Negative | Negative | Negative | Negative | |
| Positive control | 2,009 ± 47.5 | 2,106 ± 119.4 | 941 ± 23.7 | 873 ± 67.7 | |
Table D-4. Mutagenicity of N-Butylpyridinium Chloride in Bacterial Tester Strainsa
| Strain | Concentration (μg/plate) | Without S9 | Without S9 | With 10% Rat S9 | With 10% Rat S9 |
|---|---|---|---|---|---|
| TA98 | |||||
| 0 | 22 ± 1.7 | 20 ± 2.2 | 36 ± 3.1 | 27 ± 1.2 | |
| 1,000 | 18 ± 2.0 | 24 ± 3.1 | 30 ± 3.6 | 32 ± 1.2 | |
| 2,500 | 25 ± 1.7 | 17 ± 2.6 | 27 ± 3.8 | 28 ± 3.3 | |
| 5,000 | 17 ± 3.7 | 16 ± 0.9 | 24 ± 2.8 | 28 ± 5.8 | |
| 7,500 | 22 ± 2.3 | 12 ± 2.3 | 28 ± 2.8 | 23 ± 2.5 | |
| 10,000 | 21 ± 1.2 | 15 ± 0.9 | 33 ± 3.0 | 25 ± 1.2 | |
| Trial summary | Negative | Negative | Negative | Negative | |
| Positive controlb | 669 ± 27.2 | 347 ± 36.2 | 1,393 ± 104.8 | 1,280 ± 128.9 | |
| TA100 | |||||
| 0 | 88 ± 3.5 | 104 ± 5.6 | 70 ± 6.5 | 104 ± 7.2 | |
| 1,000 | 83 ± 7.0 | 104 ± 4.9 | 86 ± 1.5 | 99 ± 3.5 | |
| 2,500 | 105 ± 1.8 | 88 ± 7.0 | 89 ± 4.4 | 103 ± 2.6 | |
| 5,000 | 84 ± 5.4 | 98 ± 9.4 | 91 ± 1.2 | 109 ± 5.0 | |
| 7,500 | 86 ± 13.3 | 80 ± 2.2 | 95 ± 2.2 | 106 ± 0.7 | |
| 10,000 | 63 ± 9.0 | 69 ± 10.8 | 89 ± 4.2 | 153 ± 25.5 | |
| Trial summary | Negative | Negative | Negative | Negative | |
| Positive control | 445 ± 32.3 | 374 ± 76.5 | 1,399 ± 55.7 | 1,682 ± 73.5 | |
| Escherichia coli WP2 uvrA (pKM101) | |||||
| 0 | 167 ± 15.4 | 189 ± 4.6 | 193 ± 6.0 | 215 ± 5.9 | |
| 1,000 | 173 ± 5.0 | 188 ± 6.2 | 203 ± 7.4 | 222 ± 11.0 | |
| 2,500 | 156 ± 5.7 | 175 ± 5.4 | 193 ± 7.2 | 218 ± 4.4 | |
| 5,000 | 173 ± 7.2 | 159 ± 4.9 | 209 ± 9.1 | 229 ± 5.5 | |
| 7,500 | 140 ± 6.0 | 156 ± 9.8 | 215 ± 9.2 | 249 ± 16.8 | |
| 10,000 | 159 ± 13.3 | 146 ± 11.4 | 225 ± 10.7 | 259 ± 10.4 | |
| Trial summary | Negative | Negative | Negative | Negative | |
| Positive control | 1,921 ± 94.3 | 1,699 ± 90.8 | 854 ± 28.5 | 837 ± 34.9 | |
D.3. Micronucleus Assay
D.3.1. Peripheral Blood Micronucleus Test Protocol
Upon termination of the 3-month toxicity studies of each of the four ILs (Emim-Cl, Bmim-Cl, Bmpy-Cl, and NBuPy-Cl), blood samples (approximately 200 μL) were collected from male and female rats and mice, placed in ethylenediaminetetraacetic acid (EDTA)-coated tubes, and shipped overnight to the testing laboratory. Upon arrival, blood samples were fixed in ultracold methanol using a MicroFlowPLUS Kit (Litron Laboratories, Rochester, NY) according to the manufacturer’s instructions. Fixed samples were stored in a −80°C freezer until analysis. Thawed blood samples were analyzed for frequency of micronucleated immature erythrocytes (i.e., reticulocytes or polychromatic erythrocytes [PCEs]) and mature erythrocytes (i.e., normochromatic erythrocytes [NCEs]) using a flow cytometer139; both the mature and immature erythrocyte populations can be analyzed separately by employing special cell surface markers to differentiate the two cell types. Because the very young reticulocyte subpopulation (CD71+ cells) can be targeted using this technique, rat blood samples can be analyzed for damage that occurred in the bone marrow within the past 24–48 hours, before the rat spleen appreciably alters the percentage of PCEs in circulation.140 In mice, both the mature and immature erythrocyte populations can be evaluated for micronucleus frequency because the mouse spleen does not sequester and eliminate damaged erythrocytes. Damaged erythrocytes achieve steady state in the peripheral blood of mice after 4 weeks of continuous exposure. Approximately 20,000 PCEs and 1 × 10⁶ NCEs were analyzed per animal for the frequency of micronucleated cells, and the percentage of immature erythrocytes (% PCE) was calculated as a measure of bone marrow toxicity resulting from chemical exposure.
139. Witt KL, Livanos E, Kissling GE, Torous DK, Caspary W, Tice RR, Recio L. Comparison of flow cytometry- and microscopy-based methods for measuring micronucleated reticulocyte frequencies in rodents treated with nongenotoxic and genotoxic chemicals. Mutat Res. 2008; 649(1-2):101-113. DOI: 10.1016/j.mrgentox.2007.08.004 PubMed: 17869571
140. Dertinger SD, Camphausen K, MacGregor JT, Bishop ME, Torous DK, Avlasevich S, Cairns S, Tometsko CR, Menard C, Muanza T. Three‐color labeling method for flow cytometric measurement of cytogenetic damage in rodent and human blood. Environ Mol Mutagen. 2004; 44(5):427-435. DOI: 10.1002/em.20075 PubMed: 15517570
Prior experience with the large number of cells scored using flow cytometric scoring techniques141 suggests it is reasonable to assume that the proportion of micronucleated reticulocytes is approximately normally distributed. The statistical tests selected for trend and for pairwise comparisons with the control group depend on whether the variances among the groups are equal. The Levene test at α = 0.05 is used to test for equal variances. In the case of equal variances, linear regression is used to test for a linear trend with exposure concentration and the Williams test is used to test for pairwise differences between each exposed group and the control group. In the case of unequal variances, the Jonckheere test is used to test for linear trend and the Dunn test is used for pairwise comparisons of each exposed group with the control group. To correct for multiple pairwise comparisons, the p value for each comparison with the control group is multiplied by the number of comparisons made. In the event that this product is >1.00, it is replaced with 1.00. Trend tests and pairwise comparisons with the controls are considered statistically significant at p ≤ 0.025.
141. Kissling GE, Dertinger SD, Hayashi M, MacGregor JT. Sensitivity of the erythrocyte micronucleus assay: Dependence on number of cells scored and inter-animal variability. Mutat Res. 2007; 634(1-2):235-240. DOI: 10.1016/j.mrgentox.2007.07.010 PubMed: 17851117
In the micronucleus test, it is preferable to base a positive result on the presence of both a positive trend as well as at least one significantly elevated exposed group compared to the corresponding control group. In addition, historical control data are used to evaluate the biological significance of any observed response. Both statistical significance and biological significance are considered when arriving at a call. The presence of either a positive trend or a single significant exposed group generally results in an equivocal call. The absence of both a trend and any significant differences between exposed groups and the control group results in a negative call. Ultimately, the scientific staff determines the final call after considering the results of statistical analyses, reproducibility of any effects observed (in acute studies), and the magnitudes of those effects.
D.3.2. Results
The four ILs were tested for induction of structural or numerical chromosomal damage in the rodent peripheral blood erythrocyte micronucleus assay following 3 months of exposure via dosed water.
Emim-Cl did not increase the frequency of micronucleated erythrocytes in male or female rats or in male mice exposed via dosed water for 3 months (Table D-5, Table D-9). In female mice, the micronucleus assay response was judged to be negative, although a small, significant increase was observed in micronucleated NCEs; this response was downgraded because it was not considered of sufficient magnitude to be biologically relevant and was well within the laboratory historical control range for female B6C3F1 mice.
Bmim-Cl did not increase the frequency of micronucleated erythrocytes in male or female rats or mice exposed via dosed water for 3 months (Table D-6, Table D-10).
Bmpy-Cl was positive in the peripheral blood micronucleus test in male rats following 3 months of exposure via dosed water, although the observed increases in micronucleated PCEs were within the laboratory historical control 95% confidence interval. Bmpy-Cl did not induce an increase in micronucleated erythrocytes in female rats or in male or female mice (Table D-7, Table D-11).
A clearly significant increase in micronucleated NCEs was observed in male rats exposed to NBuPy-Cl for 3 months via dosed water, whereas no increase was seen in micronucleated PCEs in these same animals (Table D-8). The response was judged to be equivocal because (a) this response pattern is in direct contrast to what would be expected in rats for a truly positive compound, (b) the increases observed were within the laboratory 95% confidence interval for male rats, and (c) there is no biological explanation for the observation (such as splenic malfunction). NBuPy-Cl was negative in female rats and male and female mice in the micronucleus assay (Table D-8, Table D-12).
Occasional small increases in % PCE were observed in some of the animal groups, but none was associated with an effect on micronucleus frequencies and all were within the laboratory historical control 95% confidence interval. They do not suggest an effect on erythropoiesis.
Table D-5. Frequency of Micronuclei in Peripheral Blood Erythrocytes of Male and Female Rats in the Three-month Drinking Water Study of 1-Ethyl-3-Methylimidazolium Chloridea
| Number of Rats with Erythrocytes Scored | Micronucleated PCEs/1,000 PCEsb | P Valuec | Micronucleated NCEs/1,000 NCEsb | P Valuec | PCEs (%)b | P Valuec | |
|---|---|---|---|---|---|---|---|
| Male | |||||||
| Exposure concentration (mg/mL) | |||||||
| 0 | 5 | 0.540 ± 0.076 | 0.068 ± 0.015 | 0.850 ± 0.021 | |||
| 1 | 5 | 0.610 ± 0.080 | 0.3751 | 0.051 ± 0.013 | 0.7411 | 1.019 ± 0.039 | 0.1222 |
| 3 | 5 | 0.540 ± 0.043 | 0.4445 | 0.066 ± 0.007 | 0.8218 | 0.955 ± 0.039 | 0.1447 |
| 10 | 5 | 0.657 ± 0.092 | 0.1836 | 0.047 ± 0.006 | 0.8529 | 0.881 ± 0.061 | 0.1510 |
| Trendd | p = 0.1559 | p = 0.8595 | p = 0.4519 | ||||
| Female | |||||||
| Exposure concentration (mg/mL) | |||||||
| 0 | 5 | 0.780 ± 0.109 | 0.099 ± 0.014 | 0.811 ± 0.070 | |||
| 1 | 5 | 0.560 ± 0.120 | 0.7612 | 0.065 ± 0.018 | 0.8421 | 0.936 ± 0.079 | 0.3839 |
| 3 | 5 | 0.670 ± 0.066 | 0.8393 | 0.082 ± 0.008 | 0.9050 | 1.030 ± 0.136 | 0.2406 |
| 10 | 5 | 0.630 ± 0.157 | 0.8682 | 0.076 ± 0.008 | 0.9268 | 1.160 ± 0.125 | 0.0546 |
| Trend | p = 0.6555 | p = 0.6985 | p = 0.0494 | ||||
Table D-6. Frequency of Micronuclei in Peripheral Blood Erythrocytes of Male and Female Rats in the Three-month Drinking Water Study of 1-Butyl-3-Methylimidazolium Chloridea
| Number of Rats with Erythrocytes Scored | Micronucleated PCEs/1,000 PCEsb | P Valuec | Micronucleated NCEs/1,000 NCEsb | P Valuec | PCEs (%)b | P Valuec | |
|---|---|---|---|---|---|---|---|
| Male | |||||||
| Exposure concentration (mg/mL) | |||||||
| 0 | 5 | 0.420 ± 0.082 | 0.175 ± 0.037 | 0.892 ± 0.031 | |||
| 0.1 | 5 | 0.400 ± 0.085 | 0.5367 | 0.137 ± 0.008 | 1.0000 | 0.835 ± 0.013 | 0.6568 |
| 0.3 | 5 | 0.440 ± 0.087 | 0.5311 | 0.191 ± 0.037 | 0.9457 | 0.948 ± 0.024 | 0.9295 |
| 1 | 5 | 0.430 ± 0.073 | 0.5627 | 0.089 ± 0.015 | 1.0000 | 1.053 ± 0.045 | 0.1267 |
| Trendd | p = 0.4322 | p = 0.9468 | p = 0.0058 | ||||
| Female | |||||||
| Exposure concentration (mg/mL) | |||||||
| 0 | 5 | 0.660 ± 0.071 | 0.105 ± 0.027 | 0.829 ± 0.043 | |||
| 0.1 | 5 | 0.550 ± 0.074 | 0.8557 | 0.074 ± 0.009 | 0.6790 | 0.806 ± 0.100 | 1.0000 |
| 0.3 | 5 | 0.410 ± 0.010 | 0.9157 | 0.099 ± 0.020 | 0.6686 | 1.114 ± 0.062 | 0.0226 |
| 1 | 5 | 0.580 ± 0.116 | 0.8697 | 0.116 ± 0.032 | 0.4791 | 1.048 ± 0.053 | 0.0975 |
| Trend | p = 0.5711 | p = 0.2058 | p = 0.0087 | ||||
Table D-7. Frequency of Micronuclei in Peripheral Blood Erythrocytes of Male and Female Rats in the Three-month Drinking Water Study of 1-Butyl-1-Methylpyrrolidinium Chloridea
| Number of Rats with Erythrocytes Scored | Micronucleated PCEs/1,000 PCEsb | P Valuec | Micronucleated NCEs/1,000 NCEsb | P Valuec | PCEs (%)b | P Valuec | |
|---|---|---|---|---|---|---|---|
| Male | |||||||
| Exposure concentration (mg/mL) | |||||||
| 0 | 5 | 0.440 ± 0.062 | 0.037 ± 0.005 | 0.984 ± 0.038 | |||
| 0.3 | 5 | 0.810 ± 0.102 | 0.0023 | 0.018 ± 0.003 | 0.9602 | 0.867 ± 0.020 | 0.6756 |
| 1 | 5 | 0.890 ± 0.099 | <0.001 | 0.016 ± 0.003 | 0.9838 | 1.024 ± 0.071 | 0.7961 |
| 3 | 5 | 1.000 ± 0.035 | <0.001 | 0.022 ± 0.008 | 0.9893 | 0.985 ± 0.062 | 0.8386 |
| Trendd | p = 0.0020 | p = 0.8110 | p = 0.5253 | ||||
| Female | |||||||
| Exposure concentration (mg/mL) | |||||||
| 0 | 5 | 0.580 ± 0.064 | 0.048 ± 0.016 | 0.917 ± 0.103 | |||
| 1 | 5 | 0.280 ± 0.051 | 0.9643 | 0.037 ± 0.005 | 0.6221 | 1.061 ± 0.183 | 0.7850 |
| 3 | 5 | 0.430 ± 0.046 | 0.9857 | 0.077 ± 0.020 | 0.3393 | 1.121 ± 0.087 | 0.3264 |
| 6 | 5 | 0.380 ± 0.072 | 0.9908 | 0.043 ± 0.007 | 0.3618 | 1.019 ± 0.064 | 1.0000 |
| Trend | p = 0.7863 | p = 0.5396 | p = 0.5010 | ||||
Table D-8. Frequency of Micronuclei in Peripheral Blood Erythrocytes of Male and Female Rats in the Three-month Drinking Water Study of N-Butylpyridinium Chloridea
| Number of Rats with Erythrocytes Scored | Micronucleated PCEs/1,000 PCEsb | P Valuec | Micronucleated NCEs/1,000 NCEsb | P Valuec | PCEs (%)b | P Valuec | |
|---|---|---|---|---|---|---|---|
| Male | |||||||
| Exposure concentration (mg/mL) | |||||||
| 0 | 5 | 0.740 ± 0.094 | 0.049 ± 0.005 | 0.891 ± 0.033 | |||
| 0.3 | 5 | 0.590 ± 0.053 | 0.7173 | 0.063 ± 0.014 | 0.6340 | 0.938 ± 0.078 | 0.7054 |
| 1 | 5 | 0.900 ± 0.097 | 0.4202 | 0.212 ± 0.043 | 0.0029 | 0.905 ± 0.024 | 0.8261 |
| 3 | 5 | 0.680 ± 0.109 | 0.4480 | 0.141 ± 0.024 | 0.0242 | 0.914 ± 0.037 | 0.8682 |
| Trendd | p = 0.5187 | p = 0.0019 | p = 0.8940 | ||||
| Female | |||||||
| Exposure concentration (mg/mL) | |||||||
| 0 | 5 | 0.690 ± 0.099 | 0.054 ± 0.016 | 0.931 ± 0.105 | |||
| 0.3 | 5 | 1.094 ± 0.171 | 0.2413 | 0.197 ± 0.109 | 0.2991 | 1.000 ± 0.070 | 0.6851 |
| 1 | 5 | 0.730 ± 0.106 | 0.2907 | 0.066 ± 0.016 | 1.0000 | 0.948 ± 0.109 | 0.8053 |
| 3 | 5 | 0.600 ± 0.057 | 0.3093 | 0.030 ± 0.006 | 1.0000 | 1.328 ± 0.093 | 0.0150 |
| Trend | p = 0.9356 | p = 0.9306 | p = 0.0080 | ||||
Table D-9. Frequency of Micronuclei in Peripheral Blood Erythrocytes of Male and Female Mice in the Three-month Drinking Water Study of 1-Ethyl-3-Methylimidazolium Chloridea
| Number of Rats with Erythrocytes Scored | Micronucleated PCEs/1,000 PCEsb | P Valuec | Micronucleated NCEs/1,000 NCEsb | P Valuec | PCEs (%)b | P Valuec | |
|---|---|---|---|---|---|---|---|
| Male | |||||||
| Exposure concentration (mg/mL) | |||||||
| 0 | 5 | 3.110 ± 0.245 | 1.653 ± 0.032 | 1.145 ± 0.088 | |||
| 3 | 5 | 3.120 ± 0.248 | 0.5978 | 1.663 ± 0.042 | 0.4547 | 1.064 ± 0.057 | 1.0000 |
| 10 | 5 | 3.320 ± 0.312 | 0.6854 | 1.766 ± 0.076 | 0.2848 | 1.266 ± 0.079 | 0.2610 |
| 30 | 5 | 2.560 ± 0.076 | 0.7213 | 1.656 ± 0.060 | 0.3025 | 1.387 ± 0.016 | 0.0285 |
| Trendd | p = 0.9672 | p = 0.5300 | p = 0.0049 | ||||
| Female | |||||||
| Exposure concentration (mg/mL) | |||||||
| 0 | 5 | 1.520 ± 0.179 | 0.924 ± 0.032 | 1.066 ± 0.228 | |||
| 3 | 5 | 1.720 ± 0.131 | 0.1868 | 0.967 ± 0.013 | 0.1077 | 1.352 ± 0.181 | 1.0000 |
| 10 | 5 | 1.850 ± 0.161 | 0.1331 | 1.027 ± 0.021 | 0.0039 | 1.533 ± 0.087 | 0.2615 |
| 30 | 5 | 1.750 ± 0.143 | 0.1405 | 1.053 ± 0.023 | <0.001 | 1.424 ± 0.118 | 0.8551 |
| Trend | p = 0.2376 | p = 0.0011 | p = 0.2258 | ||||
Table D-10. Frequency of Micronuclei in Peripheral Blood Erythrocytes of Male and Female Mice in the Three-month Drinking Water Study of 1-Butyl-3-Methylimidazolium Chloridea
| Number of Rats with Erythrocytes Scored | Micronucleated PCEs/1,000 PCEsb | P Valuec | Micronucleated NCEs/1,000 NCEsb | P Valuec | PCEs (%)b | P Valuec | |
|---|---|---|---|---|---|---|---|
| Male | |||||||
| Exposure concentration (mg/mL) | |||||||
| 0 | 5 | 3.890 ± 0.375 | 1.736 ± 0.080 | 1.211 ± 0.030 | |||
| 0.3 | 5 | 3.170 ± 0.135 | 0.9053 | 1.617 ± 0.054 | 0.8356 | 1.251 ± 0.032 | 1.0000 |
| 1 | 5 | 3.020 ± 0.225 | 0.9515 | 1.593 ± 0.047 | 0.9001 | 1.150 ± 0.021 | 0.6568 |
| 3 | 5 | 3.560 ± 0.296 | 0.8969 | 1.659 ± 0.061 | 0.9018 | 1.215 ± 0.057 | 1.0000 |
| Trendd | p = 0.5067 | p = 0.6191 | p = 0.5448 | ||||
| Female | |||||||
| Exposure concentration (mg/mL) | |||||||
| 0 | 5 | 2.590 ± 0.288 | 1.133 ± 0.041 | 1.495 ± 0.426 | |||
| 0.3 | 5 | 3.680 ± 0.476 | 0.1105 | 1.177 ± 0.018 | 0.5453 | 1.490 ± 0.263 | 1.0000 |
| 1 | 5 | 2.970 ± 0.363 | 0.1343 | 1.152 ± 0.014 | 1.0000 | 1.085 ± 0.162 | 0.8403 |
| 3 | 5 | 3.030 ± 0.241 | 0.1420 | 1.167 ± 0.057 | 1.0000 | 1.365 ± 0.134 | 0.8810 |
| Trend | p = 0.5116 | p = 0.6317 | p = 0.9722 | ||||
Table D-11. Frequency of Micronuclei in Peripheral Blood Erythrocytes of Male and Female Mice in the Three-month Drinking Water Study of 1-Butyl-1-Methylpyrrolidinium Chloridea
| Number of Rats with Erythrocytes Scored | Micronucleated PCEs/1,000 PCEsb | P Valuec | Micronucleated NCEs/1,000 NCEsb | P Valuec | PCEs (%)b | P Valuec | |
|---|---|---|---|---|---|---|---|
| Male | |||||||
| Exposure concentration (mg/mL) | |||||||
| 0 | 5 | 3.180 ± 0.255 | 1.573 ± 0.053 | 1.409 ± 0.060 | |||
| 1 | 5 | 2.900 ± 0.299 | 0.7707 | 1.524 ± 0.040 | 0.6877 | 1.533 ± 0.032 | 0.2376 |
| 3 | 5 | 3.000 ± 0.267 | 0.8476 | 1.527 ± 0.037 | 0.7739 | 1.531 ± 0.066 | 0.2855 |
| 10 | 5 | 2.580 ± 0.147 | 0.8752 | 1.607 ± 0.048 | 0.3880 | 1.427 ± 0.045 | 0.3022 |
| Trendd | p = 0.9380 | p = 0.2116 | p = 0.8299 | ||||
| Female | |||||||
| Exposure concentration (mg/mL) | |||||||
| 0 | 5 | 2.600 ± 0.287 | 1.080 ± 0.034 | 1.312 ± 0.240 | |||
| 1 | 5 | 1.861 ± 0.082 | 0.9663 | 1.057 ± 0.016 | 0.7957 | 1.105 ± 0.100 | 0.8426 |
| 3 | 5 | 1.790 ± 0.189 | 0.9866 | 0.990 ± 0.038 | 0.8687 | 1.193 ± 0.075 | 0.9445 |
| 6 | 5 | 2.380 ± 0.112 | 0.8929 | 1.027 ± 0.044 | 0.8941 | 1.365 ± 0.093 | 0.7231 |
| Trend | p = 0.5239 | p = 0.8812 | p = 0.3302 | ||||
Table D-12. Frequency of Micronuclei in Peripheral Blood Erythrocytes of Male and Female Mice in the Three-month Drinking Water Study of N-Butylpyridinium Chloridea
| Number of Rats with Erythrocytes Scored | Micronucleated PCEs/1,000 PCEsb | P Valuec | Micronucleated NCEs/1,000 NCEsb | P Valuec | PCEs (%)b | P Valuec | |
|---|---|---|---|---|---|---|---|
| Male | |||||||
| Exposure concentration (mg/mL) | |||||||
| 0 | 5 | 4.240 ± 0.493 | 1.586 ± 0.042 | 1.250 ± 0.049 | |||
| 1 | 5 | 4.380 ± 0.228 | 0.5725 | 1.741 ± 0.072 | 0.0763 | 1.137 ± 0.052 | 0.3546 |
| 3 | 5 | 4.220 ± 0.269 | 0.6602 | 1.669 ± 0.033 | 0.0918 | 1.157 ± 0.072 | 0.4291 |
| 6 | 5 | 3.770 ± 0.311 | 0.6964 | 1.757 ± 0.067 | 0.0292 | 1.191 ± 0.101 | 0.4565 |
| Trendd | p = 0.8866 | p = 0.0722 | p = 0.6975 | ||||
| Female | |||||||
| Exposure concentration (mg/mL) | |||||||
| 0 | 5 | 2.380 ± 0.352 | 1.009 ± 0.020 | 1.381 ± 0.194 | |||
| 1 | 5 | 3.009 ± 0.370 | 0.2360 | 1.038 ± 0.022 | 0.2999 | 1.004 ± 0.098 | 0.3159 |
| 3 | 5 | 2.717 ± 0.272 | 0.2850 | 1.032 ± 0.051 | 0.3595 | 0.993 ± 0.135 | 0.3804 |
| 6 | 5 | 2.510 ± 0.390 | 0.3028 | 1.092 ± 0.032 | 0.0612 | 1.424 ± 0.048 | 0.4062 |
| Trend | p = 0.5786 | p = 0.0468 | p = 0.4197 | ||||
Appendix E. Supplemental Data
Tables with supplemental data can be found here: https://doi.org/10.22427/NTP-DATA-TOX-103
About This Report
Foreword
The National Toxicology Program (NTP), established in 1978, is an interagency program within the Public Health Service of the U.S. Department of Health and Human Services. Its activities are executed through a partnership of the National Institute for Occupational Safety and Health (part of the Centers for Disease Control and Prevention), the Food and Drug Administration (primarily at the National Center for Toxicological Research), and the National Institute of Environmental Health Sciences (part of the National Institutes of Health), where the program is administratively located. NTP offers a unique venue for the testing, research, and analysis of agents of concern to identify toxic and biological effects, provide information that strengthens the science base, and inform decisions by health regulatory and research agencies to safeguard public health. NTP also works to develop and apply new and improved methods and approaches that advance toxicology and better assess health effects from environmental exposures.
The Toxicity Report series began in 1991. The studies described in the NTP Toxicity Report series are designed and conducted to characterize and evaluate the toxicological potential of selected substances in laboratory animals (usually two species, rats and mice). Substances (e.g., chemicals, physical agents, and mixtures) selected for NTP toxicity studies are chosen primarily on the basis of human exposure, level of commercial production, and chemical structure. The interpretive conclusions presented in the toxicity reports are derived solely from the results of these NTP studies, and extrapolation of these results to other species, including characterization of hazards and risks to humans, requires analyses beyond the intent of these reports. Selection for study per se is not an indicator of a substance’s toxic potential.
NTP conducts its studies in compliance with its laboratory health and safety guidelines and Food and Drug Administration Good Laboratory Practice Regulations and meets or exceeds all applicable federal, state, and local health and safety regulations. Animal care and use are in accordance with the Public Health Service Policy on Humane Care and Use of Laboratory Animals. Studies are subjected to retrospective quality assurance audits before they are presented for public review. Draft reports undergo external peer review before they are finalized and published.
The NTP toxicity reports are available free of charge on the NTP website and cataloged in PubMed, a free resource developed and maintained by the National Library of Medicine (part of the National Institutes of Health). Data for these studies are included in NTP’s Chemical Effects in Biological Systems database.
For questions about the reports and studies, please email NTP or call 984-287-3211.
Collaborators
Division of the National Toxicology Program, National Institute of Environmental Health Sciences, Research Triangle Park, North Carolina, USA
Designed studies, evaluated and interpreted results, and reported findings
R.A. Dee, Ph.D., Co-Study Scientist
K.R. Ryan, Ph.D., Co-Study Scientist
S.A. Elmore, D.V.M., M.S., Study Pathologist
C.R. Blystone, Ph.D.
M.F. Cesta, D.V.M., Ph.D.
M.C. Cora, D.V.M.
H.C. Cunny, Ph.D.
R.P. Frawley, M.S.
D.R. Germolec, Ph.D.
M.J. Hooth, Ph.D.
A.P. King-Herbert, D.V.M.
D.E. Malarkey, D.V.M., Ph.D. (Retired)
B.S. McIntyre, Ph.D.
E. Mutlu, Ph.D.
G.K. Roberts, Ph.D.
K.A. Shipkowski, Ph.D.
K.R. Shockley, Ph.D.
M.D. Stout, Ph.D.
G.S. Travlos, D.V.M.
S. Waidyanatha, Ph.D.
N.J. Walker, Ph.D.
K.L. Witt, M.S.
Provided oversight for data management
J.M. Fostel, Ph.D.
Battelle, Columbus, Ohio, USA
Conducted 3-month studies and evaluated pathology findings
M.R. Hejtmancik, Ph.D., Principal Investigator
B.R. Sparrow, Ph.D., Principal Investigator
T.P. Arndt, Ph.D.
M.A. Buccellato, D.V.M., Ph.D.
P.S. Coder, Ph.D.
C.A. Granville, Ph.D.
S.J. Harbo, D.V.M.
K.A.B. Knostman, D.V.M., Ph.D.
E. Mylchreest, Ph.D.
K.M. Patton, D.V.M., Ph.D.
M.J. Ryan, D.V.M., Ph.D.
A.J. Skowronek, D.V.M., Ph.D.
A.M. Zmarowski, Ph.D.
Conducted prestart chemistry activities and dose formulations
B.L. Burback, Ph.D.
P.S. Clemons, Ph.D.
D.A. Contos, M.S.
S.W. Graves, B.S.
J.S. Richey, M.S.
N.L. South, B.S.
BioReliance Corporation, Rockville, Maryland, USA
Conducted 2-week studies
M.L. Wenk, Ph.D., Principal Investigator
R.H. Elbekai, Ph.D.
M. Paranjpe, D.V.M., Ph.D.
S.A. Shah, Ph.D.
MRIGlobal, Kansas City, Missouri, USA
Conducted preliminary chemistry activities
J.W. Algaier, Ph.D., Principal Investigator
A.P. Clark, B.S.E., Co-Principal Investigator
K.L. Aillon, Ph.D.
B. Astroff, Ph.D.
J. Cookinham, B.S.
A. Kazerooni, M.S.
A.J. Mainey, B.S.
D. Messer, Ph.D.
B. O’Brien, M.S.
M. Roth, B.S.
K.E. Schnare, B.S.
L. Siemann, B.S.
Experimental Pathology Laboratories, Inc., Research Triangle Park, North Carolina, USA
Provided pathology review
K.Y. Cimon, D.V.M.
Coordinated NTP Pathology Working Group on 3-month mice (July 30, 2019)
K.Y. Cimon, D.V.M.
ICF, Fairfax, Virginia, USA
Contributed to technical writing and data integration and ensured report quality
K.E. Setty, Ph.D.
Contributors
Division of the National Toxicology Program, National Institute of Environmental Health Sciences, Research Triangle Park, North Carolina, USA
Provided oversight of external peer review
S.L. Scruggs, Ph.D.
M.S. Wolfe, Ph.D.
Kelly Government Services, Research Triangle Park, North Carolina, USA
Supported external peer review
E.A. Maull, Ph.D. (retired from NIEHS, Research Triangle Park, North Carolina, USA)
Experimental Pathology Laboratories, Inc., Research Triangle Park, North Carolina, USA
Supervised pathology review
G.A. Willson, B.V.M.S., Principal Investigator
NTP Pathology Working Group, National Institute of Environmental Health Sciences, Research Triangle Park, North Carolina, USA
Participated in NTP Pathology Working Group on 3-month mice (July 30, 2019)
R. Adler, D.V.M., Ph.D., GlaxoSmithKline
A.E. Brix, D.V.M., Ph.D., Experimental Pathology Laboratories, Inc.
M.F. Cesta, D.V.M., Ph.D., National Institute of Environmental Health Sciences
S.A. Elmore, D.V.M., M.S., National Institute of Environmental Health Sciences
G. Krane, D.V.M., National Institute of Environmental Health Sciences
C.J. Willson, D.V.M., Ph.D., Integrated Laboratory Systems, LLC
Integrated Laboratory Systems, LLC, Research Triangle Park, North Carolina, USA
Conducted micronucleus and bacterial mutagenicity assays
L. Recio, Ph.D., Principal Investigator
C.A. Hobbs, Ph.D.
C.D. Swartz, D.V.M., Ph.D.
CSS Corporation, Research Triangle Park, North Carolina, USA
Prepared quality assessment audits
S. Brecher, Ph.D., Principal Investigator
S. Iyer, B.S.
V.S. Tharakan, D.V.M.
Social & Scientific Systems, a DLH Company, Research Triangle Park, North Carolina, USA
Provided statistical analyses
S.J. McBride, Ph.D., Principal Investigator
L.J. Betz, M.S.
S.F. Harris, M.S.
G. Larson, Ph.D.
ASRC Federal, Research Triangle Park, North Carolina, USA
Prepared data for report
J. Berke, B.S.
P. Brown, B.S.
H. Gong, M.S.
C. Martini, B.S.
C. Myers, M.S.
N. Sayers, B.S.
ICF, Fairfax, Virginia, USA
Provided contract oversight
D. Burch, M.E.M., Principal Investigator
J.A. Wignall, M.S.P.H.
Prepared and edited report
K.A. Addo, Ph.D.
S.K. Colley, M.S.P.H.
K.S. Duke, Ph.D.
S.R. Gunnels, M.A.
T. Hamilton, M.S.
R.C. McGill, B.S.
K.L. McKinley, M.E.M.
M.E. McVey, Ph.D.
K. O’Donovan, B.A.
J.I. Powers, M.A.P.
L.M. Prince, Ph.D.
J.R. Rochester, Ph.D.
S.J. Snow, Ph.D.
Supported external peer review
M.C. Rooney, B.A.
S.K. Whately, B.A.
Peer Review
The National Toxicology Program (NTP) conducted a peer review of the draft NTP Technical Report on the Toxicity Studies of Select Ionic Liquids (1-Ethyl-3-Methylimidazolium Chloride, 1-Butyl-3-Methylimidazolium Chloride, 1-Butyl-1-Methylpyrrolidinium Chloride, and N-Butylpyridinium Chloride) Administered in Drinking Water to Sprague Dawley (Hsd:Sprague Dawley SD) Rats and B6C3F1/N Mice by letter in October 2021 by the experts listed below. Reviewer selection and document review followed established NTP practices. The reviewers were charged to:
Peer review the draft NTP Technical Report on the Toxicity Studies of Select Ionic Liquids (1-Ethyl-3-Methylimidazolium Chloride, 1-Butyl-3-Methylimidazolium Chloride, 1-Butyl-1-Methylpyrrolidinium Chloride, and N-Butylpyridinium Chloride).
Comment on NTP’s interpretations of the data.
NTP carefully considered reviewer comments in finalizing this report.
Peer Reviewers
Sarah Blossom, Ph.D.
Professor of Pharmacology, Department of Pharmaceutical Sciences
The University of New Mexico, College of Pharmacy
Albuquerque, New Mexico, USA
Lawrence Lash, Ph.D.
Professor and Associate Department Chair, Department of Pharmacology
Wayne State University, School of Medicine
Detroit, Michigan, USA
Publication Details
Publisher: National Toxicology Program
Publishing Location: Research Triangle Park, NC
ISSN: 2378-8992
DOI: https://doi.org/10.22427/NTP-TOX-103
Report Series: NTP Toxicity Report Series
Report Series Number: 103
Official citation: National Toxicology Program (NTP). 2022. NTP technical report on the toxicity studies of select ionic liquids (1-ethyl-3-methylimidazolium chloride, 1-butyl-3-methylimidazolium chloride, 1-butyl-1-methylpyrrolidinium chloride, and n-butylpyridinium chloride) administered in drinking water to Sprague Dawley (Hsd:Sprague Dawley SD) rats and B6C3F1/N mice. Research Triangle Park, NC: National Toxicology Program. Toxicity Report 103.
Acknowledgments
This work was supported by the Intramural Research Program (ES103316, ES103318, and ES103319) at the National Institute of Environmental Health Sciences, National Institutes of Health and performed for the National Toxicology Program, Public Health Service, U.S. Department of Health and Human Services under contracts HHSN271201800012I, HHSN273201800006C, HHSN273201600011C, GS00Q14OADU417 (Order No. HHSN273201600015U), HHSN273201600020C, HHSN273201500006C, HHSN273201500014C, HHSN273201400001C, HHSN273201400015C, HHSN273201400020C, HHSN273201300009C, HHSN316201200054W, HHSN273201100001C, N01-ES-45517, N01-ES-55536, N01-ES-55552, and N01-ES-75408.
Overview
Ionic liquids (ILs) are synthetic solvents composed of organic cations and organic or inorganic anions. Because the cations can have numerous alkyl chain substitutions, the number of potential IL combinations is estimated to exceed 10 trillion.1 Chemicals from this class have replaced volatile organic compounds (VOCs) in the pharmaceutical, chemical, and energy industries, among others, because they are potentially less toxic and more environmentally friendly than VOCs.2,3
1. Baker GA, Baker SN, Pandey S, Bright FV. An analytical view of ionic liquids. Analyst. 2005; 130(6):800-808. DOI: 10.1039/b500865b PubMed: 15912225
2. Rogers RD, Seddon KR. Chemistry. Ionic liquids—solvents of the future? Science. 2003; 302(5646):792-793. DOI: 10.1126/science.1090313 PubMed: 14593156
3. Miskiewicz A, Ceranowicz P, Szymczak M, Bartuś K, Kowalczyk P. The use of liquids ionic fluids as pharmaceutically active substances helpful in combating nosocomial infections induced by Klebsiella Pneumoniae New Delhi strain, Acinetobacter Baumannii and Enterococcus species. Int J Mol Sci. 2018; 19(9). DOI: 10.3390/ijms19092779 PubMed: 30223584
Although research has shown that some ILs are ecotoxic,4 few studies characterize the toxicity of these compounds in humans. In a recent metanalysis of ionic liquid literature and toxicology, in vivo mammalian toxicity studies constituted only 8% of all tests conducted with these compounds.5 Four ionic liquids—1-ethyl-3-methylimidazolium chloride (Emim-Cl), 1-butyl-3-methylimidazolium chloride (Bmim-Cl), 1-butyl-1-methylpyrrolidinium chloride (Bmpy-Cl), and n-butylpyridinium chloride (NBuPy-Cl)—were nominated to the National Toxicology Program (NTP) for testing due to widespread interest in using them as solvent alternatives to VOCs. These four compounds were recommended for toxicity testing because, at the time of nomination, they represented the three most common cation classes (i.e., imidazolium, pyridinium, and pyrrolidinium) used in various industrial applications. In addition to investigating whether one cation is more toxic than another, two imidazolium compounds with different chain lengths (2-carbon Emim-Cl and 4-carbon Bmim-Cl) were nominated to determine whether alkyl chain length can contribute significantly to toxicity.
4. Pham TP, Cho C-W, Yun Y-S. Environmental fate and toxicity of ionic liquids: A review. Water Res. 2010; 44(2):352-372. DOI: 10.1016/j.watres.2009.09.030 PubMed: 19854462
5. Heckenbach ME, Romero FN, Green MD, Halden RU. Meta-analysis of ionic liquid literature and toxicology. Chemosphere. 2016; 150:266-274. DOI: 10.1016/j.chemosphere.2016.02.029 PubMed: 26907595
The structure of an IL determines its stability, bioavailability, and potential toxicity. Thus, NTP aimed to determine the general and relative toxicity of members of this chemical class and to test the hypothesis that specific structural variations (e.g., alkyl chain length) alter relative toxicity. Because of the potential for human exposure, NTP designed a series of studies to investigate effects of these four ILs on skin sensitization, genotoxicity, and short-term and subchronic toxicity and to learn more about their absorption, distribution, metabolism, and excretion. This toxicity report presents results from the 2-week (short-term) and 3-month (subchronic) studies of adult male and female rats and mice following IL exposure via drinking water.