Note on Accessibility: Persons using mobile devices may find some tables are not fully accessible. Note that you can view tables on a larger screen or in the PDF version of the report/monograph. If you need additional assistance, email us or use our contact form and identify the tables for which access is required. We will assist you in accessing the content. NIH has helpful information on accessibility.
Toxicity Report 108
NTP Technical Report on the Toxicity Studies of Select Phenolic Benzotriazoles Administered by Gavage to Male Sprague Dawley (Hsd:Sprague Dawley SD) Rats
Abstract
Phenolic benzotriazoles are a class of chemical additives used to stabilize industrial and consumer products against ultraviolet (UV) degradation. Although limited toxicological information is known about many of the chemicals in this class, there is potential for widespread exposure to phenolic benzotriazoles because of high production volumes and a range of uses. Therefore, the objective of these studies was to evaluate and compare the general toxicity of a selection of phenolic benzotriazoles. Nine phenolic benzotriazoles were selected for testing based on procurement availability and high production volumes and were sorted by the number of substitutions they contained from the base unsubstituted compound:
Unsubstituted
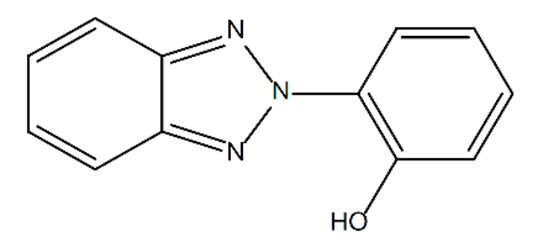
2-(2H-benzotriazol-2-yl)phenol (P-BZT)
Monosubstituted
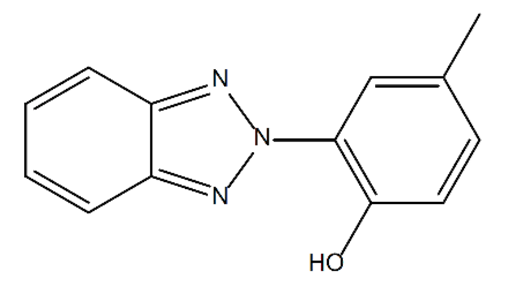
2-(2H-benzotriazol-2-yl)-4-methylphenol; UV-P (drometrizole)
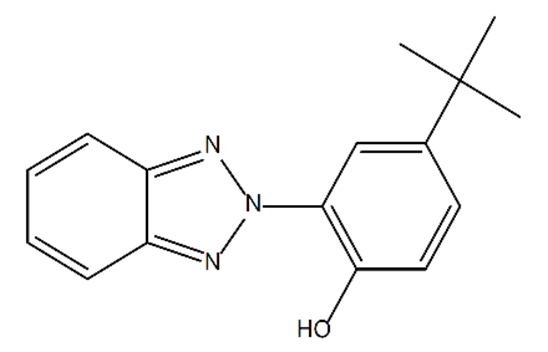
2-(2H-benzotriazol-2-yl)-4-tert-butylphenol; UV-PS (tBu-BZT)
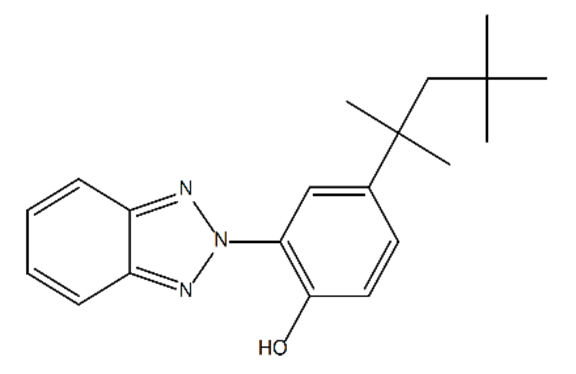
2-(2H-benzotriazol-2-yl)-4-(1,1,3,3-tetramethylbutyl)phenol; UV-329 (octrizole)
Disubstituted
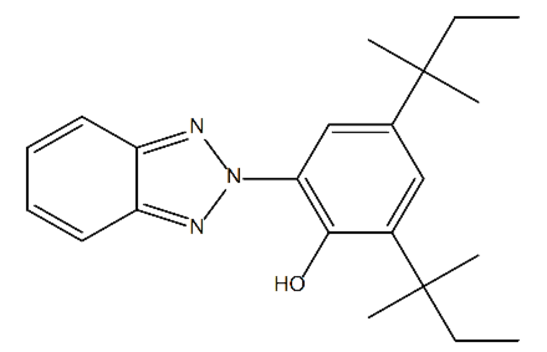
2-(2H-benzotriazol-2-yl)-4,6-bis(1,1-dimethylpropyl)phenol; UV-328 (ditPe-BZT)
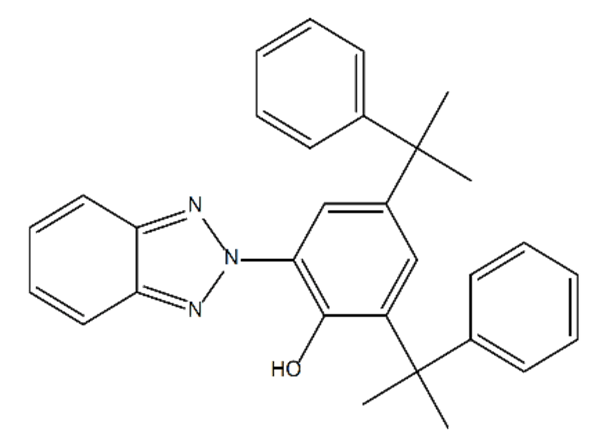
2-(2H-benzotriazol-2-yl)-4,6-bis(1-methyl-1-phenylethyl)phenol; UV-234 (diMeEtPh-BZT)
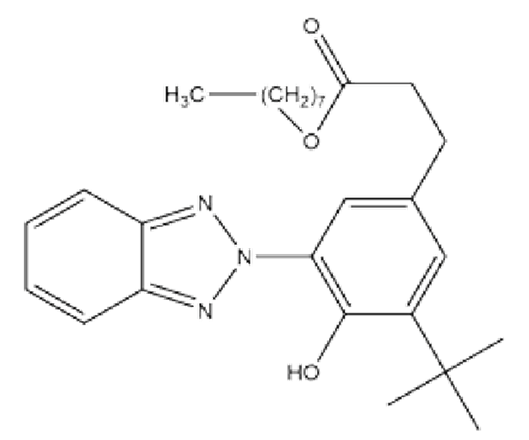
3-(2H-benzotriazol-2-yl)-5-(1,1-dimethylethyl)-4-hydroxybenzenepropanoic acid, octyl ester; UV-384 (tBuPrOcEst-BZT)
Trisubstituted
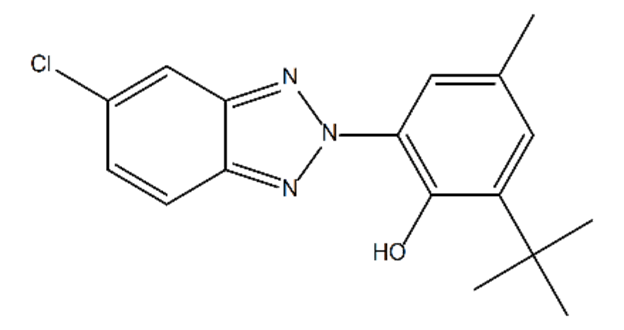
2-(5-chloro-2H-1,2,3-benzotriazol-2-yl)-6-(1,1-dimethylethyl)-4-methylphenol; UV-326 (bumetrizole)
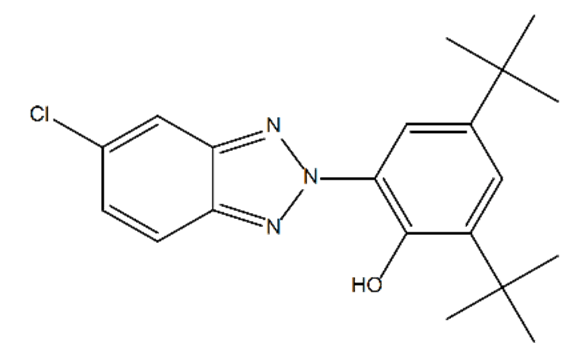
2-(5-chloro-2H-benzotriazol-2-yl)-4,6-bis(1,1-dimethylethyl)phenol; UV-327 (ditBuCl-BZT)
Five male Hsd:Sprague Dawley SD (Sprague Dawley) rats per group were dosed daily via gavage for 2 weeks at doses of 0, 30, 100, 300, or 1,000 mg/kg body weight/day (mg/kg/day) for each test article or vehicle control (0.5% aqueous methylcellulose). Toxicity was assessed through clinical observations, body and organ weights, clinical chemistry, hematology, targeted gene expression in the liver and kidney, histopathological evaluation, and genetic toxicity.
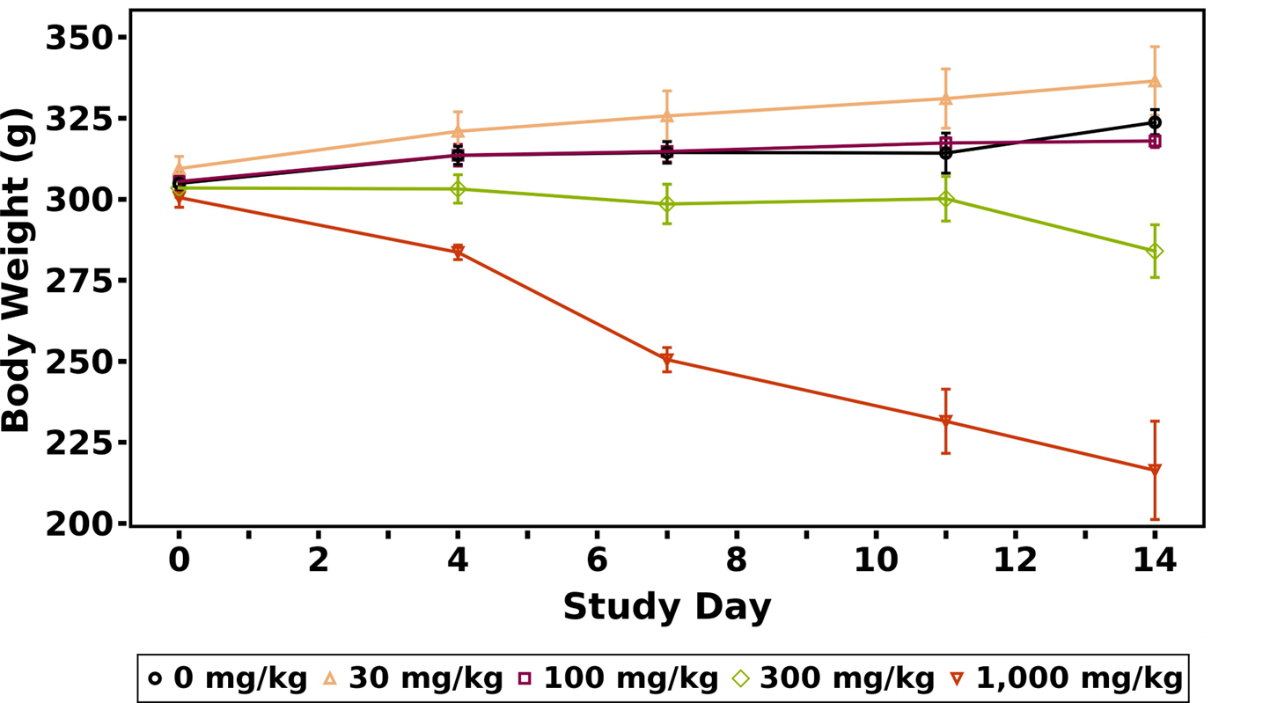
There were no dose-related effects on survival for any of the nine phenolic benzotriazoles. Clinical observations of red nasal discharge were reported in at least one dose group for each of the nine chemicals. For all chemicals except tBuPrOcEst-BZT, a disubstituted phenolic benzotriazole, the body weights of dosed animals were unchanged. Body weights of rats administered ≥300 mg/kg/day tBuPrOcEst-BZT were significantly decreased. Rats administered 1,000 mg/kg/day ditPe-BZT gained significantly less weight than control rats during the study period.
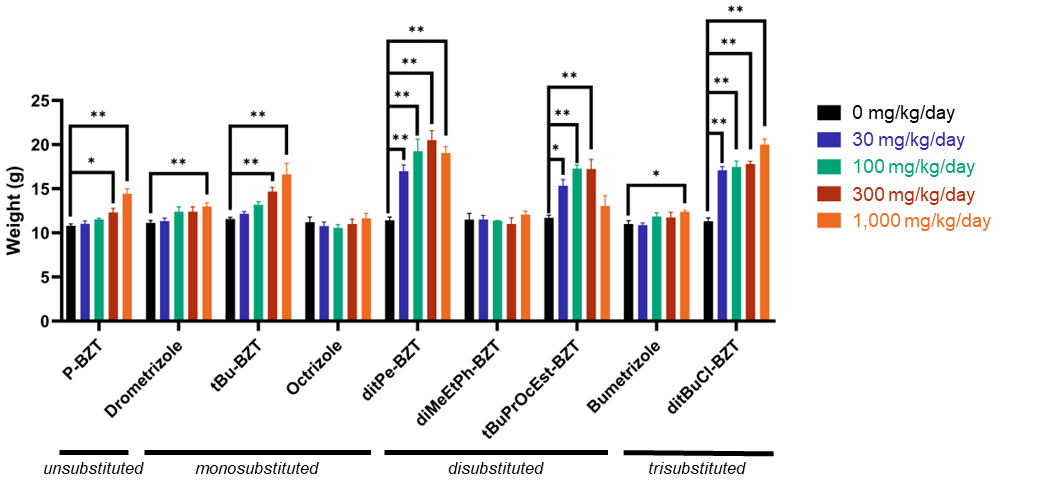
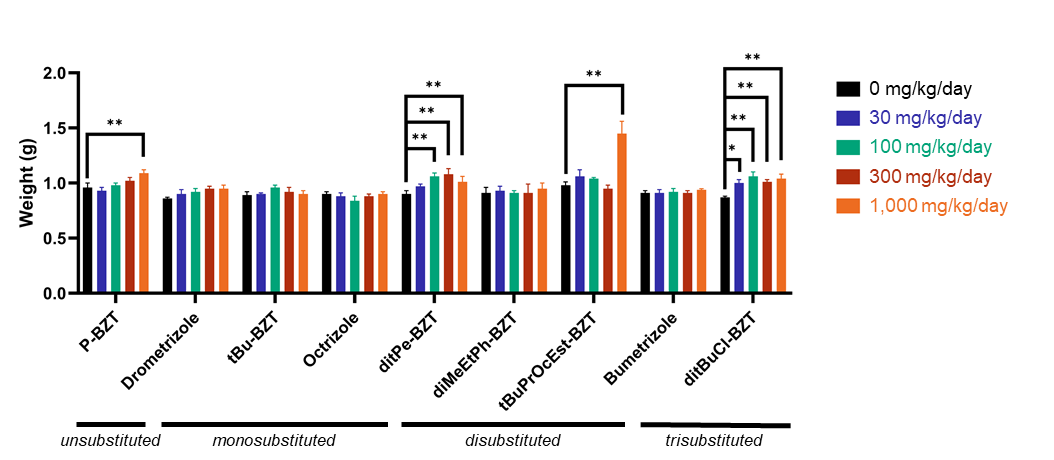
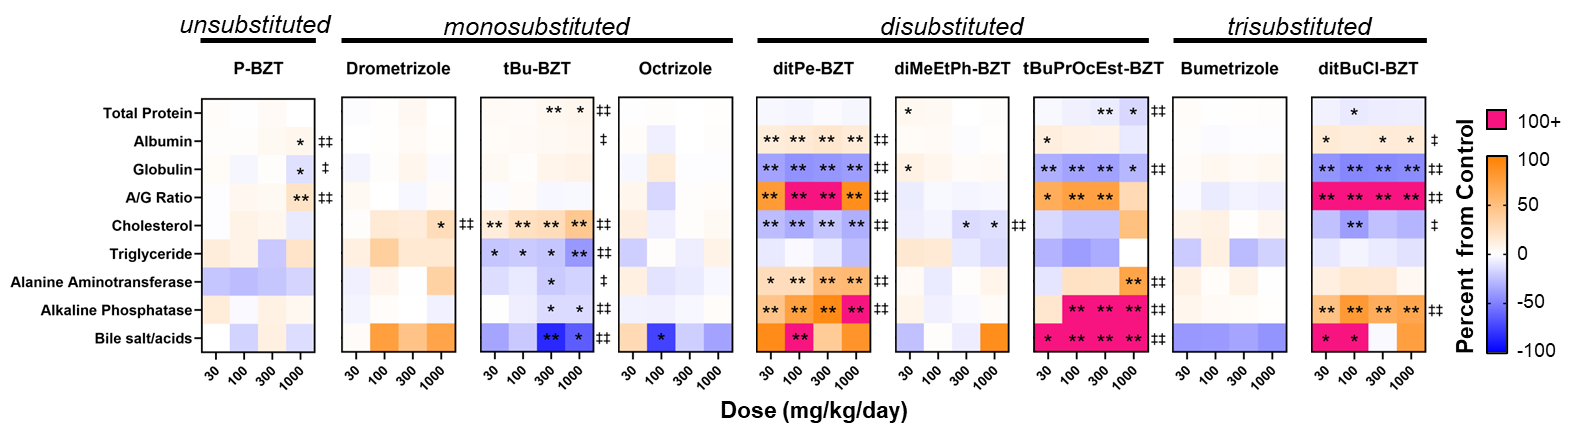
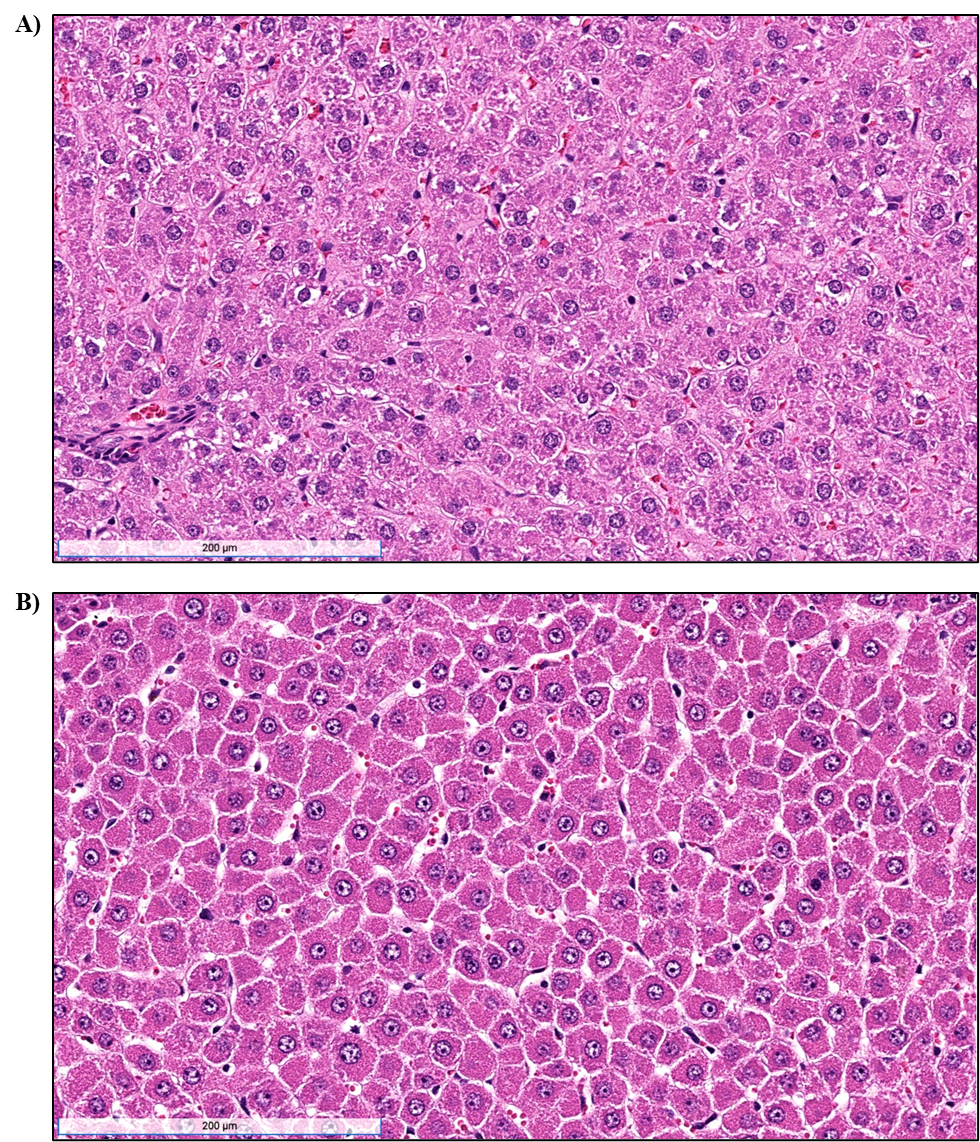
Dosing of rats with seven of the nine phenolic benzotriazoles, across all substitution groups, indicated the liver was the common target organ for toxicity. Liver toxicity was not seen in the animals administered the monosubstituted octrizole or disubstituted diMeEtPh-BZT. Significant increases in the incidence of hepatocyte hypertrophy were observed in all dose groups of disubstituted ditPe-BZT and trisubstituted ditBuCl-BZT and starting at 100 mg/kg/day of disubstituted tBuPrOcEst-BZT; for P-BZT, drometrizole, and tBu-BZT, significant increases were observed at only the highest dose. Histopathological changes in the liver were generally consistent with the dose-related significant increases in liver weight, peroxisome proliferator-activated receptor alpha (PPARα)-related gene expression (Acot1, Acox1, and Cyp4a1) in the liver, serum alkaline phosphatase (ALP), albumin, and albumin/globulin ratio (A/G ratio) and were consistent with significant decreases in serum globulin. A significant increase in creatine kinase activity, a biomarker of muscle injury, was also observed in rats administered ≥300 mg/kg/day ditPe-BZT.
The unsubstituted P-BZT and the monosubstituted compounds drometrizole and tBu-BZT induced significant increases in liver weights, corresponding to a higher incidence of hepatocyte hypertrophy. However, changes in liver weight were not as large, and histopathological changes were not accompanied by changes to serum biomarkers and gene expression as were seen with ditPe-BZT, tBuPrOcEst-BZT, and ditBuCl-BZT. The 1,000 mg/kg/day P-BZT group had significant changes in PPARα-related gene expression, increased albumin and A/G ratio, and decreased globulin, although to a lesser extent. However, tBu-BZT showed contrasting effects to the other chemicals, with significant decreases, rather than increases, to the liver enzymes and changes to lipid metabolism biomarkers with significantly increased cholesterol and decreased triglycerides in all dosed groups. Rats administered bumetrizole, a trisubstituted chemical, had minimal, but significant, increases in liver weight at 1,000 mg/kg/day, with no other related changes.
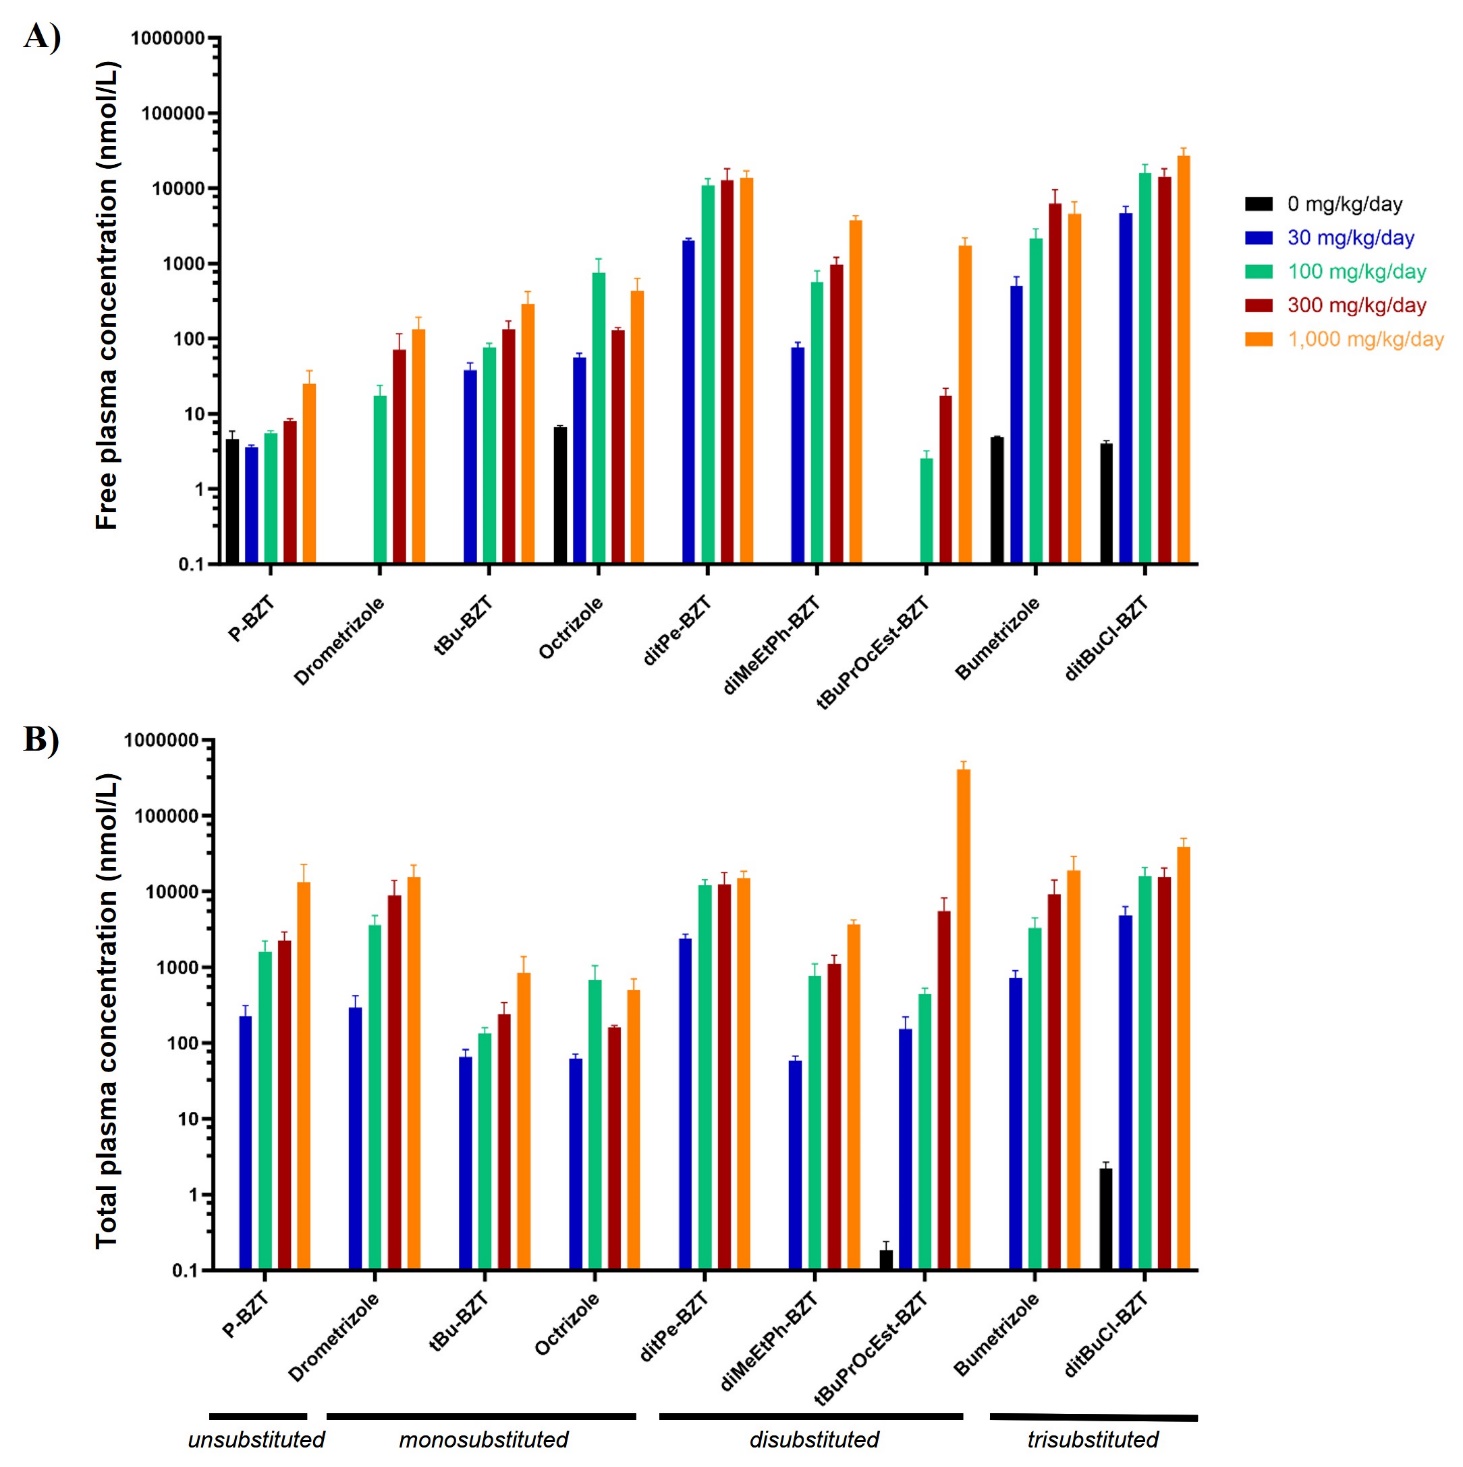
Two phenolic benzotriazoles, octrizole and diMeEtPh-BZT, which are mono- and disubstituted, respectively, displayed overall minimal to no dose-related changes. The observed differences in toxicological outcomes could not be explained by the plasma concentrations of free (unconjugated) and total (conjugated and unconjugated) parent measured at study termination.
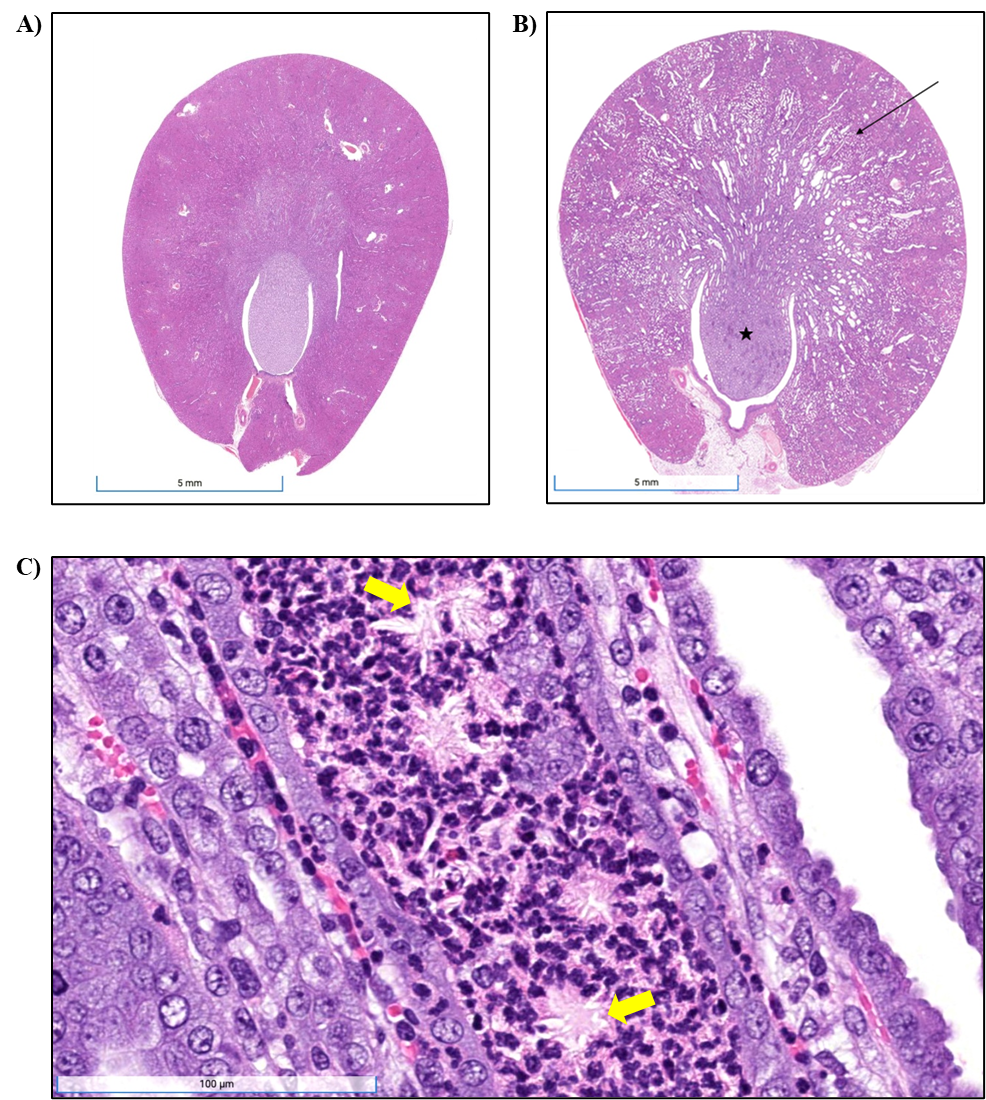
Absolute and relative kidney weights were significantly increased for the 1,000 mg/kg/day tBuPrOcEst-BZT group, which corresponded with obstructive nephropathy and renal tubule inflammation in all animals. Left and right kidney weights (absolute and relative) were also significantly increased, although to a lesser extent, following administration of the unsubstituted phenolic benzotriazole P-BZT at 1,000 mg/kg/day, the disubstituted ditPe-BZT at ≥100 mg/kg/day (except for 1,000 mg/kg/day for the left kidney), and all groups administered the trisubstituted ditBuCl-BZT. Kidney weight changes for P-BZT, ditPe-BZT, and ditBuCl-BZT did not show corresponding histopathological changes.
In the in vivo rodent peripheral blood micronucleus assay, eight of the phenolic benzotriazoles tested were negative, whereas tBuPrOcEst-BZT was judged to be equivocal.
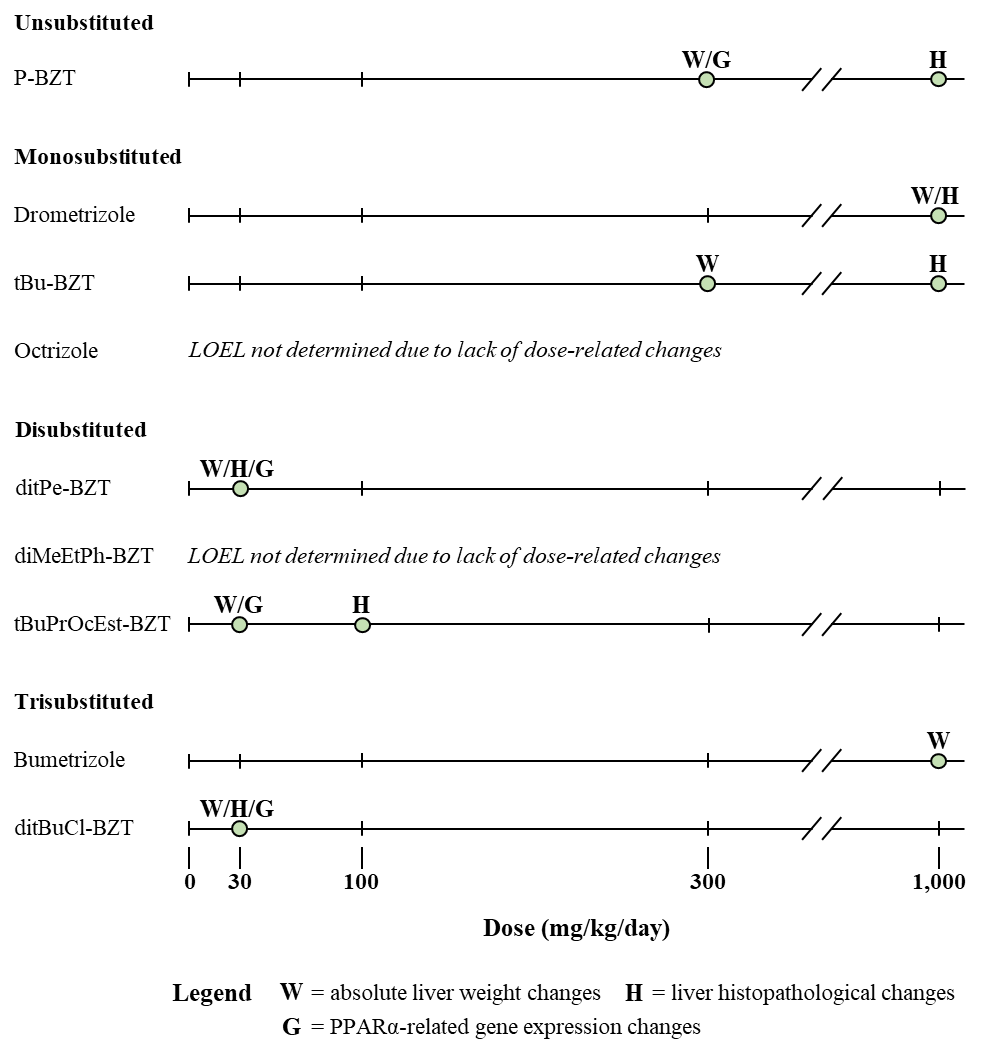
In conclusion, these studies provide data for comparison of nine phenolic benzotriazoles in male rats. The liver was the primary target affected by seven of the phenolic benzotriazoles evaluated, mainly driven by increased liver weights, the incidence of hepatocyte hypertrophy, and upregulation of PPARα-related gene expression in the liver. However, the lowest-observed-effect levels (LOELs) and doses at which corresponding changes in liver-related biomarkers occurred varied across the nine chemicals studied for this class. A LOEL could not be determined for octrizole or diMeEtPh-BZT, as there was no evidence of toxicity at the doses tested. Rats administered drometrizole and bumetrizole had a LOEL of 1,000 mg/kg/day. Rats administered either P-BZT or tBu-BZT had a LOEL of 300 mg/kg/day. DitPe-BZT, tBuPrOcEst-BZT, and ditBuCl-BZT were the most potent as each test article had a LOEL of 30 mg/kg/day, the lowest dose administered in these studies. The range of LOELs highlights that while the liver is a common target, the potency of phenolic benzotriazoles varies within the class. Another target identified was the kidney, with increased absolute kidney weights occurring for four chemicals, although only tBuPrOcEst-BZT showed associated histopathological changes. Further quantitative comparisons across the phenolic benzotriazole class will require a more in-depth study of the underlying mechanisms involved and classification methods to allow extrapolations to other chemicals in this class.
Summary of Findings Considered Toxicologically Relevant in Male Rats Administered Phenolic Benzotriazoles by Gavage for Two Weeks
| Individual Chemical | Unsubstituted | Monosubstituted | Disubstituted | Trisubstituted | |||||
|---|---|---|---|---|---|---|---|---|---|
| P-BZT | Drometrizole | tBu-BZT | Octrizole | ditPe-BZT | diMeEtPh-BZT | tBuPrOcEst-BZT | Bumetrizole | ditBuCl-BZT | |
| Chemical structurea | 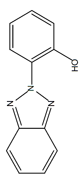 | 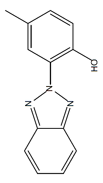 | 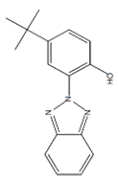 | 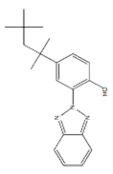 | 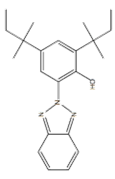 | 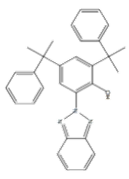 | 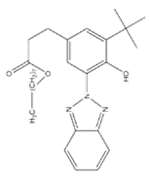 | 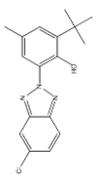 | 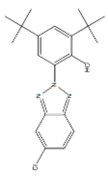 |
| Doses in aqueous methylcelluloseb | 0, 30, 100, 300, or 1,000 mg/kg/day | ||||||||
| Survival ratesb | No effectc | No effect | No effect | No effect | No effect | No effect | No effect | No effect | No effect |
| Body weights | No effect | No effect | No effect | No effect | No effect | No effect | ↓ (300 and 1,000 mg/kg/day groups: 12.3% and 33.2% lower than the control group, respectively, at study termination) | No effect | No effect |
| Clinical findingsb | Red nasal discharge | ||||||||
| Organ weights | ↑ Absolute and relative liver weight ↑ Absolute and relative left and right kidney weight | ↑ Absolute and relative liver weight | ↑ Absolute and relative liver weight | None | ↑ Absolute and relative liver weight ↑ Absolute and relative left and right kidney weight | None | ↑ Absolute and relative liver weight ↑ Absolute and relative left and right kidney weight | ↑ Absolute and relative liver weight | ↑ Absolute and relative liver weight ↑ Absolute and relative left and right kidney weight |
| Clinical chemistry | ↑ Albumin ↓ Globulin ↑ A/G ratio | ↑ Cholesterol | ↑ Total protein ↑ Cholesterol ↓ Triglycerides ↓ ALT ↓ ALP ↓ Bile salts/acids | No effect | ↑ Albumin ↓ Globulin ↑ A/G ratio ↓ Cholesterol ↑ ALT ↑ ALP ↑ Bile salts/acids ↑ Creatine kinase | ↓ Cholesterol | ↓ Total protein ↑ Albumin ↓ Globulin ↑ A/G ratio ↑ ALT ↑ ALP ↑ Bile salts/acids ↑ Urea nitrogen | No effect | ↓ Total protein ↑ Albumin ↓ Globulin ↑ A/G ratio ↓ Cholesterol ↑ ALP ↑ Bile salts/acids |
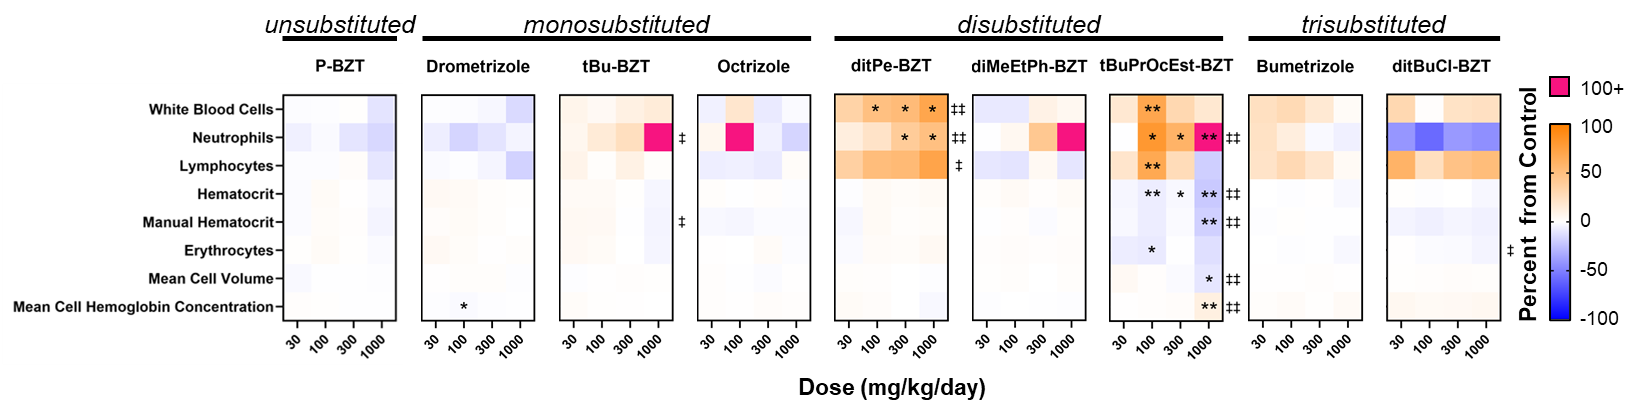
| Hematology | No effect | No effect | No effect | No effect | ↑ White blood cells ↑ Neutrophils | No effect | ↑ Neutrophils ↑ Lymphocytes ↓ Hematocrit ↓ Manual hematocrit ↓ Erythrocytes ↓ Mean cell volume ↑ MCHC | No effect | No effect |
| Liver gene expression | |||||||||
PPARα pathwayd | ↑ | No effect | No effect | No effect | ↑ | No effect | ↑ | No effect | ↑ |
CAR/PXR pathwaye | No effect | No effect | No effect | No effect | ↑/↓f | No effect | –/↓g | No effect | ↑/↓f |
NRF2 pathwayh | No effect | No effect | ↑ | No effect | ↓ | No effect | ↓ | ↑ | ↓ |
TP53 pathwayb,i | No effect | No effect | No effect | No effect | No effect | No effect | No effect | No effect | No effect |
| Nonneoplastic effects | Liver: hepatocyte, hypertrophy (0/5, 0/5, 0/5, 2/5, 5/5) | Liver: hepatocyte, hypertrophy (0/5, 0/5, 2/5, 1/5, 4/5) | Liver: hepatocyte, hypertrophy (0/5, 0/5, 1/5, 2/5, 5/5) | None | Liver: hepatocyte, hypertrophy (0/5, 5/5, 5/5, 5/5, 5/5) | None | Liver: hepatocyte, hypertrophy (0/5, 0/5, 5/5, 5/5, 5/5) Kidney: nephropathy, obstructive (0/5, 0/5, 0/5, 0/5, 5/5); renal tubule, inflammation, suppurative (0/5, 0/5, 0/5, 0/5, 5/5) | None | Liver: hepatocyte, hypertrophy (0/5, 5/5, 5/5, 5/5, 5/5) |
| Genetic toxicology | |||||||||
| Micronucleated erythrocytes (in vivo) | |||||||||
Rat peripheral blood | Negative | Negative | Negative | Negative | Negative | Negative | Equivocal | Negative | Negative |
| Lowest-observed-effect level (LOEL) (mg/kg/day) | 300 | 1,000 | 300 | NAj | 30 | NA | 30 | 1,000 | 30 |
Summary of Findings Considered Toxicologically Relevant in Male Rats Administered Phenolic Benzotriazoles by Gavage for Two Weeks
| Individual Chemical | Unsubstituted | Monosubstituted | Disubstituted | Trisubstituted | |||||
|---|---|---|---|---|---|---|---|---|---|
| P-BZT | Drometrizole | tBu-BZT | Octrizole | ditPe-BZT | diMeEtPh-BZT | tBuPrOcEst-BZT | Bumetrizole | ditBuCl-BZT | |
| Chemical structurea | | | | | | | | | |
| Doses in aqueous methylcelluloseb | 0, 30, 100, 300, or 1,000 mg/kg/day | ||||||||
| Survival ratesb | No effectc | No effect | No effect | No effect | No effect | No effect | No effect | No effect | No effect |
| Body weights | No effect | No effect | No effect | No effect | No effect | No effect | ↓ (300 and 1,000 mg/kg/day groups: 12.3% and 33.2% lower than the control group, respectively, at study termination) | No effect | No effect |
| Clinical findingsb | Red nasal discharge | ||||||||
| Organ weights | ↑ Absolute and relative liver weight ↑ Absolute and relative left and right kidney weight | ↑ Absolute and relative liver weight | ↑ Absolute and relative liver weight | None | ↑ Absolute and relative liver weight ↑ Absolute and relative left and right kidney weight | None | ↑ Absolute and relative liver weight ↑ Absolute and relative left and right kidney weight | ↑ Absolute and relative liver weight | ↑ Absolute and relative liver weight ↑ Absolute and relative left and right kidney weight |
| Clinical chemistry | ↑ Albumin ↓ Globulin ↑ A/G ratio | ↑ Cholesterol | ↑ Total protein ↑ Cholesterol ↓ Triglycerides ↓ ALT ↓ ALP ↓ Bile salts/acids | No effect | ↑ Albumin ↓ Globulin ↑ A/G ratio ↓ Cholesterol ↑ ALT ↑ ALP ↑ Bile salts/acids ↑ Creatine kinase | ↓ Cholesterol | ↓ Total protein ↑ Albumin ↓ Globulin ↑ A/G ratio ↑ ALT ↑ ALP ↑ Bile salts/acids ↑ Urea nitrogen | No effect | ↓ Total protein ↑ Albumin ↓ Globulin ↑ A/G ratio ↓ Cholesterol ↑ ALP ↑ Bile salts/acids |
| Hematology | No effect | No effect | No effect | No effect | ↑ White blood cells ↑ Neutrophils | No effect | ↑ Neutrophils ↑ Lymphocytes ↓ Hematocrit ↓ Manual hematocrit ↓ Erythrocytes ↓ Mean cell volume ↑ MCHC | No effect | No effect |
| Liver gene expression | |||||||||
| PPARα pathwayd | ↑ | No effect | No effect | No effect | ↑ | No effect | ↑ | No effect | ↑ |
| CAR/PXR pathwaye | No effect | No effect | No effect | No effect | ↑/↓f | No effect | –/↓g | No effect | ↑/↓f |
| NRF2 pathwayh | No effect | No effect | ↑ | No effect | ↓ | No effect | ↓ | ↑ | ↓ |
| TP53 pathwayb,i | No effect | No effect | No effect | No effect | No effect | No effect | No effect | No effect | No effect |
| Nonneoplastic effects | Liver: hepatocyte, hypertrophy (0/5, 0/5, 0/5, 2/5, 5/5) | Liver: hepatocyte, hypertrophy (0/5, 0/5, 2/5, 1/5, 4/5) | Liver: hepatocyte, hypertrophy (0/5, 0/5, 1/5, 2/5, 5/5) | None | Liver: hepatocyte, hypertrophy (0/5, 5/5, 5/5, 5/5, 5/5) | None | Liver: hepatocyte, hypertrophy (0/5, 0/5, 5/5, 5/5, 5/5) Kidney: nephropathy, obstructive (0/5, 0/5, 0/5, 0/5, 5/5); renal tubule, inflammation, suppurative (0/5, 0/5, 0/5, 0/5, 5/5) | None | Liver: hepatocyte, hypertrophy (0/5, 5/5, 5/5, 5/5, 5/5) |
| Genetic toxicology | |||||||||
| Micronucleated erythrocytes (in vivo) | |||||||||
| Rat peripheral blood | Negative | Negative | Negative | Negative | Negative | Negative | Equivocal | Negative | Negative |
| Lowest-observed-effect level (LOEL) (mg/kg/day) | 300 | 1,000 | 300 | NAj | 30 | NA | 30 | 1,000 | 30 |
Introduction
Chemical and Physical Properties
Phenolic benzotriazoles are a class of chemicals consisting of a benzotriazole moiety attached to a phenol. The hydroxyl group is located at the 2-position of the phenolic ring and, if further substituted, these substituents are often located at the 3- and/or 5-positions (R1 and R2 in Figure 1). The benzotriazole moiety may also carry a substituent as indicated by R3 in Figure 1. This report focuses on nine chemicals within the phenolic benzotriazole class, including one unsubstituted, three monosubstituted (R2), three disubstituted (R1 and R2) including an ester, and two trisubstituted compounds (R1, R2, and R3). The nine phenolic benzotriazoles tested are shown in Table 1.
The physical properties are similar between the chemicals. At room temperature, all are solids, with melting points between 77°C and 155°C for those with published data. These phenolic benzotriazoles are not readily volatile, with low vapor pressures and boiling points varying between 225°C and 589°C. The partition coefficients, log P, range from 3.9 to 9.4, suggesting high lipophilicity and low water solubility.2
2. National Toxicology Program (NTP). Chemical information review document for phenolic benzotriazoles: Supporting nomination for toxicological evaluation by the National Toxicology Program. Research Triangle Park, NC: U.S. Department of Health and Human Services, National Institutes of Health, National Institute of Environmental Health Sciences, National Toxicology Program; 2011.
Production, Use, and Human Exposure
Phenolic benzotriazoles are a class of synthetic chemicals used as ultraviolet (UV)-stabilizer additives in large industrial applications and consumer products. Several methods of producing phenolic benzotriazoles have been previously described and involve chemical or electrolytic reduction of o-nitrobenzenes with a hydrogenation catalyst and a basic substance in an aqueous organic solvent.3 In the U.S. Environmental Protection Agency’s (EPA’s) 2020 Chemical Data Reporting records, the aggregate production volumes for six of the nine phenolic benzotriazoles were found to range from 10,000 to 20,000,000 pounds over the 2011–2020 period.4 The production volume from greatest to least was diMeEtPh-BZT > ditPe-BZT > drometrizole > octrizole > bumetrizole > ditBuCl-BZT.
3. Fukuoka N, Kubota K, Iguchi K. Method of preparing 2-phenylbenzotriazoles. Washington, DC: U.S. Patent and Trademark Office; 1993. U.S. Patent No. 5,187,289. [Accessed: June 16, 2023]. https://www.freepatentsonline.com/5187289.pdf
4. U.S. Environmental Protection Agency (USEPA). Chemical data reporting: 2020 CDR data. Washington, DC: U.S. Environmental Protection Agency; 2020. [Accessed: June 16, 2023]. https://www.epa.gov/chemical-data-reporting/access-cdr-data#2020
Phenolic benzotriazoles are added to products to absorb UV light to increase product stability. The addition of phenolic benzotriazoles improves the durability of clear coats by inhibiting or retarding the occurrence of failures such as gloss reduction, cracking, color change, blistering, and delamination. Phenolic benzotriazoles are added to several plastics such as polyethylene polymers, polycarbonate resins, polyvinyl chloride and rigid vinyl chloride, polystyrene, olefin polymers, acrylics, and other polymers. Drometrizole, octrizole, ditPe-BZT, diMeEtPh-BZT, tBuPrOcEst-BZT, and bumetrizole have various uses in industrial coatings for furniture, flooring, cementitious substrate, automotive coatings, marine coatings, wood stains, sealants, adhesives, and window glazing among other applications. Additionally, tBuPrOcEst-BZT has uses in inkjet inks for printing and packaging. The recommended concentrations in products range from 0.1% to 3% by weight.5-9
5. Baoxu Chemical. Additivesforpolymer: Benzophenones and benzotriazole UV absorber. DongGuan City, China: Baoxu Chemical Technology Ltd; 2023. [Accessed: June 16, 2023]. https://www.additivesforpolymer.com/products/uv-absorber-hals/uv-absorber/
9. BASF. Safety data sheet: Tinuvin 326. Florham Park, NJ: BASF Corporation; 2021. [Accessed: July 28, 2023]. https://dispersions-resins-products.basf.us/products/tinuvin-326
In addition to industrial use, phenolic benzotriazoles are additives in several consumer products. A recent assessment of plastic food packaging and beverage bottle caps in Japan found drometrizole and bumetrizole at concentrations up to 234 ng/g.10 In an experiment, diMeEtPh-BZT was shown to be able to migrate into food from plastic food packaging.11 Drometrizole and ditPe-BZT have been detected in dental restorative materials such as dental prostheses and filling materials.12 Drometrizole and tBu-BZT have been reported in the fabrics, foams, and composite materials of car seats in the United States.13 Among clothing textiles tested in Sweden, diMeEtPh-BZT, drometrizole, and ditPe-BZT were detected at concentrations up to 6,690, 244, and 85.3 ng/g, respectively.14 Phenolic benzotriazoles are also used as additives in fragrances,15 laundry detergents,16 and cosmetics.17
10. Sakuragi Y, Takada H, Sato H, Kubota A, Terasaki M, Takeuchi S, Ikeda-Araki A, Watanabe Y, Kitamura S, Kojima H. An analytical survey of benzotriazole UV stabilizers in plastic products and their endocrine-disrupting potential via human estrogen and androgen receptors. Sci Total Environ. 2021; 800:149374. DOI: 10.1016/j.scitotenv.2021.149374 PubMed: 34388645
11. Begley TH, Biles JE, Cunningham C, Piringer O. Migration of a UV stabilizer from polyethylene terephthalate (PET) into food simulants. Food Addit Contam. 2004; 21(10):1007-1014. DOI: 10.1080/02652030400010447 PubMed: 15712525
12. Durner J, Spahl W, Zaspel J, Schweikl H, Hickel R, Reichl FX. Eluted substances from unpolymerized and polymerized dental restorative materials and their Nernst partition coefficient. Dent Mater. 2010; 26(1):91-99. DOI: 10.1016/j.dental.2009.08.014 PubMed: 19781758
13. Wu Y, Venier M. High levels of synthetic antioxidants and ultraviolet filters in children’s car seats. Sci Total Environ. 2023; 855:158637. DOI: 10.1016/j.scitotenv.2022.158637 PubMed: 36096214
14. Luongo G, Avagyan R, Hongyu R, Östman C. The washout effect during laundry on benzothiazole, benzotriazole, quinoline, and their derivatives in clothing textiles. Environ Sci Pollut Res Int. 2016; 23(3):2537-2548. DOI: 10.1007/s11356-015-5405-7 PubMed: 26429136
15. International Fragrance Association (IFRA). IFRA transparency list. Geneva, Switzerland: International Fragrance Association; 2022. [Accessed: June 16, 2023]. https://ifrafragrance.org/priorities/ingredients/ifra-transparency-list
16. Sardar SW, Choi Y, Park N, Jeon J. Occurrence and concentration of chemical additives in consumer products in Korea. Int J Environ Res Public Health. 2019; 16(24):5075. DOI: 10.3390/ijerph16245075 PubMed: 31842379
17. Environmental Working Group (EWG). EWG's Skin Deep: Products containing bumetrizole. Washington, DC: Environmental Working Group; 2023. [Accessed: June 16, 2023]. https://www.ewg.org/skindeep/browse/ingredients/700836-BUMETRIZOLE/
There is a dearth of information on human exposure to phenolic benzotriazoles. A few recent studies measured the concentrations of several phenolic benzotriazoles in breastmilk from women in Spain,18 South Korea,19 and Japan, the Philippines, and Vietnam,20 with measurable average concentrations ranging from 0.08 to 151.7 ng/g lipid weight for the nine phenolic benzotriazoles included in the present report. Some of these nine phenolic benzotriazoles can be found frequently in human samples; for example, in breastmilk sampled from 87 women in South Korea, 98% of samples contained ditPe-BZT, with a mean concentration of 64.3 ng/g and a maximum concentration of 334 ng/g lipid weight.19 Other phenolic benzotriazoles were also detected in these three studies, with average concentrations ranging from 0.02 to 434.8 ng/g lipid weight. Overall, across the studies, multiple phenolic benzotriazoles were detected in breastmilk samples; however, the compounds detected and their concentrations varied based on geographic location.
18. Molins-Delgado D, Olmo-Campos MDM, Valeta-Juan G, Pleguezuelos-Hernández V, Barceló D, Díaz-Cruz MS. Determination of UV filters in human breast milk using turbulent flow chromatography and babies’ daily intake estimation. Environ Res. 2018; 161:532-539. DOI: 10.1016/j.envres.2017.11.033 PubMed: 29232646
19. Lee S, Kim S, Park J, Kim HJ, Lee JJ, Choi G, Choi S, Kim S, Kim SY, Choi K, et al. Synthetic musk compounds and benzotriazole ultraviolet stabilizers in breast milk: Occurrence, time-course variation and infant health risk. Environ Res. 2015; 140:466-473. DOI: 10.1016/j.envres.2015.04.017 PubMed: 25988989
20. Kim JW, Chang KH, Prudente M, Viet PH, Takahashi S, Tanabe S, Kunisue T, Isobe T. Occurrence of benzotriazole ultraviolet stabilizers (BUVSs) in human breast milk from three Asian countries. Sci Total Environ. 2019; 655:1081-1088. DOI: 10.1016/j.scitotenv.2018.11.298 PubMed: 30577102
19. Lee S, Kim S, Park J, Kim HJ, Lee JJ, Choi G, Choi S, Kim S, Kim SY, Choi K, et al. Synthetic musk compounds and benzotriazole ultraviolet stabilizers in breast milk: Occurrence, time-course variation and infant health risk. Environ Res. 2015; 140:466-473. DOI: 10.1016/j.envres.2015.04.017 PubMed: 25988989
Phenolic benzotriazoles have been measured in environmental samples worldwide; however, it is beyond the scope of this report to review all relevant publications. Analyses of sediment, wastewater, and river samples have detected phenolic benzotriazoles in the United States,21-23 China,24-28 and India.29 Indoor dust samples in Spain also were found to contain drometrizole, ditPe-BZT, bumetrizole, and ditBuCl-BZT.30 These chemicals have been detected in several animal samples, including beluga blubber,31 king penguins,32 and other marine species.33-41 Additionally, there is evidence that octrizole can bioaccumulate in plants from the surrounding soil,28 which suggests that phenolic benzotriazoles will readily bioconcentrate in an organism as compared to the water or soil around it.
21. Jungclaus G, Avila V, Hites R. Organic compounds in an industrial wastewater: A case study of their environmental impact. Environ Sci Technol. 1978; 12(1):88-96. DOI: 10.1021/es60137a015
23. Cantwell MG, Sullivan JC, Katz DR, Burgess RM, Bradford Hubeny J, King J. Source determination of benzotriazoles in sediment cores from two urban estuaries on the Atlantic Coast of the United States. Mar Pollut Bull. 2015; 101(1):208-218. DOI: 10.1016/j.marpolbul.2015.10.075 PubMed: 26561444
24. Peng X, Xiong S, Ou W, Wang Z, Tan J, Jin J, Tang C, Liu J, Fan Y. Persistence, temporal and spatial profiles of ultraviolet absorbents and phenolic personal care products in riverine and estuarine sediment of the Pearl River catchment, China. J Hazard Mater. 2017; 323(Pt A):139-146. 10.1016/j.jhazmat.2016.05.020 27209124
28. Lyu Y, Li G, He Y, Li Y, Tang Z. Occurrence and distribution of organic ultraviolet absorbents in soils and plants from a typical industrial area in South China. Sci Total Environ. 2022; 846:157383. DOI: 10.1016/j.scitotenv.2022.157383 PubMed: 35843326
29. Vimalkumar K, Mayilsamy M, Arun E, Gobinath B, Prasanth S, Nikhil PN, Krishna-Kumar S, Srimurali S, Mkandawire M, Babu-Rajendran R. Screening of antimicrobials, fragrances, UV stabilizers, plasticizers and preservatives in sewage treatment plants (STPs) and their risk assessment in India. Chemosphere. 2022; 308(Pt 3):136452. DOI: 10.1016/j.chemosphere.2022.136452 PubMed: 36116630
30. Carpinteiro I, Abuín B, Rodríguez I, Ramil M, Cela R. Pressurized solvent extraction followed by gas chromatography tandem mass spectrometry for the determination of benzotriazole light stabilizers in indoor dust. J Chromatogr A. 2010; 1217(24):3729-3735. DOI: 10.1016/j.chroma.2010.04.022 PubMed: 20435314
31. Blouin K, Malaisé F, Verreault J, Lair S, Lu Z. Occurrence and temporal trends of industrial antioxidants and UV absorbents in the endangered St. Lawrence Estuary beluga whale (Delphinapterus leucas). Sci Total Environ. 2022; 842:156635. DOI: 10.1016/j.scitotenv.2022.156635 PubMed: 35697212
32. Terajima T, Shibahara A, Nakano Y, Kobayashi S, Godwin JR, Nagaoka K, Watanabe G, Takada H, Mizukawa K. Age-related accumulation of persistent organic chemicals in captive king penguins (Aptenodytes patagonicus). J Vet Med Sci. 2022; 84(11):1551-1555. DOI: 10.1292/jvms.22-0245 PubMed: 36198610
33. Pruell RJ, Hoffman EJ, Quinn JG. Total hydrocarbons, polycyclic aromatic hydrocarbons and synthetic organic compounds in the hard shell clam, Mercenaria mercenaria, purchased at commercial seafood stores. Mar Environ Res. 1984; 11(3):163-181. DOI: 10.1016/0141-1136(84)90044-8
41. Provencher JF, Malaisé F, Mallory ML, Braune BM, Pirie-Dominix L, Lu Z. 44-year retrospective analysis of ultraviolet absorbents and industrial antioxidants in seabird eggs from the Canadian Arctic (1975 to 2019). Environ Sci Technol. 2022; 56(20):14562-14573. DOI: 10.1021/acs.est.2c05940 PubMed: 36198135
28. Lyu Y, Li G, He Y, Li Y, Tang Z. Occurrence and distribution of organic ultraviolet absorbents in soils and plants from a typical industrial area in South China. Sci Total Environ. 2022; 846:157383. DOI: 10.1016/j.scitotenv.2022.157383 PubMed: 35843326
Several of the phenolic benzotriazoles included in these studies have been noted for concerns regarding their persistence in the environment.42,43 DitPe-BZT is officially recognized as a persistent organic pollutant and as persistent, bioaccumulative, and toxic by the European Union’s European Chemicals Agency (ECHA). The chemicals ditBuCl-BZT, ditPe-BZT, and two other phenolic benzotriazoles not included in the present report are on ECHA’s candidate list of substances of very high concern for authorization.44 Environmental sampling of sediment cores, soils, and marine animals have indicated the long-term persistence of phenolic benzotriazoles and a lack of substantial degradation in the environment.23,24,32-37 There is potential for human exposure to phenolic benzotriazoles through oral, dermal, and inhalation routes during occupational use, from consumer products, and through consumption of contaminated marine organisms.
42. Brandt M, Becker E, Jöhncke U, Sättler D, Schulte C. A weight-of-evidence approach to assess chemicals: Case study on the assessment of persistence of 4,6-substituted phenolic benzotriazoles in the environment. Environ Sci Eur. 2016; 28(1):4. DOI: 10.1186/s12302-016-0072-y PubMed: 27752439
43. Leubner N, Pawlowski S, Salinas ER, Wigh A, Dammann M, Preibisch A, Schmitt C. Assessment of the bioaccumulation potential of four commonly used phenolic benzotriazoles based on in silico and experimental in vivo data. J Appl Toxicol. 2023; 43(9):1272-1283. DOI: 10.1002/jat.4461 PubMed: 36896760
44. European Chemicals Agency (ECHA). Candidate list of substances of very high concern for authorisation. Helsinki, Finland: European Chemicals Agency; 2023. [Accessed: July 2023]. https://echa.europa.eu/candidate-list-table
23. Cantwell MG, Sullivan JC, Katz DR, Burgess RM, Bradford Hubeny J, King J. Source determination of benzotriazoles in sediment cores from two urban estuaries on the Atlantic Coast of the United States. Mar Pollut Bull. 2015; 101(1):208-218. DOI: 10.1016/j.marpolbul.2015.10.075 PubMed: 26561444
24. Peng X, Xiong S, Ou W, Wang Z, Tan J, Jin J, Tang C, Liu J, Fan Y. Persistence, temporal and spatial profiles of ultraviolet absorbents and phenolic personal care products in riverine and estuarine sediment of the Pearl River catchment, China. J Hazard Mater. 2017; 323(Pt A):139-146. DOI: 10.1016/j.jhazmat.2016.05.020 27209124
32. Terajima T, Shibahara A, Nakano Y, Kobayashi S, Godwin JR, Nagaoka K, Watanabe G, Takada H, Mizukawa K. Age-related accumulation of persistent organic chemicals in captive king penguins (Aptenodytes patagonicus). J Vet Med Sci. 2022; 84(11):1551-1555. DOI: 10.1292/jvms.22-0245 PubMed: 36198610
37. Nakata H, Shinohara R, Nakazawa Y, Isobe T, Sudaryanto A, Subramanian A, Tanabe S, Zakaria MP, Zheng GJ, Lam PKS, et al. Asia-Pacific mussel watch for emerging pollutants: Distribution of synthetic musks and benzotriazole UV stabilizers in Asian and US coastal waters. Mar Pollut Bull. 2012; 64(10):2211-2218. DOI: 10.1016/j.marpolbul.2012.07.049 PubMed: 22910332
Regulatory Status
Several phenolic benzotriazoles are regulated by EPA and the U.S. Food and Drug Administration (FDA). Drometrizole, tBu-BZT, octrizole, ditPe-BZT, diMeEtPh-BZT, bumetrizole, and ditBuCl-BZT are listed as active in commercial use in the EPA Toxic Substances Control Act Inventory. Specific regulations vary for each of the individual phenolic benzotriazoles.
EPA regulates drometrizole and ditPe-BZT under different uses. Drometrizole is allowed as an inert ingredient of pesticides applied to animals, specifically as a UV light absorber or stabilizer in animal tags and similar slow-release devices, and is regulated for this use at <0.5% by weight of pesticide formulation.45 As of 2010, ditPe-BZT is exempt from the requirement of a tolerance when used as an inert ingredient at a maximum concentration of 0.06% in insecticide formulations applied before harvest to several plants, such as canola, chickpeas, cotton, navy beans, lentils, and sunflowers.46 Under FDA regulations, drometrizole, octrizole, bumetrizole, and diMeEtPh-BZT are approved for food and nonfood uses as antioxidants or stabilizers in polymers under specifically noted limitations.47 DitPe-BZT is approved for use as a component of food packaging adhesives.48 Octrizole is also permitted for use in fragrances.49
45. U.S. Environmental Protection Agency (USEPA). 40 CFR Chapter I - Environmental Protection Agency. Subchapter E - Pesticide programs. Subpart D - Exemptions from tolerances. §180.930 Inert ingredients applied to animals; exemptions from the requirement of a tolerance. 2023. [Accessed: June 16, 2023]. https://www.ecfr.gov/current/title-40/chapter-I/subchapter-E/part-180/subpart-D/section-180.930
46. U.S. Environmental Protection Agency (USEPA). 40 CFR Chapter I - Environmental Protection Agency. Subchapter E - Pesticide programs. Subpart D - Exemptions from tolerances. §180.920 Inert ingredients used pre-harvest; exemptions from the requirement of a tolerance. 2023. [Accessed: June 16, 2023]. https://www.ecfr.gov/current/title-40/chapter-I/subchapter-E/part-180/subpart-D/section-180.920
47. U.S. Food and Drug Administration (FDA). 21 CFR Subpart C - Antioxidants and stabilizers. §178.2010 Antioxidants and/or stabilizers for polymers. 2023. [Accessed: June 16, 2023]. https://www.ecfr.gov/current/title-21/chapter-I/subchapter-B/part-178/subpart-C
48. U.S. Food and Drug Administration (FDA). 21 CFR Subpart B - Substances for use only as components of adhesives. §175.105 Adhesives. 2023. [Accessed: June 16, 2023]. https://www.ecfr.gov/current/title-21/chapter-I/subchapter-B/part-175
49. U.S. Environmental Protection Agency (USEPA). InertFinder. Washington, DC: U.S. Environmental Protection Agency; 2023. [Accessed: June 30, 2023]. https://ordspub.epa.gov/ords/pesticides/f?p=INERTFINDER:1:0::NO:1
Absorption, Distribution, Metabolism, and Excretion
Experimental Animals
Absorption, distribution, metabolism, and excretion (ADME) data are limited in the literature for phenolic benzotriazoles. In a study of four male albino rats given a single oral dose of 10 mg/kg body weight (mg/kg) of radiolabeled drometrizole, 91% was excreted within the first 48 hours and the compound was almost completely eliminated within 168 hours, with minor residual radioactivity in the liver. The radiolabeled drometrizole was excreted primarily in the urine (73%) and in feces (27%).50
50. Schmid K, Schweizer W, Stäubli W, Waechter F. Studies of the effect of 2-(2′-hydroxy-5′-methylphenyl)benzotriazole on rat liver. Food Cosmet Toxicol. 1980; 18(3):245-252. DOI: 10.1016/0015-6264(80)90102-9 PubMed: 7419140
Literature investigating the metabolism of tBuPrOcEst-BZT is limited. An in vitro study investigating the metabolism of a similar phenolic benzotriazole ester compound, 3-(2H-benzotriazol-2-yl)-5-(1,1-dimethylethyl)-4-hydroxybenzenepropanoic acid, methyl ester, was shown to be rapidly hydrolyzed in the serum and liver homogenate of rats and was metabolized to a lesser extent in the small intestine homogenates. Following oral administration of 10 mg/kg of the same compound in two male rats, the maximum blood concentration was reached after 1–2 hours, and a half-life of less than 12 hours was determined. The carboxylic acid metabolite of the ester was the primary metabolite identified.51,52
51. Thomas H, Hess R, Waechter F. Toxicology of industrial compounds. London, UK: Taylor & Francis; 1995.
52. Organisation for Economic Co-operation and Development (OECD). Case study on the use of an integrated approach to testing and assessment for the repeated-dose toxicity of phenolic benzotriazoles. Paris, France: Organisation for Economic Co-operation and Development; 2017. ENV/JM/MONO(2017)23. [Accessed: July 5, 2023]. https://one.oecd.org/document/ENV/JM/MONO(2017)23/en/pdf
The toxicokinetic behavior of the nine phenolic benzotriazoles included in this report has been investigated in male rats following single intravenous (2.25 mg/kg) or gavage (30 and 300 mg/kg) administration as part of the National Toxicology Program research program and have been previously published.53 Similar to the abovementioned in vitro study of a similar phenolic benzotriazole compound, this study also verified that the ester tBuPrOcEst-BZT was rapidly hydrolyzed to its corresponding acid; therefore, for this chemical, the toxicokinetic parameters of the acid were generated. In general, systemic exposure, as determined by the maximum plasma concentration (Cmax) and the area under the concentration versus time curve (AUC), increased with the degree of substitution of the phenolic benzotriazole, with tri- and disubstituted > monosubstituted >> unsubstituted compounds. A similar pattern was also followed for the time at which maximum concentration was reached (Tmax), wherein average Tmax values ranged from 0.0196 to 7.8 hours. There was no clear pattern or relationship to the degree of substitution in plasma elimination half-life, which ranged from approximately 2 to 57 hours. Estimated oral bioavailability of phenolic benzotriazoles was found to be low overall, with the unsubstituted P-BZT at 6% and the substituted compounds slightly higher at 13%–23%. Oral bioavailability decreased with increasing dose, suggesting decreased absorption at higher doses. These results may indicate extensive intestinal and hepatic metabolism of the unsubstituted P-BZT relative to the substituted phenolic benzotriazoles and that slower metabolism and clearance occur as the degree of substitution increases, leading to increased systemic exposure to the parent. Overall, the variations in structure of the phenolic benzotriazoles can influence their ADME characteristics.
53. Waidyanatha S, Mutlu E, Gibbs S, Pierfelice J, Smith JP, Burback B, Blystone CT. Phenolic benzotriazoles: A class comparison of toxicokinetics of ultraviolet-light absorbers in male rats. Xenobiotica. 2021; 51(7):831-841. DOI: 10.1080/00498254.2021.1927239 PubMed: 33952035
Humans
There are limited data for ADME of phenolic benzotriazoles in humans. Studies with human liver microsomes identified several phase I metabolites following ditBuCl-BZT and ditPe-BZT administration.54,55 Following ingestion of a single dose of 0.3 mg/kg ditBuCl-BZT56 or ditPe-BZT,57 the Cmax values were similar, at 632 and 736 μg/L, respectively. Both compounds showed biphasic elimination curves, with terminal phase elimination half-lives of 24.9 and 16.3 hours for ditBuCl-BZT and ditPe-BZT, respectively. These studies found that the major metabolites of ditBuCl-BZT and ditPe-BZT present in blood and urine were products of successive oxidation of the substitution side chains on the phenolic ring. Data showed that the major excretion pathway is through biliary and fecal clearance, with minor excretion via urine (<0.1%) for both compounds. The chemical properties of these compounds indicate the possibility of their storage in lipid depots in the body and that they may undergo enterohepatic circulation before being fully excreted.
54. Fischer C, Leibold E, Göen T. Identification of in vitro phase I metabolites of benzotriazole UV stabilizer UV-327 using HPLC coupled with mass spectrometry. Toxicol In Vitro. 2020; 68:104932. DOI: 10.1016/j.tiv.2020.104932 PubMed: 32652170
55. Denghel H, Leibold E, Göen T. Oxidative phase I metabolism of the UV absorber 2-(2H-benzotriazol-2-yl)-4,6-di-tert-pentylphenol (UV 328) in an in vitro model with human liver microsomes. Toxicol In Vitro. 2019; 60:313-322. DOI: 10.1016/j.tiv.2019.06.012 PubMed: 31207346
56. Fischer C, Leibold E, Hiller J, Göen T. Human metabolism and excretion kinetics of benzotriazole UV stabilizer UV-327 after single oral administration. Arch Toxicol. 2023; 97(1):165-176. DOI: 10.1007/s00204-022-03401-3 PubMed: 36335248
57. Denghel H, Hiller J, Leibold E, Göen T. Human metabolism and kinetics of the UV absorber 2-(2H-benzotriazol-2-yl)-4,6-di-tert-pentylphenol (UV 328) after oral administration. Arch Toxicol. 2021; 95(8):2677-2690. DOI: 10.1007/s00204-021-03093-1 PubMed: 34180011
Toxicity
Experimental Animals
Further reviews of in vivo toxicity and carcinogenicity studies of several phenolic benzotriazoles have been published elsewhere by Health Canada,58 EPA,4,59 and the Organisation for Economic Co-operation and Development (OECD).52 The liver appears to be the common target organ of toxicity for chemicals in this class. Kidney toxicity is also an occasional finding for several phenolic benzotriazoles in existing literature.
58. Environment and Climate Change Canada (ECCC). Health Canada. Draft screening assessment: Benzotriazoles and benzothiazoles group. Gatineau, Quebec, Canada: Environment and Climate Change Canada; 2021. [Accessed: July 28, 2023]. https://www.canada.ca/en/environment-climate-change/services/evaluating-existing-substances/draft-screening-assessment-benzotriazoles-benzothiazoles-group.html
4. U.S. Environmental Protection Agency (USEPA). Chemical data reporting: 2020 CDR data. Washington, DC: U.S. Environmental Protection Agency; 2020. [Accessed: June 16, 2023]. https://www.epa.gov/chemical-data-reporting/access-cdr-data#2020
59. U.S. Environmental Protection Agency (USEPA). Screening-level hazard characterization: Sponsored chemicals: Phenolic benzotriazoles category: 2-(2’-hydroxy-5’-methylphenyl) benzotriazole (CASRN 2440-22-4), 2-(2’-hydroxy-5’-octylphenyl) benzotriazole (CASRN 3147-75-9), 2-(2’-hydroxy-3’,5’-di-t-amylphenyl) benzotriazole (CASRN 25973-55-1), 2-(2H-benzotriazol-2-yl)-4,6-bis(1-methyl-1-phenylethyl) phenol (CASRN 70321-86-7). Washington, DC: U.S. Environmental Protection Agency, Office of Pollution Prevention and Toxics; 2009. [Accessed: July 28, 2023]. https://nepis.epa.gov/Exe/ZyPURL.cgi?Dockey=P1013BCS.txt
52. Organisation for Economic Co-operation and Development (OECD). Case study on the use of an integrated approach to testing and assessment for the repeated-dose toxicity of phenolic benzotriazoles. Paris, France: Organisation for Economic Co-operation and Development; 2017. ENV/JM/MONO(2017)23. [Accessed: July 5, 2023]. https://one.oecd.org/document/ENV/JM/MONO(2017)23/en/pdf
Monosubstituted Phenolic Benzotriazoles
Several studies in albino rats, Wistar rats, and beagle dogs exposed orally to drometrizole reported toxicity through body weight loss, increased liver weight, and increased liver enzymes in serum.50,59 One study in male and female Wistar rats exposed via diet to up to approximately 2,500 mg/kg/day of drometrizole for 90 days had increased relative liver and kidney weights.59,60 Additionally, at 2,500 mg/kg/day, female rats had increased relative spleen weights, whereas male rats had decreased testes weights.59,60 There was no evidence of drometrizole carcinogenicity in 2-year chronic feed studies in Tif:MAGf (SPF) mice at doses of up to 62 mg/kg/day in females and 64 mg/kg/day in males or in CFY rats up to 169 mg/kg/day in females and 142 mg/kg/day in males.59 Gestational exposure of ≤1,000 mg/kg/day of drometrizole in Sprague Dawley rats and in NMRI-derived albino mice from gestational day 6 to 15 resulted in no maternal toxicity or teratogenic effects.59
50. Schmid K, Schweizer W, Stäubli W, Waechter F. Studies of the effect of 2-(2′-hydroxy-5′-methylphenyl)benzotriazole on rat liver. Food Cosmet Toxicol. 1980; 18(3):245-252. DOI: 10.1016/0015-6264(80)90102-9 PubMed: 7419140
59. U.S. Environmental Protection Agency (USEPA). Screening-level hazard characterization: Sponsored chemicals: Phenolic benzotriazoles category: 2-(2’-hydroxy-5’-methylphenyl) benzotriazole (CASRN 2440-22-4), 2-(2’-hydroxy-5’-octylphenyl) benzotriazole (CASRN 3147-75-9), 2-(2’-hydroxy-3’,5’-di-t-amylphenyl) benzotriazole (CASRN 25973-55-1), 2-(2H-benzotriazol-2-yl)-4,6-bis(1-methyl-1-phenylethyl) phenol (CASRN 70321-86-7). Washington, DC: U.S. Environmental Protection Agency, Office of Pollution Prevention and Toxics; 2009. [Accessed: July 28, 2023]. https://nepis.epa.gov/Exe/ZyPURL.cgi?Dockey=P1013BCS.txt
59. U.S. Environmental Protection Agency (USEPA). Screening-level hazard characterization: Sponsored chemicals: Phenolic benzotriazoles category: 2-(2’-hydroxy-5’-methylphenyl) benzotriazole (CASRN 2440-22-4), 2-(2’-hydroxy-5’-octylphenyl) benzotriazole (CASRN 3147-75-9), 2-(2’-hydroxy-3’,5’-di-t-amylphenyl) benzotriazole (CASRN 25973-55-1), 2-(2H-benzotriazol-2-yl)-4,6-bis(1-methyl-1-phenylethyl) phenol (CASRN 70321-86-7). Washington, DC: U.S. Environmental Protection Agency, Office of Pollution Prevention and Toxics; 2009. [Accessed: July 28, 2023]. https://nepis.epa.gov/Exe/ZyPURL.cgi?Dockey=P1013BCS.txt
60. Central Institute for Nutrition Research (TNO). Initial submission: Sub-chronic feeding tests as to the toxicity of 2-(2H-benzotriazol-2-yl)-4-methylphenol in rats with cover letter dated 052092. Basel, Switzerland: Ciba-Geigy Corporation; 1992. TSCATS, Document 88-920002920. OTS0539880. [Accessed: August 7, 2023]. https://ntrl.ntis.gov/NTRL/dashboard/searchResults/titleDetail/OTS0539880.xhtml
59. U.S. Environmental Protection Agency (USEPA). Screening-level hazard characterization: Sponsored chemicals: Phenolic benzotriazoles category: 2-(2’-hydroxy-5’-methylphenyl) benzotriazole (CASRN 2440-22-4), 2-(2’-hydroxy-5’-octylphenyl) benzotriazole (CASRN 3147-75-9), 2-(2’-hydroxy-3’,5’-di-t-amylphenyl) benzotriazole (CASRN 25973-55-1), 2-(2H-benzotriazol-2-yl)-4,6-bis(1-methyl-1-phenylethyl) phenol (CASRN 70321-86-7). Washington, DC: U.S. Environmental Protection Agency, Office of Pollution Prevention and Toxics; 2009. [Accessed: July 28, 2023]. https://nepis.epa.gov/Exe/ZyPURL.cgi?Dockey=P1013BCS.txt
60. Central Institute for Nutrition Research (TNO). Initial submission: Sub-chronic feeding tests as to the toxicity of 2-(2H-benzotriazol-2-yl)-4-methylphenol in rats with cover letter dated 052092. Basel, Switzerland: Ciba-Geigy Corporation; 1992. TSCATS, Document 88-920002920. OTS0539880. [Accessed: August 7, 2023]. https://ntrl.ntis.gov/NTRL/dashboard/searchResults/titleDetail/OTS0539880.xhtml
59. U.S. Environmental Protection Agency (USEPA). Screening-level hazard characterization: Sponsored chemicals: Phenolic benzotriazoles category: 2-(2’-hydroxy-5’-methylphenyl) benzotriazole (CASRN 2440-22-4), 2-(2’-hydroxy-5’-octylphenyl) benzotriazole (CASRN 3147-75-9), 2-(2’-hydroxy-3’,5’-di-t-amylphenyl) benzotriazole (CASRN 25973-55-1), 2-(2H-benzotriazol-2-yl)-4,6-bis(1-methyl-1-phenylethyl) phenol (CASRN 70321-86-7). Washington, DC: U.S. Environmental Protection Agency, Office of Pollution Prevention and Toxics; 2009. [Accessed: July 28, 2023]. https://nepis.epa.gov/Exe/ZyPURL.cgi?Dockey=P1013BCS.txt
59. U.S. Environmental Protection Agency (USEPA). Screening-level hazard characterization: Sponsored chemicals: Phenolic benzotriazoles category: 2-(2’-hydroxy-5’-methylphenyl) benzotriazole (CASRN 2440-22-4), 2-(2’-hydroxy-5’-octylphenyl) benzotriazole (CASRN 3147-75-9), 2-(2’-hydroxy-3’,5’-di-t-amylphenyl) benzotriazole (CASRN 25973-55-1), 2-(2H-benzotriazol-2-yl)-4,6-bis(1-methyl-1-phenylethyl) phenol (CASRN 70321-86-7). Washington, DC: U.S. Environmental Protection Agency, Office of Pollution Prevention and Toxics; 2009. [Accessed: July 28, 2023]. https://nepis.epa.gov/Exe/ZyPURL.cgi?Dockey=P1013BCS.txt
While not a skin irritant, drometrizole application induced minimal irritation to the eye of rabbits and was classified as an extreme sensitizer in a skin sensitization study of albino guinea pigs.59,61 Drometrizole has been shown to induce contact sensitivity, such as allergic contact dermatitis from plastic products containing drometrizole, in humans62-64 and in mice65; however, there is no evidence of cross-sensitization to other phenolic benzotriazoles.66
59. U.S. Environmental Protection Agency (USEPA). Screening-level hazard characterization: Sponsored chemicals: Phenolic benzotriazoles category: 2-(2’-hydroxy-5’-methylphenyl) benzotriazole (CASRN 2440-22-4), 2-(2’-hydroxy-5’-octylphenyl) benzotriazole (CASRN 3147-75-9), 2-(2’-hydroxy-3’,5’-di-t-amylphenyl) benzotriazole (CASRN 25973-55-1), 2-(2H-benzotriazol-2-yl)-4,6-bis(1-methyl-1-phenylethyl) phenol (CASRN 70321-86-7). Washington, DC: U.S. Environmental Protection Agency, Office of Pollution Prevention and Toxics; 2009. [Accessed: July 28, 2023]. https://nepis.epa.gov/Exe/ZyPURL.cgi?Dockey=P1013BCS.txt
61. Ciba-Geigy. Initial submission: Skin sensitisation test in the Guinea pig maximization test (final report) with attachments and cover letter dated 032692. Basel, Switzerland: Ciba-Geigy Corporation; 1992. TSCATS, Document 88-920001579. OTS0535963. [Accessed: August 30, 2023]. https://ntrl.ntis.gov/NTRL/dashboard/searchResults/titleDetail/OTS0535963.xhtml
62. Hald M, Bergendorff O, Isaksson M, Johansen JD. Allergic contact dermatitis caused by plastic items containing the ultraviolet absorber drometrizole. Contact Dermatitis. 2018; 79(2):110-112. DOI: 10.1111/cod.13007 PubMed: 29761506
64. Tomar J, Jain VK, Aggarwal K, Dayal S, Gupta S. Contact allergies to cosmetics: Testing with 52 cosmetic ingredients and personal products. J Dermatol. 2005; 32(12):951-955. DOI: 10.1111/j.1346-8138.2005.tb00880.x PubMed: 16471456
65. Ikarashi Y, Tsuchiya T, Nakamura A. Contact sensitivity to Tinuvin P in mice. Contact Dermatitis. 1994; 30(4):226-230. DOI: 10.1111/j.1600-0536.1994.tb00649.x PubMed: 8033549
66. Ikarashi Y, Tsuchiya T, Nakamura A. Contact sensitivity of and cross-sensitivity between 2-(2′-hydroxy-5′-methylphenyl)benzotriazole (Tinuvin P) and 2-(2′-hydroxy-3′-tert-butyl-5′-methylphenyl)-5-chlorobenzotriazole (Tinuvin 326) evaluated by lymph node cell proliferation and ear swelling response in mice. Toxicol Lett. 1994; 71(2):151-159. DOI: 10.1016/0378-4274(94)90175-9 PubMed: 8171445
Disubstituted Phenolic Benzotriazoles
DitPe-BZT, when given orally, was reported to induce an increase in liver weight and altered liver histopathology in male and female Wistar rats at 100 mg/kg/day for 49 days67,68 and altered liver histopathology in beagle dogs at 15 mg/kg/day for 3 months.67,69 A subchronic study of male and female Tif:RAIf (SPF) rats given diMeEtPh-BZT in their diet for 3 months found an increase in liver weight with accompanying histopathological findings of hepatocyte hypertrophy and/or cytoplasmic vacuolization of hepatocytes at ≥300 ppm in females and ≥2,000 ppm in males.59 In a 28-day dietary study of diMeEtPh-BZT, significant increases in liver weights were found at exposures of ≥300 ppm (approximately 26 mg/kg/day) in female Tif:RAIf (SPF) rats.58 In several studies of various disubstituted phenolic benzotriazoles, it was apparent that male animals were significantly more susceptible than female animals to adverse effects (i.e., increased liver weight, hepatocyte hypertrophy, and increases in liver enzymes).70-76
67. Environment and Climate Change Canada (ECCC), Health Canada. Screening assessment report on phenol, 2-(2H-benzotriazol-2-yl)-4,6-bis(1,1-dimethylpropyl)- (BDTP). Chemical Abstracts Service Registry Number 25973-55-1. Gatineau, Quebec, Canada: Environment and Climate Change Canada; 2016. [Accessed: July 28, 2023]. https://www.ec.gc.ca/ese-ees/default.asp?lang=En&n=78FEE504-1
68. Central Institute for Nutrition Research (TNO). Short-term (49-day) and sub-chronic (90-day) toxicity studies with “RY 1137” in rats. In: Four toxicity studies on Tinuvin 328 (CAS No. 25973-55-1) with cover letter dated 091388. Basil, Switzerland: Ciba-Geigy Corporation; 1988. Study report 2640. TCATS, Document 88-880000056. OTS0516611. [Accessed: August 7, 2023]. https://ntrl.ntis.gov/NTRL/dashboard/searchResults/titleDetail/OTS0516611.xhtml
67. Environment and Climate Change Canada (ECCC), Health Canada. Screening assessment report on phenol, 2-(2H-benzotriazol-2-yl)-4,6-bis(1,1-dimethylpropyl)- (BDTP). Chemical Abstracts Service Registry Number 25973-55-1. Gatineau, Quebec, Canada: Environment and Climate Change Canada; 2016. [Accessed: July 28, 2023]. https://www.ec.gc.ca/ese-ees/default.asp?lang=En&n=78FEE504-1
69. Institut for Industrielle und Biologische Forschung (IIBF). Three-months toxicity study, Tinuvin 328, dietary administration - beagle dogs. In: Four toxicity studies on Tinuvin 328 (CAS No. 25973-55-1) with cover letter dated 091388. Basil, Switzerland: Ciba-Geigy Corporation; 1988. Study report A 0176/049. TCATS, Document 88-880000056. OTS0516611. [Accessed: August 7, 2023]. https://ntrl.ntis.gov/NTRL/dashboard/searchResults/titleDetail/OTS0516611.xhtml
59. U.S. Environmental Protection Agency (USEPA). Screening-level hazard characterization: Sponsored chemicals: Phenolic benzotriazoles category: 2-(2’-hydroxy-5’-methylphenyl) benzotriazole (CASRN 2440-22-4), 2-(2’-hydroxy-5’-octylphenyl) benzotriazole (CASRN 3147-75-9), 2-(2’-hydroxy-3’,5’-di-t-amylphenyl) benzotriazole (CASRN 25973-55-1), 2-(2H-benzotriazol-2-yl)-4,6-bis(1-methyl-1-phenylethyl) phenol (CASRN 70321-86-7). Washington, DC: U.S. Environmental Protection Agency, Office of Pollution Prevention and Toxics; 2009. [Accessed: July 28, 2023]. https://nepis.epa.gov/Exe/ZyPURL.cgi?Dockey=P1013BCS.txt
58. Environment and Climate Change Canada (ECCC). Health Canada. Draft screening assessment: Benzotriazoles and benzothiazoles group. Gatineau, Quebec, Canada: Environment and Climate Change Canada; 2021. [Accessed: July 28, 2023]. https://www.canada.ca/en/environment-climate-change/services/evaluating-existing-substances/draft-screening-assessment-benzotriazoles-benzothiazoles-group.html
70. Ema M, Fukunishi K, Hirose A, Hirata-Koizumi M, Matsumoto M, Kamata E. Repeated-dose and reproductive toxicity of the ultraviolet absorber 2-(3′,5′-di-tert-butyl-2′-hydroxyphenyl)-5-chlorobenzotriazole in rats. Drug Chem Toxicol. 2008; 31(3):399-412. DOI: 10.1080/01480540802171282 PubMed: 18622873
76. Hirata-Koizumi M, Watari N, Mukai D, Imai T, Hirose A, Kamata E, Ema M. A 28-day repeated dose toxicity study of ultraviolet absorber 2-(2′-hydroxy-3′,5′-di-tert-butylphenyl) benzotriazole in rats. Drug Chem Toxicol. 2007; 30(4):327-341. DOI: 10.1080/01480540701522254 PubMed: 17934922
Trisubstituted Phenolic Benzotriazoles
A review of toxicity studies related to bumetrizole is described in an OECD screening information data set (SIDS) Initial Assessment Report (SIAR) document.77 In the reported studies in rodents and dogs, the only finding was a slight increase in liver weight in some studies, with no other test-article-related toxicities. Bumetrizole exhibited no reproductive or developmental effects at doses up to 1,000 mg/kg/day for several rodent studies. Male and female Crj:CD(SD)IGS rats exposed to ditBuCl-BZT for 28 days before mating followed by continued exposure during gestation showed no effects on reproductive or developmental parameters. However, male rats in the study developed significant increases in liver weights and serum albumin at 25 mg/kg/day, with no related organ histopathological findings.70
77. Organisation for Economic Co-operation and Development (OECD). SIDS initial assessment report for SIAM 28: 2-tert-Butyl-6-(5-chloro-2H-benzotriazol-2-yl)-4-methylphenol. Paris, France: Organisation for Economic Co-operation and Development; 2009.
70. Ema M, Fukunishi K, Hirose A, Hirata-Koizumi M, Matsumoto M, Kamata E. Repeated-dose and reproductive toxicity of the ultraviolet absorber 2-(3′,5′-di-tert-butyl-2′-hydroxyphenyl)-5-chlorobenzotriazole in rats. Drug Chem Toxicol. 2008; 31(3):399-412. DOI: 10.1080/01480540802171282 PubMed: 18622873
Humans
The literature contains no studies on the toxicity of phenolic benzotriazoles in humans.
Genetic Toxicity
The literature contains no studies on the genetic toxicity of the un-, mono-, di-, or trisubstituted phenolic benzotriazoles evaluated in this Toxicity Report.
Study Rationale
The phenolic benzotriazole class was selected for toxicological testing based on its high production volume, widespread use, and potential occupational and general public exposure. A class assessment was conducted to compare toxicities across individual chemicals for which varying toxicological data were available. The chemicals selected for study were chosen based on procurement availability and high production volume at the time of project initiation to represent the differing substitution categories of un-, mono-, di-, and trisubstituted phenolic benzotriazoles. Because of observed sensitivity in male rats as stated above, only male rats were used to examine the class effects of phenolic benzotriazole exposure. The 2-week gavage study design was used to compare the short-term toxicity of the nine phenolic benzotriazoles.
Materials and Methods
Procurement and Characterization
Phenolic Benzotriazoles
2-(2H-benzotriazol-2-yl)phenol (P-BZT) was obtained from Richman Chemical (Lower Gwynedd, PA) in a single lot (373PAL021), and a portion was sieved, oven-dried to remove water, and assigned a new lot number (09042015) to use as the test article. 3-(2H-benzotriazol-2-yl)-5-(1,1-dimethylethyl)-4-hydroxybenzenepropanoic acid, octyl ester (tBuPrOcEst-BZT) was also obtained from Richman Chemical in a single lot (354PAL67). Lot 354PAL67 was melted in the original containers in a water bath, dried in a vacuum oven, stored in a large high-density polyethylene container, and then assigned a new lot number (09022015). 2-(2H-benzotriazol-2-yl)-4-tert-butylphenol (tBu-BZT) was obtained from TCI America (Portland, OR) in a single lot (lot IDRWA). Single lots of 2-(2H-benzotriazol-2-yl)-4-methylphenol (drometrizole; lot 120935), 2-(2H-benzotriazol-2-yl)-4-(1,1,3,3-tetramethylbutyl)phenol (octrizole; lot 120932), 2-(2H-benzotriazol-2-yl)-4,6-bis(1,1-dimethylpropyl)phenol (ditPe-BZT; lot 120933), 2-(2H-benzotriazol-2-yl)-4,6-bis(1-methyl-1-phenylethyl)phenol (diMeEtPh-BZT; lot 120934), 2-(5-chloro-2H-1,2,3-benzotriazol-2-yl)-6-(1,1-dimethylethyl)-4-methylphenol (bumetrizole; lot 120936), and 2-(5-chloro-2H-benzotriazol-2-yl)-4,6-bis(1,1-dimethylethyl)phenol (ditBuCl-BZT; lot 120937) were obtained from Gojira Fine Chemicals, LLC (Bedford Heights, OH).
Identity, purity, and stability analyses were conducted by the analytical chemistry laboratory at Battelle (Columbus, OH; Appendix A). Reports on analyses performed in support of the phenolic benzotriazoles studies are on file at the National Institute of Environmental Health Sciences (NIEHS).
The identities of lot 09042015 (P-BZT), a tan powder; lot 120935 (drometrizole), a light yellow powder; lot IDRWA (tBu-BZT), a white to pale yellow crystal powder; lot 120932 (octrizole), a white to off-white powder; lot 120933 (ditPe-BZT), a light yellow powder; lot 120934 (diMeEtPh-BZT), a light yellow to off-white powder; lot 09022015 (tBuPrOcEst-BZT), an off-white solid; lot 120936 (bumetrizole), a light yellow powder; and lot 120937 (ditBuCl-BZT), a light yellow powder, were confirmed using Fourier transform infrared (FTIR), 1H nuclear magnetic resonance (NMR), and 13C NMR spectroscopy. In addition, elemental analysis was performed by Galbraith Laboratories, Inc. (Knoxville, TN) to confirm the identity of each compound. Log P of seven test chemicals (drometrizole, tBu-BZT, octrizole, ditPe-BZT, diMeEtPh-BZT, bumetrizole, and ditBuCl-BZT) was determined by high-performance liquid chromatography (HPLC) with ultraviolet (UV) detection (Table A-1).
The purity of each phenolic benzotriazole was determined using HPLC with UV and/or charged aerosol detection (CAD) (Table A-1) and gas chromatography (GC) with flame ionization detection (FID) (Table A-2).
The purity results are summarized in Table 2. GC with mass selective detection (MSD) was additionally used to aid in the measurement and identification of impurities for octrizole and tBuPrOcEst-BZT, whereas HPLC with mass spectrometry (MS) was used to aid impurity identification in the octrizole test article. For octrizole, both HPLC/MS and GC/MSD identified a single impurity with mass spectra indicative of an isomer of octrizole (1.6% by HPLC/CAD purity analysis). For tBuPrOcEst-BZT, GC/MSD in conjunction with 1H NMR identified 3-(2H-benzotriazol-2-yl)-5-(1,1-dimethylethyl)-4-hydroxybenzenepropanoic acid, ethyl ester as the greatest of four impurities over 0.1% (1.5% by GC/FID purity analysis). No other nonvolatile impurities in the test articles were identified.
Bulk stability studies were also conducted on each chemical at frozen (−20°C), refrigerated (5°C), room (25°C), and elevated (60°C) temperatures for 2 weeks. The chemical homogenization process, storage conditions, and analytical methods and systems used for each respective lot are described in detail in Appendix A.
Methylcellulose
Methylcellulose used to make the 0.5% aqueous vehicle for gavage formulations was obtained from Spectrum Chemical Manufacturing Corporation (New Brunswick, NJ) in one lot (2DH0326). Deionized water was used as the solvent.
The identity of the methylcellulose was confirmed by the analytical chemistry laboratory using FTIR spectroscopy. Methoxy content was initially confirmed (31.0%) by Galbraith Laboratories, Inc. Prior to starting the phenolic benzotriazoles studies, additional methoxy content analysis was performed (32.1%) by Whitehouse Laboratories (Readington, NJ).
Preparation and Analysis of Dose Formulations
The dose formulations of each chemical (P-BZT, drometrizole, tBu-BZT, octrizole, ditPe-BZT, diMeEtPh-BZT, tBuPrOcEst-BZT, bumetrizole, or ditBuCl-BZT) were prepared once in 0.5% aqueous methylcellulose to give the required concentrations (Table 3). Homogeneity was confirmed for all chemicals at the highest dose formulation and the dose formulation approximately 10-fold lower than the lowest dose formulation used in the studies. Homogeneity was confirmed for two additional concentrations of tBuPrOcEst-BZT within the dosing concentration range. Stability studies were completed for representative formulations of each phenolic benzotriazole and are described in Appendix A.
The storage stability of the P-BZT, drometrizole, tBu-BZT, octrizole, ditPe-BZT, diMeEtPh-BZT, bumetrizole, and ditBuCl-BZT formulations was confirmed for 42 days at both refrigerated (5°C) and room (25°C) temperatures while protected from light for all 0.5 mg/mL dose formulations. Stability of tBuPrOcEst-BZT was confirmed at 0.5 mg/mL at room temperature and 5 mg/mL at both refrigerated and room temperatures while protected from light but required heating and mixing to resuspend the formulation prior to sampling. Additionally, formulations of P-BZT, drometrizole, tBu-BZT, octrizole, ditPe-BZT, diMeEtPh-BZT, bumetrizole, and ditBuCl-BZT were stable under simulated animal room conditions for at least 3 hours, whereas tBuPrOcEst-BZT was stable for 1.5 hours when heated and mixed first. All dose formulations were stored protected from light at either room temperature or refrigerated temperature (5°C) for up to 15 days until shipment to the study laboratory (Battelle, West Jefferson, OH). At the study laboratory, all dose formulations were stored protected from light at room temperature and used within 35 days from the mix date.
Analyses of preadministration and postadministration dose formulations were conducted by the analytical chemistry laboratory using HPLC/UV (Table A-1). All preadministration samples were within 10% of the target concentrations (Table A-4 through Table A-12). All postadministration samples were within 10% of the target concentrations, except for tBuPrOcEst-BZT, for which the 20, 60, and 200 mg/mL results were 10.7%, 10.6%, and 10.8% above the target concentrations, respectively.
Animal Source
Male Sprague Dawley (Hsd:Sprague Dawley SD) rats were obtained from Inotiv (formerly Envigo, Indianapolis, IN).
Animal Welfare
Animal care and use were in accordance with the Public Health Service Policy on Humane Care and Use of Animals. All animal studies were conducted in an animal facility accredited by AAALAC International. Studies were approved by the Battelle (Columbus, OH) Animal Care and Use Committee and conducted in accordance with all relevant National Institutes of Health and National Toxicology Program (NTP) animal care and use policies and applicable federal, state, and local regulations and guidelines.
Dose Selection Rationale
A high dose of 1,000 mg chemical/kg body weight/day (mg/kg/day) was selected based on literature suggesting it would be tolerable across the chemicals and generally accepted as a limit dose for guideline studies.78 Three half log doses of 300, 100, and 30 mg/kg/day were selected to evaluate dose response across the chemicals.
78. Organisation for Economic Co-operation and Development (OECD). Test no. 407: Repeated dose 28-day oral toxicity study in rodents. OECD guidelines for the testing of chemicals, section 4. Paris, France: OECD Publishing; 2008. 10.1787/9789264070684-en
Two-week Studies
Study Design
Rats were approximately 6 to 8 weeks old on receipt. They were quarantined for 12 days and were approximately 10 weeks old on the first day of the studies. Rats were randomly assigned to one of five dose groups per chemical. Randomization was stratified by body weight that produced similar group mean weights using NTP Provantis software (Instem, Stone, UK).
Before the studies began, 10 male rats were randomly selected for parasite evaluation and gross observation for evidence of disease. Additionally, the health of the animals was monitored during the studies according to the protocols of the NTP Sentinel Animal Program (Appendix C). All test results were negative.
For each of the nine phenolic benzotriazoles, groups of five male rats were administered 0, 30, 100, 300, or 1,000 mg/kg/day in 0.5% aqueous methylcellulose by gavage for 14 consecutive days. Vehicle control animals were administered the 0.5% aqueous methylcellulose vehicle alone; dosing volumes were 5 mL/kg. Feed and water were available ad libitum. Rats were housed up to five per cage. They were observed twice daily for signs of mortality or moribundity. Clinical observations were recorded daily, approximately 1 hour after dose administration, and at study termination; body weights were recorded initially, twice weekly, and at study termination. Details of the study design and animal maintenance are summarized in Table 3. Information on feed composition and contaminants is provided in Appendix B.
Clinical Examinations and Pathology
Blood was collected from the retroorbital plexus of all animals at the end of the 2-week studies for hematology, clinical chemistry, and internal concentration assessment. Animals were anesthetized with a carbon dioxide/oxygen mixture and bled in a random order. Blood was collected into tubes containing tripotassium ethylenediaminetetraacetic acid (K3 EDTA) for hematology and internal concentration assessment or into serum collection tubes without anticoagulant for clinical chemistry. Hematology parameters were analyzed using an Advia 120 hematology analyzer (Bayer Diagnostics Division, Tarrytown, NY). Clinical chemistry parameters were analyzed using the Roche cobas c501 Chemistry Analyzer (Roche, Indianapolis, IN). Plasma concentrations were measured using a validated analytical method.79 The parameters measured are listed in Table 3.
79. Mutlu E, South N, Pierfelice J, Djonabaye A, Pauff M, Burback B, Waidyanatha S. Quantitation of phenolic benzotriazole class compounds in plasma by liquid chromatography-tandem mass spectrometry (LC-MS/MS). Anal Lett. 2022; 55(13):2074-2088. DOI: 10.1080/00032719.2022.2044348 PubMed: 36147651
Necropsies were performed on all animals. Organ weights were determined for the adrenal glands (paired), left and right epididymis, heart, left and right kidney, liver, lungs, left and right testis, and thymus from all rats. Tissues for microscopic examination were fixed and preserved in 10% neutral buffered formalin (except eyes, which were first fixed in Davidson’s solution, and testes, epididymides, and vaginal tunics, which were first fixed in modified Davidson’s solution), processed and trimmed, embedded in paraffin, sectioned to a thickness of 4 to 6 μm, and stained with hematoxylin and eosin. Histopathological examinations of selected organs were performed by the board-certified veterinary pathologist (study pathologist) on all rats. Table 3 lists the tissues and organs examined.
Microscopic evaluations were completed by the board-certified veterinary pathologist, and the pathology data were entered into the NTP Provantis software (Instem Stone, UK). The report, slides, paraffin blocks, residual wet tissues, and pathology data were sent to the NTP Archives for inventory and storage. An audit of pathology specimens was conducted wherein the wet tissues, blocks, and slides were examined for quality and adherence to the NTP Specifications (published in 2011)80 by technical staff, and the wet tissues were examined by a team of pathologists to ensure all were sampled according to NTP Specifications. The slide and tissue counts were also verified. Slide-mounted, H&E-stained slides were evaluated for accuracy and consistency of diagnoses by a team of quality assessment (QA) pathologists at a pathology laboratory independent of the study laboratory. The histotechnique was also evaluated.
80. National Toxicology Program (NTP). Specifications for the conduct of studies to evaluate the toxic and carcinogenic potential of chemical, biological and physical agents in laboratory animals for the National Toxicology Program (NTP). Research Triangle Park, NC: U.S. Department of Health and Human Services, Public Health Service, National Institutes of Health, National Toxicology Program; 2011.
After a review of the laboratory reports and selected histopathology slides by a QA pathologist, the findings and reviewed slides were submitted to the Pathology Working Group (PWG) coordinator for a second independent review. Any inconsistencies in the diagnoses made by the study laboratory and QA pathologists were resolved by the Division of Translational Toxicology (DTT) pathology peer-review process. The study pathologist and QA pathologist read the slides in an informed manner (i.e., with knowledge of the animal numbers and their respective dose groups), whereas the PWG members reviewed the slides in a blinded fashion (with no knowledge of dose groups). The rationale for this approach is presented in Sills et al.81 Final diagnoses for reviewed lesions represent a consensus of the PWG or a consensus between the study laboratory pathologist, DTT pathologist, QA pathologist(s), and PWG coordinator. Details of these review procedures have been described, in part, by Maronpot and Boorman,82 Boorman et al.,83 and Sills et al.81
81. Sills RC, Cesta MF, Willson CJ, Brix AE, Berridge BR. National Toxicology Program position statement on informed (“nonblinded”) analysis in toxicologic pathology evaluation. Toxicol Pathol. 2019; 47(7):887-890. DOI: 10.1177/0192623319873974 PubMed: 31522628
82. Maronpot RR, Boorman GA. Interpretation of rodent hepatocellular proliferative alterations and hepatocellular tumors in chemical safety assessment. Toxicol Pathol. 1982; 10(2):71-78. DOI: 10.1177/019262338201000210 PubMed: 28094716
83. Boorman GA, Haseman JK, Waters MD, Hardisty JF, Sills RC. Quality review procedures necessary for rodent pathology databases and toxicogenomic studies: The National Toxicology Program experience. Toxicol Pathol. 2002; 30(1):88-92. DOI: 10.1080/01926230252824752 PubMed: 11890481
81. Sills RC, Cesta MF, Willson CJ, Brix AE, Berridge BR. National Toxicology Program position statement on informed (“nonblinded”) analysis in toxicologic pathology evaluation. Toxicol Pathol. 2019; 47(7):887-890. DOI: 10.1177/0192623319873974 PubMed: 31522628
Gene Expression Analysis
Within 5 minutes of euthanasia, approximately 250 mg of tissue was collected from the left liver lobe and right kidney of all surviving rats. Tissue samples were cut into smaller pieces (~5 mm3), placed in RNAlaterTM (Ambion, Inc., Austin, TX), and stored at 2°C to 8°C overnight. The RNAlater was then removed, and the samples were stored in a −70°C ± 10°C freezer until processed for RNA isolation.
RNA isolation was performed on tissue samples preserved in RNAlater for reverse transcription-polymerase chain reaction (RT-PCR or qPCR) analysis. Tissue samples weighing between 22 and 30 mg were added to lysis buffer, homogenized, and stored at −70°C ± 10°C. RNA was extracted from the supernatant, subjected to DNase digestion, and isolated using the Qiagen RNeasy Mini Kit (Qiagen, Valencia, CA). Each RNA sample was analyzed for quantity and purity by UV analysis using a NanoDrop ND-1000 Spectrophotometer (NanoDrop Products; Thermo Scientific, Wilmington, DE). All RNA samples were evaluated for RNA integrity using an Agilent RNA 6000 Nano Chip Kit with an Agilent 2100 Bioanalyzer (Agilent Technologies, Santa Clara, CA) and stored at −70°C ± 10°C until further processing.
Total liver RNA (1 μg), isolated from 224 rat liver samples, and total kidney RNA (0.5 µg), from 219 rat kidney samples, were reverse transcribed into cDNA using Qiagen RT2 HT First Strand Kits (Qiagen, Valencia, CA). The cDNA samples were analyzed using Qiagen RT2 Custom PCR Arrays in a 96-well plate format. Six liver samples or 16 kidney samples were run on each array plate. RT-PCR analysis was conducted for 10 genes of interest in the liver: acyl-CoA thioesterase 1 (Acot1), acyl-coenzyme A oxidase 1 (Acox1), cyclin G1 (Ccng1), cyclin-dependent kinase inhibitor 1A (Cdkn1a), cytochrome P450 1b1 (Cyp1b1), cytochrome P450 2b1 (Cyp2b1), cytochrome P450 3a23 (Cyp3a23/3a1), cytochrome P450 4a1 (Cyp4a1), glutathione S-transferase mu 3 (Gstm3), and NAD(P)H dehydrogenase quinone 1 (Nqo1). RT-PCR analysis was also conducted for one gene of interest in the kidney, Hepatitis A virus cellular receptor 1 (Havcr1; also known as kidney injury molecule 1 or Kim-1). The liver genes were selected as potential markers of hepatotoxicity because of their involvement in hepatic detoxification processes, such as fatty acid metabolism. The kidney gene Havcr1 has been suggested as a biomarker for nephrotoxic compounds and is upregulated in the kidney after ischemic or toxic injury.84 An increase in expression of Havcr1 is recognized as a marker of acute kidney injury.85 The array plates included the respective genes of interest; two housekeeping genes, glyceraldehyde-3-phosphate dehydrogenase (Gapdh) and beta actin (Actb); and three array plate quality controls. The parameters measured are listed in Table 3.
2. National Toxicology Program (NTP). Chemical information review document for phenolic benzotriazoles: Supporting nomination for toxicological evaluation by the National Toxicology Program. Research Triangle Park, NC: U.S. Department of Health and Human Services, National Institutes of Health, National Institute of Environmental Health Sciences, National Toxicology Program; 2011.
2. National Toxicology Program (NTP). Chemical information review document for phenolic benzotriazoles: Supporting nomination for toxicological evaluation by the National Toxicology Program. Research Triangle Park, NC: U.S. Department of Health and Human Services, National Institutes of Health, National Institute of Environmental Health Sciences, National Toxicology Program; 2011.
84. Zhou Y, Vaidya VS, Brown RP, Zhang J, Rosenzweig BA, Thompson KL, Miller TJ, Bonventre JV, Goering PL. Comparison of kidney injury molecule-1 and other nephrotoxicity biomarkers in urine and kidney following acute exposure to gentamicin, mercury, and chromium. Toxicol Sci. 2008; 101(1):159-170. DOI: 10.1093/toxsci/kfm260 PubMed: 17934191
85. Song J, Yu J, Prayogo GW, Cao W, Wu Y, Jia Z, Zhang A. Understanding kidney injury molecule 1: A novel immune factor in kidney pathophysiology. Am J Transl Res. 2019; 11(3):1219-1229. PubMed: 30972157
Quality control (QC) measurements for each sample on each qPCR array plate were evaluated to determine whether the data generated from the sample were of sufficient quality prior to analysis. The controls on the qPCR array were analyzed for each sample and included a PCR positive/array reproducibility control (PPC), a reverse transcription control (RTC), and a genomic DNA contamination (GDC) control. A sample successfully passed all of these control parameters when the cycle threshold (Ct) value for the PPC was 20 ± 2, the Ct value for the GDC was ≥35, and the Ct value of the PPC subtracted from the Ct value of the RTC was ≤5. If a sample failed the acceptance criteria for the GDC and/or RTC controls, the sample was repeated starting with the reverse transcription (cDNA synthesis) process followed by analysis on a new qPCR array plate. If a sample failed the PPC control, the cDNA sample was used to repeat the sample on a new qPCR array plate. Once all of the data from a single experiment were analyzed and collected (control animals and all doses for a single phenolic benzotriazole), the QC data were assessed a second time after the total experimental data were uploaded into the web-based RT2 Profiler PCR Array Data Analysis software (version 3.5, SABiosciences, Valencia, CA), providing additional assurance that the data for the entire experiment passed the QC criteria.
2. National Toxicology Program (NTP). Chemical information review document for phenolic benzotriazoles: Supporting nomination for toxicological evaluation by the National Toxicology Program. Research Triangle Park, NC: U.S. Department of Health and Human Services, National Institutes of Health, National Institute of Environmental Health Sciences, National Toxicology Program; 2011.
Statistical Methods
Statistical methods were chosen based on distributional assumptions. Unless specifically mentioned, all endpoints were tested for a trend across dose groups, followed by pairwise tests for each dosed group against the control group. Significance of all trend and pairwise tests is determined by a p value of ≤0.05 and is reported at both 0.05 and 0.01 levels.
Calculation and Analysis of Nonneoplastic Lesion Incidences
The incidences of nonneoplastic lesions are presented as numbers of animals bearing such lesions at a specific anatomic site and the numbers of animals with that site examined microscopically. Fisher’s exact test,86 a procedure that uses the overall proportion of affected animals, was used to determine statistical significance between dosed and vehicle control animals, and the Cochran-Armitage trend test was used to test for significant trends.87
86. Gart JJ, Chu KC, Tarone RE. Statistical issues in interpretation of chronic bioassay tests for carcinogenicity. J Natl Cancer Inst. 1979; 62(4):957-974. https://doi.org/10.1093/jnci/62.4.957. PubMed: 285297
87. Armitage P. Statistical methods in medical research. Oxford, UK: Blackwell Scientific; 1971.
Analysis of Continuous Variables
Two approaches were employed to assess the significance of pairwise comparisons between dosed and control groups in the analysis of continuous variables. Organ and body weight data, which historically have approximately normal distributions, were analyzed with the parametric multiple comparison procedures of Dunnett88 and Williams.89,90 Hematology and clinical chemistry data, which have typically skewed distributions, were analyzed using the nonparametric multiple comparison methods of Shirley91 (as modified by Williams92) and Dunn.93 The Jonckheere test94 was used to assess the significance of the dose-related trends and to determine whether a trend-sensitive test (the Williams or Shirley test) was more appropriate for pairwise comparisons than a test that does not assume a monotonic dose-related trend (the Dunnett or Dunn test). Before statistical analysis, outliers identified using the Dixon and Massey test95 were examined by DTT personnel, and biologically implausible values (likely resulting from experimental error) were eliminated from the analysis. For plasma concentration data, when individual concentration values were provided as “below limit of detection,” one-half the limit of detection (LOD) was used as a substitute value. However, if 80% or more of the values in the control group were below the LOD, the mean was reported as “BD” to indicate the values were “below detection” and no statistical analysis was performed on the endpoint. In some cases when the LOD could not be determined, the same rules were applied using the limit of quantitation (LOQ) in place of the LOD.
88. Dunnett CW. A multiple comparison procedure for comparing several treatments with a control. J Am Stat Assoc. 1955; 50(272):1096-1121. DOI: 10.1080/01621459.1955.10501294
89. Williams DA. A test for differences between treatment means when several dose levels are compared with a zero dose control. Biometrics. 1971; 27(1):103-117. DOI: 10.2307/2528930 PubMed: 5547548
90. Williams DA. The comparison of several dose levels with a zero dose control. Biometrics. 1972; 28(2):519-531. DOI: 10.2307/2556164 PubMed: 5037867
91. Shirley E. A non-parametric equivalent of Williams’ test for contrasting increasing dose levels of a treatment. Biometrics. 1977; 33(2):386-389. DOI: 10.2307/2529789 PubMed: 884197
92. Williams DA. A note on Shirley’s nonparametric test for comparing several dose levels with a zero-dose control. Biometrics. 1986; 42(1):183-186. DOI: 10.2307/2531254 PubMed: 3719054
93. Dunn OJ. Multiple comparisons using rank sums. Technometrics. 1964; 6(3):241-252. DOI: 10.1080/00401706.1964.10490181
94. Jonckheere AR. A distribution-free k-sample test against ordered alternatives. Biometrika. 1954; 41(1-2):133-145. DOI: 10.1093/biomet/41.1-2.133
95. Dixon WJ, Massey FJ. Introduction to statistical analysis. 2nd ed. New York, NY: McGraw-Hill; 1957.
Gene Expression Analysis
Gene expression values were calculated from the base-signal values using the 2(-Delta Delta C(T)) method,96 with Gapdh as the reference housekeeping gene. Gene expression values were then analyzed using the nonparametric multiple comparison methods described above. Outliers identified using the Dixon and Massey test95 were examined by DTT personnel, and implausible values were eliminated from the analysis.
96. Livak KJ, Schmittgen TD. Analysis of relative gene expression data using real-time quantitative PCR and the 2(-delta delta C(T)) method. Methods. 2001; 25(4):402-408. DOI: 10.1006/meth.2001.1262 PubMed: 11846609
95. Dixon WJ, Massey FJ. Introduction to statistical analysis. 2nd ed. New York, NY: McGraw-Hill; 1957.
Quality Assurance Methods
The 2-week studies were conducted in compliance with U.S. Food and Drug Administration Good Laboratory Practice Regulations.97 In addition, the 2-week study reports were audited retrospectively by an independent QA contractor against study records submitted to the NTP Archives. Separate audits covered completeness and accuracy of the pathology data, pathology specimens, final pathology tables, and a draft of this NTP Toxicity Report. Audit procedures and findings are presented in the reports and are on file at NIEHS. The audit findings were reviewed and assessed by DTT staff, and all comments were resolved or otherwise addressed during the preparation of this report.
97. U.S. Food and Drug Administration (FDA). 21 CFR Part 58. https://www.ecfr.gov/current/title-21/chapter-I/subchapter-A/part-58
Genetic Toxicology
The genetic toxicity of phenolic benzotriazoles was assessed by testing whether these chemicals increased the frequency of micronucleated erythrocytes in rat peripheral blood. The protocol for these studies and the results are given in Appendix D.
The genetic toxicity studies have evolved from an earlier effort to develop a comprehensive database permitting a critical anticipation of a chemical’s carcinogenicity in experimental animals based on numerous considerations, including the relationship between the molecular structure of the chemical and its observed effects in short-term in vitro and in vivo genetic toxicity tests (structure-activity relationships). The short-term tests were developed originally to clarify proposed mechanisms of chemical-induced DNA damage, given the relationship between electrophilicity and mutagenicity,98 and the somatic mutation theory of cancer.99,100 Not all cancers, however, arise through genotoxic mechanisms.
98. Miller JA, Miller EC. Ultimate chemical carcinogens as reactive mutagenic electrophiles. In: Hiatt HH, Watson JD, Winsten JA, editors. Origins of Human Cancer. Cold Spring Harbor, NY: Cold Spring Harbor Laboratory; 1977. p. 605–627.
99. Straus DS. Somatic mutation, cellular differentiation, and cancer causation. J Natl Cancer Inst. 1981; 67(2):233-241. DOI: https://doi.org/10.1093/jnci/67.2.233 PubMed: 7021938
100. Crawford BD. Perspectives on the somatic mutation model of carcinogenesis. In: Flamm WG, Lorentzen RJ, editors. Mechanisms and Toxicity of Chemical Carcinogens and Mutagens. Princeton, NJ: Princeton Scientific Publishing; 1985. p. 13–59.
Peripheral Blood Micronucleus Test
Micronuclei (literally “small nuclei” or Howell-Jolly bodies) are biomarkers of induced structural or numerical chromosomal alterations and are formed when acentric fragments or whole chromosomes fail to incorporate into either of two daughter nuclei during cell division.101,102 Acute in vivo bone marrow chromosome aberration and micronucleus tests appear to be less predictive of carcinogenicity than the Ames test.103,104 However, clearly positive results in long-term peripheral blood micronucleus tests have high predictivity for rodent carcinogenicity; a weak response in one sex only or negative results in both sexes in this assay do not correlate well with either negative or positive results in rodent carcinogenicity studies.105 Because of the theoretical and observed associations between induced genetic damage and adverse effects in somatic and germ cells, determination of in vivo genetic effects is important to overall understanding of risks associated with exposure to a particular chemical.
101. Schmid W. The micronucleus test. Mutat Res. 1975; 31(1):9-15. DOI: 10.1016/0165-1161(75)90058-8 PubMed: 48190
102. Heddle JA, Hite M, Kirkhart B, Mavournin K, MacGregor JT, Newell GW, Salamone MF. The induction of micronuclei as a measure of genotoxicity: A report of the U.S. Environmental Protection Agency Gene-Tox Program. Mutat Res. 1983; 123(1):61-118. DOI: 10.1016/0165-1110(83)90047-7 PubMed: 6888413
103. Shelby MD, Erexson GL, Hook GJ, Tice RR. Evaluation of a three-exposure mouse bone marrow micronucleus protocol: Results with 49 chemicals. Environ Mol Mutagen. 1993; 21(2):160-179. DOI: 10.1002/em.2850210210 PubMed: 8444144
104. Shelby MD, Witt KL. Comparison of results from mouse bone marrow chromosome aberration and micronucleus tests. Environ Mol Mutagen. 1995; 25(4):302-313. DOI: 10.1002/em.2850250407 PubMed: 7607185
105. Witt KL, Knapton A, Wehr CM, Hook GJ, Mirsalis J, Shelby MD, MacGregor JT. Micronucleated erythrocyte frequency in peripheral blood of B6C3F(1) mice from short-term, prechronic, and chronic studies of the NTP carcinogenesis bioassay program. Environ Mol Mutagen. 2000; 36(3):163-194. 10.1002/1098-2280(2000)36:3<163::AID-EM1>3.0.CO;2-P
Results
Data Availability
All study data were evaluated. Data relevant for evaluating toxicological findings are presented here. All study data are available in the National Toxicology Program (NTP) Chemical Effects in Biological Systems (CEBS) database: https://doi.org/10.22427/NTP-DATA-TOX-108.106
106. National Toxicology Program (NTP). TOX-108: Pathology tables, survival and growth curves from NTP short-term, genetic toxicology studies. Research Triangle Park, NC: U.S. Department of Health and Human Services, Public Health Service, National Toxicology Program; 2025. 10.22427/NTP-DATA-TOX-108
Two-week Studies
Survival and Clinical Observations
There were no dose-related effects on survival for any of the nine phenolic benzotriazoles at all doses. The nine phenolic benzotriazoles tested were:
Unsubstituted
2-(2H-benzotriazol-2-yl)phenol (P-BZT)
Monosubstituted
2-(2H-benzotriazol-2-yl)-4-methylphenol (drometrizole)
2-(2H-benzotriazol-2-yl)-4-tert-butylphenol (tBu-BZT)
2-(2H-benzotriazol-2-yl)-4-(1,1,3,3-tetramethylbutyl)phenol (octrizole)
Disubstituted
2-(2H-benzotriazol-2-yl)-4,6-bis(1,1-dimethylpropyl)phenol (ditPe-BZT)
2-(2H-benzotriazol-2-yl)-4,6-bis(1-methyl-1-phenylethyl)phenol (diMeEtPh-BZT)
3-(2H-benzotriazol-2-yl)-5-(1,1-dimethylethyl)-4-hydroxybenzenepropanoic acid, octyl ester (tBuPrOcEst-BZT)
Trisubstituted
2-(5-chloro-2H-1,2,3-benzotriazol-2-yl)-6-(1,1-dimethylethyl)-4-methylphenol (bumetrizole)
2-(5-chloro-2H-benzotriazol-2-yl)-4,6-bis(1,1-dimethylethyl)phenol (ditBuCl-BZT)
In rats administered the trisubstituted bumetrizole, one rat in the 300 mg/kg/day group was humanely euthanized on study day 8 because of morbidities related to a gavage accident. Upon histopathological examination, trauma associated with a perforation of the esophagus wall was found in this animal. Red nasal discharge was observed in at least one dose group for all chemicals, with the highest incidence occurring in the 1,000 mg/kg/day group for all chemicals except bumetrizole (Table 4). In rats administered 1,000 mg/kg/day tBuPrOcEst-BZT, a disubstituted phenolic benzotriazole, one rat was hunched, two rats were lethargic, three rats were observed with red eye discharge, four rats were observed with ruffled coats, and all five rats were dehydrated and thin in addition to having the red nasal discharge (Appendix F).
Body Weights
For all chemicals, except for the disubstituted tBuPrOcEst-BZT, the body weights of dosed animals were within 10% of the control animals and did not reach statistical significance throughout dosing (Appendix F). On study day 14, body weights showed a negative trend and were significantly decreased by 12.3% and 33.2% in the 300 and 1,000 mg/kg/day groups, respectively, for tBuPrOcEst-BZT compared to the control animals, with decreases in the 1,000 mg/kg/day group beginning on study day 4 (Table 5; Figure 2). Decreases in body weight gain were also noted, with significant trend and pairwise comparisons for the 300 and 1,000 mg/kg/day tBuPrOcEst-BZT groups. In rats administered ditPe-BZT, another disubstituted phenolic benzotriazole, a decrease in body weight gain over the 2-week dosing period was significant for both trend and pairwise statistical tests in the 1,000 mg/kg/day group, which gained only 3.6 g compared to 21.9 g in the control animals (Appendix F).
Organ Weights
Dose-related significant increases in absolute and/or relative liver weights were observed at various doses in animals administered seven of the nine phenolic benzotriazoles (Table 6; Figure 3).
Administration of the unsubstituted P-BZT resulted in a mild but significant increase in absolute liver weight (14%–34%) compared to the control animals at ≥300 mg/kg/day, with relative liver weights also significantly increased at doses ≥300 mg/kg/day. For the monosubstituted phenolic benzotriazoles, 1,000 mg/kg/day of drometrizole and ≥300 mg/kg/day of tBu-BZT induced significant increases in absolute liver weight (17%–44%) compared to their respective control animals. Relative liver weights were also significantly increased at ≥100 mg/kg/day for drometrizole and tBu-BZT. No significant differences in liver weights occurred for animals administered octrizole as compared to the control animals.
Three di- and trisubstituted phenolic benzotriazoles (ditPe-BZT, tBuPrOcEst-BZT, and ditBuCl-BZT) induced significant increases in absolute liver weight (31%–51%) compared to their respective control animals at the lowest dose of 30 mg/kg/day. In the higher dose groups, absolute liver weights were consistently increased for ditPe-BZT and ditBuCl-BZT, with increases of 67% and 77%, respectively, at 1,000 mg/kg/day. Absolute liver weights for the 100 and 300 mg/kg/day tBuPrOcEst-BZT groups were significantly increased (47%–48%). Relative liver weights were also significantly increased for ditPe-BZT, tBuPrOcEst-BZT, and ditBuCl-BZT at ≥30 mg/kg/day. In animals administered the trisubstituted bumetrizole, absolute liver weights were significantly increased only at the highest dose of 1,000 mg/kg/day by 13%, with a corresponding significant increase in relative liver weights. No significant differences in absolute or relative liver weights occurred in animals administered the disubstituted diMeEtPh-BZT.
For both left and right kidneys, absolute kidney weights were significantly increased by 14%–15% for the unsubstituted phenolic benzotriazole, P-BZT, at 1,000 mg/kg/day, with relative kidney weights also significantly increased at the same dose (Table 7; Figure 4). Of the monosubstituted phenolic benzotriazoles, only drometrizole administered at ≥300 mg/kg/day resulted in significant increases in relative left kidney weights, with relative right kidney weights increased at only 1,000 mg/kg/day; there were no significant differences in absolute kidney weights for drometrizole. As there were no significant changes in body weights or absolute kidney weights of animals administered drometrizole, the relationship of the increased relative kidney weights to chemical administration is marginal and unclear. No significant differences in absolute or relative kidney weights were found after administration of the other two monosubstituted chemicals, tBu-BZT and octrizole. Two of the disubstituted chemicals induced significant increases in absolute left and right kidney weights, by 11%–20% for ditPe-BZT (≥100 mg/kg/day with the exception of the 1,000 mg/kg/day for the left kidney) and by 48%–58% for the 1,000 mg/kg/day tBuPrOcEst-BZT group compared to those of the control group. Relative left and right kidney weights were also significantly increased following administration of ditPe-BZT (≥100 mg/kg/day) and at 1,000 mg/kg/day tBuPrOcEst-BZT. Administration of the third disubstituted phenolic benzotriazole, diMeEtPh-BZT, did not result in any significant differences in kidney weights. Of the trisubstituted chemicals, only ditBuCl-BZT (all dosed groups) resulted in significantly increased absolute left and right kidney weights by 15%–22%, with corresponding significant increases in relative left and right kidney weights. Bumetrizole exposure did not result in significant differences in kidney weights.
Figure 4 illustrates the changes in absolute left kidney weights as a representative example; the right kidney showed similar responses, with only slightly different, but still significant, values for P-BZT, ditPe-BZT, tBuPrOcEst-BZT, and ditBuCl-BZT.
Significant decreases in absolute thymus and heart weights (−71% and −30%, respectively, compared to the control animals) were observed in the 1,000 mg/kg/day tBuPrOcEst-BZT group, with relative thymus weights also significantly decreased (Appendix F). Negative trends were observed for both left and right absolute testis and epididymis weights for P-BZT and tBuPrOcEst-BZT (Table 8). For the unsubstituted P-BZT, minimal but significant decreases occurred in the 1,000 mg/kg/day group for absolute left epididymis weight only. In rats administered the disubstituted tBuPrOcEst-BZT, absolute left and right epididymis weights were significantly decreased at doses of ≥300 mg/kg/day, and absolute left and right testis weights were significantly decreased in the 1,000 mg/kg/day group, likely driven by the overall loss of body weight rather than toxicity. There were no histopathological changes associated with the reproductive organ weight changes. Statistically significant changes observed in other organs and chemicals were sporadic and deemed not dose related (Appendix F).
Clinical Pathology
The clinical chemistry data are presented in Appendix F. In general, changes in the biomarkers of protein metabolism (i.e., total protein, albumin, globulin, and albumin/globulin ratio [A/G ratio]) occurred for rats administered six of the nine phenolic benzotriazoles (i.e., the unsubstituted [P-BZT], one monosubstituted [tBu-BZT]), three disubstituted [ditPe-BZT, diMeEtPh-BZT, and tBuPrOcEst-BZT], and one trisubstituted [ditBuCl-BZT]) (Figure 5).
For the unsubstituted P-BZT, serum albumin concentration was significantly increased (7%) in the highest dose (1,000 mg/kg/day) group. In contrast, the serum globulin concentration was significantly decreased by 12%, compared to the control group, in the 1,000 mg/kg/day animals. The outcome of the small increase in albumin and decrease in globulin resulted in effectively no change in the overall total protein concentration and a 22% significant increase in the A/G ratio. Similar albumin and globulin changes occurred in two disubstituted (ditPe-BZT and tBuPrOcEst-BZT) and one trisubstituted (ditBuCl-BZT) phenolic benzotriazoles. In these compounds, however, significant albumin increases were observed in most dosed groups, and significant globulin decreases were observed across all dosed groups.
Furthermore, regardless of the dose group, the significant changes in increased albumin (13%–19%) and decreased globulin (31%–48%) were more substantial in animals administered these substituted compounds compared to the affected P-BZT animals. The only exception to this generality was the 1,000 mg/kg/day tBuPrOcEst-BZT group. Those animals demonstrated kidney pathology (Appendix F) and a marked significantly decreased body weight (33.2%) compared to the control group (Table 5). Thus, because of apparent ill health and kidney disease, the albumin concentration was lower (instead of higher) by 9%, and the significant decrease in globulin in the 1,000 mg/kg/day tBuPrOcEst-BZT group was somewhat less (29%) than seen in the other dosed groups for tBuPrOcEst-BZT or for any group administered ditPe-BZT or ditBuCl-BZT. Like P-BZT, the outcome of the significantly increased albumin and significantly decreased globulin for the affected multisubstituted compounds mostly resulted in effectively no change in the overall total protein concentration (except for the 300 and 1,000 mg/kg/day tBuPrOcEst-BZT animals [8% and 16% significant decreases, respectively] and the 100 mg/kg/day ditBuCl-BZT rats [9% significant decrease]). In every ditPe-BZT-, tBuPrOcEst-BZT-, or ditBuCl-BZT-dosed group, the A/G ratios were significantly increased by 64%–118% (except for the 1,000 mg/kg/day tBuPrOcEst-BZT rats in which the A/G ratio was higher by approximately 28%). In contrast, the trisubstituted phenolic benzotriazole, bumetrizole, induced no significant changes in the biomarkers of protein metabolism, and the disubstituted phenolic benzotriazole, diMeEtPh-BZT, resulted in a minor but significant decrease in globulin in the 30 mg/kg/day group, which was characterized as no effect on the biomarkers of protein metabolism. Thus, the observed changes in protein biomarkers were not consistent across all disubstituted or trisubstituted phenolic benzotriazoles studied currently. Additionally, none of the monosubstituted phenolic benzotriazoles demonstrated any alteration in albumin, globulin, or A/G ratio, and only a minimal but significant increase in total protein concentration, 5% and 7%, occurred in the 300 and 1,000 mg/kg/day tBu-BZT groups, respectively.
Changes in the biomarkers of lipid metabolism (i.e., cholesterol and triglycerides) occurred in rats administered five of the eight substituted phenolic benzotriazoles (i.e., two monosubstituted [drometrizole and tBu-BZT], two disubstituted [ditPe-BZT and diMeEtPh-BZT] and one trisubstituted [ditBuCl-BZT]) (Figure 5).
For the monosubstituted phenolic benzotriazoles (i.e., drometrizole, tBu-BZT, and octrizole), significant increases in serum cholesterol concentration occurred in the 1,000 mg/kg/day drometrizole group and in all tBu-BZT-dosed groups compared to respective control animals. For drometrizole, the increase (27%) occurred in the highest dose group (1,000 mg/kg/day). For tBu-BZT, the increase occurred across all dosed groups in an apparent dose-related manner ranging from 15% (30 mg/kg/day) to 43% (1,000 mg/kg/day). There was an apparent significant decrease (21%–41%) in triglyceride concentration across all dosed groups of tBu-BZT. For the third monosubstituted phenolic benzotriazole, octrizole, serum cholesterol and triglyceride concentrations were unaffected.
In contrast to the increased cholesterol observed for the monosubstituted phenolic benzotriazoles, the di- and trisubstituted phenolic benzotriazoles demonstrated significantly decreased serum cholesterol. For two of the three disubstituted phenolic benzotriazoles (i.e., ditPe-BZT and diMeEtPh-BZT), the significant decreases in cholesterol concentration appeared to be exposure related but not dose related. For all ditPe-BZT-dosed groups, decreases in cholesterol ranged from 23% to 33% compared to the control animals. For diMeEtPh-BZT, there was a 14% and 13% significant decrease in cholesterol in the 300 and 1,000 mg/kg/day animals, respectively. While the third disubstituted phenolic benzotriazole, tBuPrOcEst-BZT, did not result in a significant decrease in cholesterol, the tendency for lower cholesterol concentrations (15%–23%) was apparent for all dosed groups (except the 1,000 mg/kg/day group that was found to be in ill health). For the trisubstituted ditBuCl-BZT, a negative trend for cholesterol occurred with a significant decrease (39%) observed for the 100 mg/kg/day group; while not significant, the other dosed groups had apparent lower concentrations of cholesterol (25%–29%). Bumetrizole (the other trisubstituted phenolic benzotriazole evaluated in these studies) was not found to affect cholesterol concentrations. There were no differences in triglyceride concentrations following administration of any of the di- and trisubstituted phenolic benzotriazoles. While some change in cholesterol was observed following dosing with some of the mono-, di-, and trisubstituted phenolic benzotriazoles, the single unsubstituted phenolic benzotriazole evaluated, P-BZT, did not result in cholesterol or triglyceride changes compared to the control group.
Changes in liver biomarkers (i.e., alanine aminotransferase [ALT], alkaline phosphatase [ALP] and bile salts/acids) occurred for rats administered five of the eight substituted phenolic benzotriazoles (i.e., two monosubstituted [tBu-BZT and octrizole], two disubstituted [ditPe-BZT and tBuPrOcEst-BZT] and one trisubstituted [ditBuCl-BZT]) (Figure 5).
No changes occurred in any liver biomarkers following administration of the unsubstituted P-BZT. For monosubstituted tBu-BZT, significant decreases in ALT activity and bile salt/acid concentration occurred in the 300 mg/kg/day group, and a significant decrease in ALP activity occurred in the 300 and 1,000 mg/kg/day groups. For ALT and ALP, the lower activities were mild (i.e., ALT = 21% and 17%; ALP = 15% and 14% in the 300 and 1,000 mg/kg/day groups, respectively). However, for bile salt/acid concentration, the exposure-related, but not dose-related, decrease was marked (i.e., 84% in the 300 mg/kg/day group). The responses appeared to be unique to tBu-BZT as the other two monosubstituted phenolic benzotriazoles were unaffected; drometrizole induced no significant changes in liver biomarkers, and octrizole induced a minor but significant decrease in bile salts/acids in the 100 mg/kg/day group, which was characterized as no effect.
In contrast to the significant decreases in ALT and ALP activities and bile salt/acid concentration observed for the monosubstituted tBu-BZT, the di- and trisubstituted phenolic benzotriazoles demonstrated significant increases in ALT and ALP activities and bile salt/acid concentration. For two of the three disubstituted phenolic benzotriazoles (i.e., ditPe-BZT and tBuPrOcEst-BZT), the ALP activity, routinely used for detecting cholestasis, was significantly increased, prominent, and appeared to be dose related. For example, for ditPe-BZT, ALP activity was increased by 46% in the 30 mg/kg/day group and 105% in the 1,000 mg/kg/day group. For tBuPrOcEst-BZT, ALP activity increased by 120%, 128%, and 378% in the 100, 300, and 1,000 mg/kg/day groups, respectively. The bile salt/acid concentration, another marker typically used for detecting cholestasis, followed a similar pattern as ALP activity. That is, for ditPe-BZT, bile salt/acid concentration was increased by 158% in the 100 mg/kg/day group, and for tBuPrOcEst-BZT, bile salt/acid concentrations increased by 170%, 383%, 187%, and 473% in the 30, 100, 300 and 1,000 mg/kg/day groups, respectively. ALT activity, routinely used for detecting hepatocellular injury or leakage, demonstrated milder, but significant, increases compared to the ALP and bile salt/acid responses. For example, for ditPe-BZT, ALT activity increased by 26% in the 30 mg/kg/day group and 55% in the 1,000 mg/kg/day group; for tBuPrOcEst-BZT, ALT activity increased by 72% in the 1,000 mg/kg/day group. Serum sorbitol dehydrogenase activity, another marker for detecting hepatocellular injury or leakage, was unaffected in these studies (Appendix F). The ALT and ALP activities and bile salt/acid concentration responses for the disubstituted phenolic benzotriazoles were not consistent as the third disubstituted compound, diMeEtPh-BZT, evaluated for these studies demonstrated no effect.
In a similar pattern of response to the disubstituted phenolic benzotriazoles, the trisubstituted ditBuCl-BZT demonstrated significant increases in ALP activity and bile salt/acid concentration. That is, ALP activity increased 48%, 80%, 64%, and 69% in the 30, 100, 300 and 1,000 mg/kg/day groups, respectively, and bile salt/acid concentration increased by 166% and 216% in the 30 and 100 mg/kg/day groups, respectively. Dissimilar to the disubstituted phenolic benzotriazoles, no ALT activity response occurred in any of the ditBuCl-BZT-dosed groups. Furthermore, the other trisubstituted compound, bumetrizole, evaluated in these studies was unaffected.
Changes in the biomarkers of a kidney effect (i.e., urea nitrogen and creatinine) occurred only in rats administered the disubstituted tBuPrOcEst-BZT (Table 9). In this instance, the urea nitrogen concentration demonstrated significant increases of 52% and 367% in the 300 and 1,000 mg/kg/day groups, respectively. For creatinine concentration, a nonsignificant but relevant (compared to the control and all dosed groups) increase of 108% in the 1,000 mg/kg/day group occurred and was consistent with the large increase in urea nitrogen concentration. The relatively small (52%) increase in urea nitrogen concentration that occurred in the 300 mg/kg/day group may also suggest a kidney effect but was not supported by any change in creatinine concentration. There was a minimal but significant increase in urea nitrogen at 1,000 mg/kg/day for ditPe-BZT but no corresponding increase in creatinine concentration; therefore, it was not deemed biologically relevant (Appendix F). Additionally, significant increases in creatine kinase activity, a biomarker of muscle injury, were observed in the 300 and 1,000 mg/kg/day groups for ditPe-BZT.
The hematology data for rats are presented in Appendix F. In general, changes in the biomarkers of the leukon (i.e., white blood cells, neutrophils, and lymphocytes) and biomarkers of the erythron (i.e., hematocrit, manual hematocrit, erythrocytes, mean cell volume, and mean cell hemoglobin concentration) occurred for rats administered two of three disubstituted phenolic benzotriazoles (ditPe-BZT and tBuPrOcEst-BZT but not diMeEtPh-BZT) (Figure 6).
In both ditPe-BZT- and tBuPrOcEst-BZT-dosed animals, there were significant increases in the white blood cell and neutrophil counts. For ditPe-BZT, the white blood cell count was increased by 49%, 53%, and 70% in the 100, 300, and 1,000 mg/kg/day groups, respectively, and the neutrophil count increased by 40% and 49% in the 300 and 1,000 mg/kg/day groups, respectively. There was a positive trend for lymphocyte counts that demonstrated a dose-related increase from 36% to 71% across all dosed groups, but no increase at any dose reached statistical significance. For tBuPrOcEst-BZT, the white blood cell count was increased by 69% in only the 100 mg/kg/day group with no dose-dependent changes. The neutrophil count increased by 80%, 60%, and 303% in the 100, 300, and 1,000 mg/kg/day groups, respectively; the lymphocyte count was significantly increased by 68% in the 100 mg/kg/day group. The leukon responses for the disubstituted phenolic benzotriazoles were not consistent as one of the three disubstituted compounds evaluated for these studies, diMeEtPh-BZT, demonstrated no effect.
Of the nine phenolic benzotriazoles evaluated in these studies, only the disubstituted tBuPrOcEst-BZT demonstrated an erythron effect (Figure 6). In this instance, tBuPrOcEst-BZT demonstrated significant decreases in hematocrit of 7%, 3%, and 21% in the 100, 300, and 1,000 mg/kg/day groups, respectively. In similar fashion, a significant decrease in manual hematocrit of 19% occurred in the 1,000 mg/kg/day group, and the erythrocytes significantly decreased 8% in the 100 mg/kg/day group. A significant decrease (10%) in mean cell volume, indicating smaller erythrocyte size, occurred in the 1,000 mg/kg/day group. A significant increase (12%) in mean cell hemoglobin concentration also occurred in the 1,000 mg/kg/day group.
Gene Expression
Liver gene expression was assessed for genes related to peroxisome proliferator-activated receptor alpha (PPARα), constitutive androstane receptor (CAR) and pregnane X receptor (PXR), nuclear factor erythroid 2-related factor 2 (NRF2), and tumor protein 53 (TP53) for all nine phenolic benzotriazoles, as shown in Table 10 and Table 11. The 11 assessed genes are further described and defined in Gene Expression Analysis.
PPARα-related genes exhibited significant increases after phenolic benzotriazole administration, and the greatest fold changes were observed in the expression of Acot1 (Table 10). Following administration of the unsubstituted phenolic benzotriazole, P-BZT, liver gene expression was significantly increased for Acot1 in the 1,000 mg/kg/day group and for Cyp4a1 in the 300 and 1,000 mg/kg/day groups compared to the control group. For two monosubstituted phenolic benzotriazoles, drometrizole and tBu-BZT, sporadic decreases in fold change were seen in Acox1 and Cyp4a1, respectively, although they were minimal and not dose dependent. No significant changes to PPARα-related gene expression occurred in any of the octrizole-dosed groups. For disubstituted phenolic benzotriazoles, liver Acot1 and Acox1 expression levels were significantly increased across all dosed groups of ditPe-BZT and tBuPrOcEst-BZT, relative to their respective control group. Liver Cyp4a1 expression was significantly increased in the 30 and 100 mg/kg/day ditPe-BZT groups and in all tBuPrOcEst-BZT-dosed groups. The third disubstituted phenolic benzotriazole, diMeEtPh-BZT, induced no significant changes in PPARα-related gene expression. In the trisubstituted chemicals, PPARα-related genes were significantly increased after ditBuCl-BZT administration, with liver Acot1 expression increased in the 100 and 300 mg/kg/day groups and liver Acox1 expression increased in the 30 and 100 mg/kg/day groups. Liver Cyp4a1 expression was also significantly increased in the 30, 100, and 300 mg/kg/day ditBuCl-BZT groups. For the other trisubstituted phenolic benzotriazole, bumetrizole, a minimal decrease in fold change was seen in Acox1 for the 100 mg/kg/day group.
Alterations of CAR and PXR activity were less consistent (Table 11). Cyp2b1 expression was significantly increased in the 30 and 1,000 mg/kg/day ditPe-BZT groups and in the 100 and 300 mg/kg/day ditBuCl-BZT groups, suggesting non-dose-dependent increases in CAR activity for two individual di- and trisubstituted phenolic benzotriazoles. Significant decreases in Cyp3a23/3a1 expression, which is related to PXR activity, were seen in only three chemicals. For disubstituted chemicals, decreases in expression occurred in the 30 and 1,000 mg/kg/day ditPe-BZT groups, and at doses ≥100 mg/kg/day for tBuPrOcEst-BZT. Cyp3a23/3a1 liver gene expression was also significantly decreased for the 1,000 mg/kg/day ditBuCl-BZT-dosed animals.
NRF2-related activities were strongest with Gstm3, which displayed significant decreases in expression in all dosed groups for the disubstituted chemicals, ditPe-BZT and tBuPrOcEst-BZT, and the trisubstituted ditBuCl-BZT. Liver Nqo1 gene expression was significantly increased at ≥100 mg/kg/day for the monosubstituted tBu-BZT and the trisubstituted bumetrizole. In contrast, the other trisubstituted phenolic benzotriazole, ditBuCl-BZT, induced significant decreases in Nqo1 gene expression in all dosed groups.
Sporadic but significant decreases in fold changes for Ccng1 and Cdkn1a, genes related to TP53, were apparent in the tBu-BZT-, ditPe-BZT-, diMeEtPh-BZT-, tBuPrOcEst-BZT-, bumetrizole-, and ditBuCl-BZT-dosed groups; however, these decreases were not dose dependent and not considered related to chemical administration. Overall, drometrizole, octrizole, diMeEtPh-BZT, and bumetrizole had minimal to no biologically relevant changes in targeted gene expression of the liver.
Liver gene expression of Cyp1b1 was excluded from the analyses because the levels were too low to confidently measure and compare across samples.
Havcr1 gene expression in the kidneys was unchanged for all phenolic benzotriazoles except for the trisubstituted ditBuCl-BZT-dosed animals, in which there was a significant decrease in the 30 and 300 mg/kg/day groups relative to control animals. Although not significant, a >550-fold increase in Havcr1 was shown in the disubstituted phenolic benzotriazole tBuPrOcEst-BZT, in the 1,000 mg/kg/day group (Appendix F). An increase in expression of Havcr1 is recognized as a marker of kidney injury.85
85. Song J, Yu J, Prayogo GW, Cao W, Wu Y, Jia Z, Zhang A. Understanding kidney injury molecule 1: A novel immune factor in kidney pathophysiology. Am J Transl Res. 2019; 11(3):1219-1229. PubMed: 30972157
Some gene expression results did not reach statistical significance (p ≤ 0.05) despite showing biologically relevant fold changes because of several factors, including the fact that the nonparametric rank tests with multiple comparison adjustments were used to assess the difference in the sum of ranks within the study groups and did not assess the actual gene expression values. This method considers the ranks of all groups, rather than just the comparison of two individual groups. For example, when the mid-dose groups have higher ranks than the high-dose groups, although greater than the control groups, the statistical significance may be limited. Additionally, there are limitations in the statistical power and statistical tests that can be used because of the small sample sizes (n = 3–5) of these studies.
Internal Concentration
Analytes were quantified as free (unconjugated) and total (unconjugated and conjugated) parent. Because the ester tBuPrOcEst-BZT undergoes hydrolysis during deconjugation conditions, total for this compound represents the corresponding 3-(2H-benzo[d][1,2,3]triazol-2-yl)-5-(tert-butyl)-4-hydroxyphenyl)propanoic acid (tBuPrA-BZT), whereas free represents the ester itself.
In general, the free (unconjugated parent; Table 12; Figure 7A) and total (unconjugated and conjugated parent; Table 12; Figure 7B) plasma concentrations (ng/mL or nmol/L) of each respective phenolic benzotriazole increased with increasing dose. Both free and total plasma concentrations for each respective chemical were below or near the limit of detection in the control groups and hence the frequency of quantitation was low. In general, total analytes have a higher limit of detection than free analytes,79 leading to a lower frequency of quantitation for total analytes in the control group than free analytes, depending on the compound. High variability in some groups resulted in a lack of pairwise significance, although the nominal values increased with increasing dose.
79. Mutlu E, South N, Pierfelice J, Djonabaye A, Pauff M, Burback B, Waidyanatha S. Quantitation of phenolic benzotriazole class compounds in plasma by liquid chromatography-tandem mass spectrometry (LC-MS/MS). Anal Lett. 2022; 55(13):2074-2088. DOI: 10.1080/00032719.2022.2044348 PubMed: 36147651
Free plasma concentrations were lowest for unsubstituted P-BZT and monosubstituted drometrizole. For P-BZT and drometrizole, total plasma concentrations were ≥62-fold (P-BZT) and ≥117-fold (drometrizole) higher than corresponding free plasma concentrations, demonstrating extensive conjugation. However, free plasma concentration increased with increasing size of the substituent or the degree of substitution, suggesting a decrease in conjugation with increasing size and/or the degree of substitution. Free and total plasma concentrations became similar for substituted tBu-BZT, octrizole, ditPe-BZT, diMeEtPh-BZT, bumetrizole, and ditBuCl-BZT, demonstrating little or no conjugation of these compounds in vivo. Among the disubstituted compounds, concentrations of free tBuPrOcEst-BZT were the lowest, demonstrating significant first-pass metabolism of the ester to the corresponding acid, as evidenced by the observed high concentration of tBuPrA-BZT. Overall, as the degree of substitution increased from un- to trisubstituted, the free and total plasma concentrations of phenolic benzotriazoles became more similar, suggesting that little to no metabolism is occurring.
Histopathology
This section describes the statistically significant or biologically noteworthy changes in the incidence of nonneoplastic lesions in the liver and kidney.
Liver: Hepatocyte hypertrophy occurred in the liver of male rats after administration of six of the nine phenolic benzotriazoles, across all substitution groups. Hepatocyte hypertrophy occurred at ≥300 mg/kg/day (P-BZT); at ≥100 mg/kg/day (drometrizole, tBu-BZT, and tBuPrOcEst-BZT); and at ≥30 mg/kg/day (ditPe-BZT and ditBuCl-BZT; Table 13). Hepatocyte hypertrophy was not observed in any rats from the octrizole, diMeEtPh-BZT, or bumetrizole-dosed groups.
Hepatocyte hypertrophy was generally characterized by diffuse panlobular enlargement of hepatocytes. The hepatocytes had dark granular eosinophilic cytoplasm, vesicular nuclei with prominent nucleoli, and occasionally, multiple nuclei (Figure 8). The severity of this finding was minimal for the unsubstituted P-BZT and ranged from minimal to mild for the five other chemicals with observed hepatocyte hypertrophy (i.e., drometrizole, tBu-BZT, ditPe-BZT, tBuPrOcEst-BZT, and ditBuCl-BZT). There was no consistent evidence that the severity of hepatocyte hypertrophy was related to the dose, although in two monosubstituted chemicals (drometrizole and tBu-BZT), mild severity was recorded only in rats from the 1,000 mg/kg/day group.
Kidney: Obstructive nephropathy was observed only in rats administered 1,000 mg/kg/day tBuPrOcEst-BZT (Table 14; Figure 9) and not observed in rats administered the other eight phenolic benzotriazoles (Appendix F). Obstructive nephropathy was generally characterized by renal tubule dilation in the cortex, medulla, and papilla, with the outer stripe of the outer medulla being most severely affected. The renal tubules were lined by attenuated epithelium composed of crowded, slightly basophilic cells. Occasionally, renal tubule epithelial cells, mainly in the cortex, had cytoplasmic vacuolation and lumens containing mineralized debris. In all five rats, obstructive nephropathy was associated with suppurative inflammation, seen mainly in the papilla (Table 14). It was characterized by dilated renal tubules with lumens containing viable and degenerating neutrophils, cellular debris, and, rarely, unstained crystalline shapes presumed to be spaces left after tBuPrOcEst-BZT was washed out during processing.
Other Lesions: Thymic atrophy occurred in four of five rats in the 1,000 mg/kg/day tBuPrOcEst-BZT group (Appendix F); in the fifth rat, the thymus section was not present for histopathological evaluation. In three of four rats, thymic atrophy correlated with a necropsy observation of small thymus. Thymic atrophy also corresponded to a significant decrease in absolute thymus weights (71%), with relative thymus weights also significantly decreased (Appendix F). Thymic atrophy was observed in the rats with obstructive nephropathy in the kidneys and was considered likely related to stress rather than to a direct effect of tBuPrOcEst-BZT.
There were a few additional findings with statistical significance; however, they were not considered related to administration of phenolic benzotriazoles.
Genetic Toxicology
The genetic toxicity of phenolic benzotriazoles was evaluated in the peripheral blood micronucleus test in male rats. Micronucleated reticulocytes were not increased in male rats administered phenolic benzotriazoles for 2 weeks via gavage, except when administered tBuPrOcEst-BZT (Table D-1 to Table D-9). Although a significant increase in micronucleated reticulocytes was observed in the 1,000 mg/kg/day tBuPrOcEst-BZT group, the increase was within the historical control 95% confidence interval and was judged to be an equivocal response. Administration of phenolic benzotriazoles did not affect the percentage of reticulocytes, indicating a lack of toxicity to the bone marrow (Appendix D). Data from all NTP genetic toxicity tests with phenolic benzotriazoles are available in the NTP CEBS database: https://doi.org/10.22427/NTP-DATA-TOX-108.106
106. National Toxicology Program (NTP). TOX-108: Pathology tables, survival and growth curves from NTP short-term, genetic toxicology studies. Research Triangle Park, NC: U.S. Department of Health and Human Services, Public Health Service, National Toxicology Program; 2025. 10.22427/NTP-DATA-TOX-108
Discussion
Phenolic benzotriazoles are a class of chemicals with applications as ultraviolet (UV)-light absorbing additives in industrial and consumer products. The addition of phenolic benzotriazoles to products improves stability and durability and prevents other changes such as discoloration and cracking of plastics. Phenolic benzotriazoles were selected for toxicological testing because of their high production volume and widespread use. At the time of selection, 30 chemicals with the same structural backbone were identified. Existing studies used a variety of doses, study duration, and animal models, making comparisons across the class difficult. To fill this knowledge gap, these studies aimed to assess the toxicity of nine phenolic benzotriazoles with high production volume and procurement availability in a single report. The 2-week gavage study design allowed for a side-by-side comparison of the nine phenolic benzotriazoles to assess class similarities in toxicity outcomes.
The nine phenolic benzotriazoles tested were:
Unsubstituted
2-(2H-benzotriazol-2-yl)phenol (P-BZT)
Monosubstituted
2-(2H-benzotriazol-2-yl)-4-methylphenol (drometrizole)
2-(2H-benzotriazol-2-yl)-4-tert-butylphenol (tBu-BZT)
2-(2H-benzotriazol-2-yl)-4-(1,1,3,3-tetramethylbutyl)phenol (octrizole)
Disubstituted
2-(2H-benzotriazol-2-yl)-4,6-bis(1,1-dimethylpropyl)phenol (ditPe-BZT)
2-(2H-benzotriazol-2-yl)-4,6-bis(1-methyl-1-phenylethyl)phenol (diMeEtPh-BZT)
3-(2H-benzotriazol-2-yl)-5-(1,1-dimethylethyl)-4-hydroxybenzenepropanoic acid, octyl ester (tBuPrOcEst-BZT)
Trisubstituted
2-(5-chloro-2H-1,2,3-benzotriazol-2-yl)-6-(1,1-dimethylethyl)-4-methylphenol (bumetrizole)
2-(5-chloro-2H-benzotriazol-2-yl)-4,6-bis(1,1-dimethylethyl)phenol (ditBuCl-BZT)
For each of the nine phenolic benzotriazoles, groups of five male rats were administered 0, 30, 100, 300, or 1,000 mg chemical/kg body weight/day (mg/kg/day) in 0.5% aqueous methylcellulose by gavage for 2 weeks.
Dosing of rats with seven of the nine phenolic benzotriazoles, across all substitution groups, indicated the liver was the common target organ for toxicity although to various degrees of change in liver weights, histopathology, liver gene expression, serum liver function, and protein metabolism biomarkers. The chemicals with the most potent effects were ditPe-BZT, tBuPrOcEst-BZT, and ditBuCl-BZT, of which the first two are disubstituted chemicals and the third is a trisubstituted chemical; this presented a unique pattern of changes in liver-related endpoints at all doses, even at the lowest dose of 30 mg/kg/day. These changes included dose-related significant increases in liver weight, peroxisome proliferator-activated receptor alpha (PPARα)-related gene expression in the liver, serum alkaline phosphatase (ALP), serum albumin, and albumin/globulin ratio (A/G ratio), with significant decreases in serum globulin, and a 100% incidence of hepatocyte hypertrophy. Significant decreases in cholesterol were also seen in all ditPe-BZT dosed groups and at 100 mg/kg/day ditBuCl-BZT with an overall negative trend. Creatine kinase activity, a biomarker of muscle injury, was significantly increased in the ≥300 mg/kg/day ditPe-BZT-dosed groups. While 30 mg/kg/day of tBuPrOcEst-BZT administration induced a similar pattern of changes in liver weight, serum albumin, globulin, A/G ratio, PPARα-related gene expression, and increased bile salts/acids, no related histopathology was seen. As dose increased to 100 mg/kg/day tBuPrOcEst-BZT, these endpoints showed greater change and further included increases in serum ALP and a 100% incidence of hepatocyte hypertrophy. The increases in ALP and bile salts/acids may also suggest cholestasis in the liver.
The unsubstituted P-BZT and the monosubstituted compounds drometrizole and tBu-BZT induced significant increases in liver weights corresponding to an increased incidence of hepatocyte hypertrophy at doses ≥300 mg/kg/day for P-BZT and ≥100 mg/kg/day for drometrizole and tBu-BZT, although the increased incidence reached statistical significance at only 1,000 mg/kg/day for each chemical. However, the liver weight changes were not as drastic, and the histopathological changes were not accompanied by changes to serum biomarkers or gene expression as were seen with ditPe-BZT, tBuPrOcEst-BZT, and ditBuCl-BZT. The 1,000 mg/kg/day P-BZT group did have significant changes in PPARα-related gene expression, increased albumin and A/G ratio, and decreased globulin, although to a lesser extent. Additionally, tBu-BZT showed contrasting effects to the other chemicals with significant decreases, rather than increases, in the liver enzymes alanine aminotransferase (ALT) and ALP and changes to lipid metabolism biomarkers with increased cholesterol and decreased triglycerides in all dosed groups. Bumetrizole administration at the highest dose led to a significant increase in liver weight by 13%, with no corresponding effect in histopathological or clinical pathology endpoints.
Two of the phenolic benzotriazoles induced overall minimal to no dose-related toxicity: octrizole and diMeEtPh-BZT, which are mono- and disubstituted, respectively. No dose-related changes occurred in octrizole-dosed animals, and diMeEtPh-BZT induced only a minor decrease in cholesterol at the two highest doses.
In general, the phenolic benzotriazole-dosed groups that resulted in higher expression of PPARα-related genes (ditPe-BZT, tBuPrOcEst-BZT, and ditBuCl-BZT) also showed an increased incidence of hepatocyte hypertrophy at lower doses and with a slightly higher severity. In a study by Yang et al.,107 mice that were dosed via intraperitoneal injection with a known PPARα agonist, WY-14643, at 100 mg/kg/day for 10 days exhibited significant increases in liver weight accompanied by significantly increased serum levels of ALP, liver protein expression of ACOX1 and the CYP4A family of proteins, and hepatocyte hypertrophy. Additionally, in a study of a similar phenolic benzotriazole, 2-(2'-hydroxy-3',5'-di-tert-butylphenyl)benzotriazole (ditBu-BZT; CASRN: 3846-71-7), a single gavage administration of 2.5 mg/kg was shown to activate 41 PPARα-related genes in the liver of male rats.71 These results are very similar to the liver-related changes reported here, particularly for ditPe-BZT, tBuPrOcEst-BZT, and ditBuCl-BZT, suggesting that PPARα agonism may be a mechanism driving liver toxicity outcomes.
107. Yang J, Yang X, Zhang YF, Tian JN, Fan SC, Gao Y, Li HL, Cai CH, Huang M, Bi HC. Peroxisome proliferator-activated receptor α agonist induces mouse hepatomegaly through the spatial hepatocyte enlargement and proliferation. Acta Pharmacol Sin. 2023; 44(10):2037-2047. DOI: 10.1038/s41401-023-01096-5 PubMed: 37193756
71. Hirata-Koizumi M, Ise R, Kato H, Matsuyama T, Nishimaki-Mogami T, Takahashi M, Ono A, Ema M, Hirose A. Transcriptome analyses demonstrate that Peroxisome Proliferator-Activated Receptor alpha (PPARalpha) activity of an ultraviolet absorber, 2-(2′-hydroxy-3′,5′-di-tert-butylphenyl)benzotriazole, as possible mechanism of their toxicity and the gender differences. J Toxicol Sci. 2016; 41(5):693-700. DOI: 10.2131/jts.41.693 PubMed: 27665778
In the present studies, ditPe-BZT and ditBuCl-BZT groups had significant decreases in cholesterol, whereas bile salts/acids were significantly increased. Additionally, the tBuPrOcEst-BZT group showed significantly increased bile salts/acids in the serum, with decreases in cholesterol that did not reach statistical significance. Bile salts/acids are biosynthesized in the liver from cholesterol. The dose-related cholesterol and bile salt/acid alterations did correspond to negative trends and/or significant decreases in Cyp3a23/3a1 gene expression. In a study by Qin et al.,108 Cyp3a1/2 knockout rats showed significant decreases in total cholesterol and increases in total bile acids in serum. The study suggested that this observation was due to a decrease in cholesterol synthesis via lower expression of two genes involved in cholesterol biosynthesis, Hmgcr and Hmgcs1, accompanied by high levels of bile acid biosynthesis from cholesterol.108 This may suggest that the suppression of Cyp3a23/3a1 is involved in the functional changes seen in the more severe cases of liver toxicity after phenolic benzotriazole exposure.
108. Qin X, Zhang Y, Lu J, Huang S, Liu Z, Wang X. CYP3A deficiency alters bile acid homeostasis and leads to changes in hepatic susceptibility in rats. Toxicol Appl Pharmacol. 2021; 429:115703. DOI: 10.1016/j.taap.2021.115703 PubMed: 34461081
108. Qin X, Zhang Y, Lu J, Huang S, Liu Z, Wang X. CYP3A deficiency alters bile acid homeostasis and leads to changes in hepatic susceptibility in rats. Toxicol Appl Pharmacol. 2021; 429:115703. DOI: 10.1016/j.taap.2021.115703 PubMed: 34461081
The results of administration of ditBuCl-BZT reported here are consistent with other published studies. In a study of ditBuCl-BZT via gavage administration for 55–69 days in male and female Crj:CD Sprague Dawley rats, no deaths or body weight changes were observed,70 which was similar to the present study. Male rats administered 25 mg/kg/day had significantly increased serum albumin, A/G ratio, and liver weights, which were also seen at 250 mg/kg/day along with significantly increased ALP; however, no corresponding histopathological effects were seen in the liver of these animals. No changes were observed in male rats administered 2.5 mg/kg/day ditBuCl-BZT, nor in any of the female rats at any dose.70 In a subsequent study, Hirata-Koizumi et al.109 similarly found that following 28 days of ditBuCl-BZT administration via gavage at 250 mg/kg/day, liver weights were increased by more than two times that of the control group, with hepatocyte hypertrophy observed in male rats.109 Interestingly, these changes were not seen in female rats, and when assessed in castrated rats, liver weights were only increased by 40%, and no histopathological changes were seen, suggesting that the sex-specific differences may be affected by the presence of sex hormones.109
70. Ema M, Fukunishi K, Hirose A, Hirata-Koizumi M, Matsumoto M, Kamata E. Repeated-dose and reproductive toxicity of the ultraviolet absorber 2-(3′,5′-di-tert-butyl-2′-hydroxyphenyl)-5-chlorobenzotriazole in rats. Drug Chem Toxicol. 2008; 31(3):399-412. DOI: 10.1080/01480540802171282 PubMed: 18622873
70. Ema M, Fukunishi K, Hirose A, Hirata-Koizumi M, Matsumoto M, Kamata E. Repeated-dose and reproductive toxicity of the ultraviolet absorber 2-(3′,5′-di-tert-butyl-2′-hydroxyphenyl)-5-chlorobenzotriazole in rats. Drug Chem Toxicol. 2008; 31(3):399-412. DOI: 10.1080/01480540802171282 PubMed: 18622873
109. Hirata-Koizumi M, Matsuyama T, Imai T, Hirose A, Kamata E, Ema M. Gender-related difference in the toxicity of ultraviolet absorber 2-(3′,5′-di-tert-butyl-2′-hydroxyphenyl)-5-chlorobenzotriazole in rats. Drug Chem Toxicol. 2008; 31(3):383-398. DOI: 10.1080/01480540802171431 PubMed: 18622872
109. Hirata-Koizumi M, Matsuyama T, Imai T, Hirose A, Kamata E, Ema M. Gender-related difference in the toxicity of ultraviolet absorber 2-(3′,5′-di-tert-butyl-2′-hydroxyphenyl)-5-chlorobenzotriazole in rats. Drug Chem Toxicol. 2008; 31(3):383-398. DOI: 10.1080/01480540802171431 PubMed: 18622872
109. Hirata-Koizumi M, Matsuyama T, Imai T, Hirose A, Kamata E, Ema M. Gender-related difference in the toxicity of ultraviolet absorber 2-(3′,5′-di-tert-butyl-2′-hydroxyphenyl)-5-chlorobenzotriazole in rats. Drug Chem Toxicol. 2008; 31(3):383-398. DOI: 10.1080/01480540802171431 PubMed: 18622872
Although not one of the nine chemicals selected for assessment in the present studies, several published studies on 2-(2'-hydroxy-3',5'-di-tert-butylphenyl)benzotriazole (ditBu-BZT; CASRN: 3846-71-7), a disubstituted phenolic benzotriazole, show a similar toxicity pattern to that seen with ditPe-BZT, tBuPrOcEst-BZT, and ditBuCl-BZT here. The structure of ditBu-BZT differs from ditBuCl-BZT only by the lack of the chlorine on the benzotriazole moiety. Rats administered ditBu-BZT via gavage for 52 weeks showed increases in ALP, A/G ratio, and glucose at 0.5, 2.5, and 12.5 mg/kg/day for males and at 12.5 mg/kg/day for females, as well as hepatocyte hypertrophy at the same doses for each sex respectively.74 Another 28-day gavage administration of the same chemical resulted in liver histopathological lesions of vacuolar degeneration, hypertrophy of hepatocytes, and bile duct proliferation, as well as effects in other organs such as degeneration and hypertrophy of the myocardium in the heart and various kidney pathologies at 0.5, 2.5, 12.5, and 62.5 mg/kg/day for males and at 12.5 mg/kg/day for females.76 These studies suggest the mechanisms of toxicity are similar, as the same pattern of liver-related changes are affected after administration of several different phenolic benzotriazoles.
74. Hirata-Koizumi M, Matsuyama T, Imai T, Hirose A, Kamata E, Ema M. Gonadal influence on the toxicity of 2-(2′-hydroxy-3′,5′-di-tert-butylphenyl) benzotriazole in rats. Drug Chem Toxicol. 2008; 31(1):115-126. DOI: 10.1080/01480540701688808 PubMed: 18161511
76. Hirata-Koizumi M, Watari N, Mukai D, Imai T, Hirose A, Kamata E, Ema M. A 28-day repeated dose toxicity study of ultraviolet absorber 2-(2′-hydroxy-3′,5′-di-tert-butylphenyl) benzotriazole in rats. Drug Chem Toxicol. 2007; 30(4):327-341. DOI: 10.1080/01480540701522254 PubMed: 17934922
The mechanisms of toxicity induced by phenolic benzotriazoles are not well understood. Sakuragi et al.10 suggested a different mechanism may be involved in the toxicity of phenolic benzotriazoles: endocrine disruption. The analysis of Tox21 (Toxicology in the 21st Century) in vitro high-throughput screening data (summary results of these data are provided in Appendix E) found that the monosubstituted phenolic benzotriazole, drometrizole, induced activity related to activation of the estrogen-related receptor (ERR) and the estrogen receptor alpha (ERα) signaling pathways for energy and sex hormone homeostasis, respectively. Other published studies have shown that several phenolic benzotriazoles interact with ERα, ERβ, and androgen receptor signaling.10,110 The Tox21 screening data also indicated that drometrizole is a strong inhibitor of histone deacetylase (HDAC; epigenetic modification). However, the current 2-week studies did not show any phenotypic responses to link with the HDAC inhibition (e.g., bone marrow suppression) or endocrine disruption (e.g., sex organ weight changes) findings seen in the Tox21 results, which may be due to the metabolism of drometrizole in the animals, which does not occur in the in vitro assays. Additionally, the in vivo studies were not designed to evaluate endocrine disruption.
10. Sakuragi Y, Takada H, Sato H, Kubota A, Terasaki M, Takeuchi S, Ikeda-Araki A, Watanabe Y, Kitamura S, Kojima H. An analytical survey of benzotriazole UV stabilizers in plastic products and their endocrine-disrupting potential via human estrogen and androgen receptors. Sci Total Environ. 2021; 800:149374. DOI: 10.1016/j.scitotenv.2021.149374 PubMed: 34388645
10. Sakuragi Y, Takada H, Sato H, Kubota A, Terasaki M, Takeuchi S, Ikeda-Araki A, Watanabe Y, Kitamura S, Kojima H. An analytical survey of benzotriazole UV stabilizers in plastic products and their endocrine-disrupting potential via human estrogen and androgen receptors. Sci Total Environ. 2021; 800:149374. DOI: 10.1016/j.scitotenv.2021.149374 PubMed: 34388645
110. Ohta R, Takagi A, Ohmukai H, Marumo H, Ono A, Matsushima Y, Inoue T, Ono H, Kanno J. Ovariectomized mouse uterotrophic assay of 36 chemicals. J Toxicol Sci. 2012; 37(5):879-889. DOI: 10.2131/jts.37.879 PubMed: 23037998
While the liver was the prominent driver of toxicity for most of the phenolic benzotriazoles, the kidney was also affected by four of the nine chemicals. Mild but significant increases in absolute left and right kidney weights were observed with P-BZT, ditPe-BZT, and ditBuCl-BZT administration. None of these weight changes had corresponding histopathological or clinical chemistry changes. Administration of 1,000 mg/kg/day tBuPrOcEst-BZT resulted in a 48%–58% increase in kidney weights as well as a 100% incidence of obstructive nephropathy (average severity of 2.6) and renal tubule inflammation (average severity of 1.2). This inflammation of the kidney corresponded to a ≥4-fold increase in neutrophil counts and urea nitrogen found in the clinical pathology assessments. In addition, although not statistically significant, gene expression of Havcr1, a marker of renal tubule injury,85 was increased >550-fold at 1,000 mg/kg/day tBuPrOcEst-BZT.
85. Song J, Yu J, Prayogo GW, Cao W, Wu Y, Jia Z, Zhang A. Understanding kidney injury molecule 1: A novel immune factor in kidney pathophysiology. Am J Transl Res. 2019; 11(3):1219-1229. PubMed: 30972157
The rats administered 1,000 mg/kg/day tBuPrOcEst-BZT were the most systemically affected group in these studies of phenolic benzotriazoles. Body weight decreases started by study day 4 and continued to decline throughout the 2-week study. Additionally, all five rats in this group were dehydrated, thin, and had red nasal discharge. Their serum liver biomarkers (ALT, ALP, and bile salts/acids) were all significantly increased, as were neutrophils and mean cell hemoglobin concentration. Significant decreases were seen in hematocrit, manual hematocrit, and mean cell volume. Administration of 1,000 mg/kg/day tBuPrOcEst-BZT also induced significant increases in kidney weight and urea nitrogen and a higher creatinine concentration, likely related to kidney disease. This group also had atrophy of the thymus, which was described as the result of stress secondary to the inflammation in the kidneys, showing an overall systemic toxicity response.
Free (unconjugated parent) and total (unconjugated and conjugated parent) plasma levels of each phenolic benzotriazole collected at study termination were found to follow a pattern suggesting a decrease in phase 2 conjugation of the parent with increasing size and/or substitution number. Little to no conjugation was found for tBu-BZT, octrizole, ditPe-BZT, diMeEtPh-BZT, bumetrizole, and ditBuCl-BZT, although this did not correspond to observed trends in toxicity outcomes. However, in previous studies investigating toxicokinetic behavior after a single gavage administration of either 30 or 300 mg/kg of each phenolic benzotriazole, the maximum plasma concentration (Cmax) and area under the concentration time curve (AUC) were the highest for ditPe-BZT, tBuPrOcEst-BZT, and ditBuCl-BZT,53 the three chemicals showing the most sensitive liver toxicity outcomes in the 2-week studies. Because half-lives (2–57 hours) are different for compounds in the class, the lack of trends between plasma concentration in the current studies and observed toxicity may be due in part to the timing of plasma collection at necropsy.
53. Waidyanatha S, Mutlu E, Gibbs S, Pierfelice J, Smith JP, Burback B, Blystone CT. Phenolic benzotriazoles: A class comparison of toxicokinetics of ultraviolet-light absorbers in male rats. Xenobiotica. 2021; 51(7):831-841. DOI: 10.1080/00498254.2021.1927239 PubMed: 33952035
A goal of these studies was to determine whether there is an overall similar class effect following administration of phenolic benzotriazoles. The results from these studies indicated that the liver was the common target organ of toxicity, although the chemicals had differing potencies as indicated by their lowest-observed-effect level (LOEL) of increases in absolute liver weight, histopathological incidence, and/or PPARα-related gene expression in the liver (Table 15; Figure 10). Given the range of 30–1,000 mg/kg/day tested in the present studies, no LOEL could be determined for rats administered octrizole or diMeEtPh-BZT as there were no liver-related changes or other evidence of toxicity. Rats administered bumetrizole had a LOEL of 1,000 mg/kg/day because of a 13% increase in liver weight, although no corresponding biomarkers or histopathological outcomes were altered. Drometrizole administration also resulted in a LOEL of 1,000 mg/kg/day for both liver weight and histopathological incidence. Rats administered either P-BZT or tBu-BZT had a LOEL of 300 mg/kg/day driven by both liver weight increases and PPARα-related gene expression in the liver for P-BZT and by liver weight increases only for tBu-BZT. DitPe-BZT, tBuPrOcEst-BZT, and ditBuCl-BZT were the most potent as each test article had a LOEL of 30 mg/kg/day. As significant changes occurred at the lowest dose in these studies, the effective LOEL may not have been captured.
A priori classification of phenolic benzotriazoles by substitution number was conducted because of the limited information available at the time of study design. However, given the results of these 2-week gavage toxicity studies, substitution number did not adequately stratify the phenolic benzotriazoles by toxicological effects because within each of the substitution groups, there were responders, to various degrees, and nonresponders. This discrepancy is highlighted when comparing bumetrizole and ditBuCl-BZT, which are very structurally similar given their substitution number and size but have vastly different toxicological outcomes as bumetrizole induced only a minor liver weight increase at the highest dose and ditBuCl-BZT administration led to multiple liver-related toxicological effects. Without definitions to describe responders versus nonresponders a priori, read-across methods will have difficulty in accurately predicting the toxicity of the over 20 phenolic benzotriazoles in this class that were not assessed. While there is no single, standard method for defining chemical classes, classification groupings to define toxicity can be dependent on the specific endpoint being described.111 Groupings of phenolic benzotriazoles may be driven by size, location of substitutions, or more functional descriptors such as PPARα agonism or metabolism pathways. Further research into characterizing the toxicity responses and the mechanisms involved is needed to be able to better classify chemicals within the phenolic benzotriazole class.
111. Maffini MV, Rayasam SDG, Axelrad DA, Birnbaum LS, Cooper C, Franjevic S, MacRoy PM, Nachman KE, Patisaul HB, Rodgers KM, et al. Advancing the science on chemical classes. Environ Health. 2023; 21 Suppl 1:120. DOI: 10.1186/s12940-022-00919-y PubMed: 36635752
It should be noted that there are several limitations with the present studies. These studies contained a small number of animals, five per group, and a short exposure duration of only 2 weeks. The dose range used did not sufficiently extend to a low enough concentration to determine the no-observed-effect level (NOEL) for three of the chemicals, ditPe-BZT, tBuPrOcEst-BZT, and ditBuCl-BZT. Additionally, these studies included only male rats, because prior literature suggested that males were more susceptible to phenolic benzotriazole toxicity, and this limits the interpretation of the results for females. Therefore, only limited conclusions can be made on the greater interpretation and application of these results. More animals and/or a longer dosing period in a future study would help to further elucidate the mechanisms and differences between the dosed groups and between the nine phenolic benzotriazoles. Despite these limitations, these studies demonstrated clear evidence for liver toxicity and further increased the understanding and characterization of the toxicological outcomes of nine phenolic benzotriazoles.
In conclusion, these studies provide data for comparison of nine phenolic benzotriazoles in male rats. The liver was the primary target affected by seven of the phenolic benzotriazoles evaluated, mainly driven by increased liver weights, the incidence of hepatocyte hypertrophy, and upregulation of PPARα-related gene expression in the liver. However, the LOELs and doses at which corresponding changes in liver-related biomarkers occurred varied across the nine chemicals studied for this class. A LOEL could not be determined for octrizole or diMeEtPh-BZT, as there was no evidence of toxicity at the doses tested. Rats administered drometrizole and bumetrizole had a LOEL of 1,000 mg/kg/day. Rats administered either P-BZT or tBu-BZT had a LOEL of 300 mg/kg/day. DitPe-BZT, tBuPrOcEst-BZT, and ditBuCl-BZT were the most potent as each test article had a LOEL of 30 mg/kg/day, the lowest dose administered in these studies. The range of LOELs highlights that while the liver is a common target, the potency of phenolic benzotriazoles varies within the class. Another target identified was the kidney, with increased absolute kidney weights occurring for four chemicals, although only tBuPrOcEst-BZT showed associated histopathological changes. Further quantitative comparisons across the phenolic benzotriazole class will require a more in-depth study of the underlying mechanisms involved and classification methods to allow extrapolations to other chemicals in this class.
References
1. National Information Standards Organization (NISO). CRediT (Contributor Roles Taxonomy). Baltimore, MD: National Information Standards Organization; 2024. [Accessed: July 26, 2024]. https://credit.niso.org/
2. National Toxicology Program (NTP). Chemical information review document for phenolic benzotriazoles: Supporting nomination for toxicological evaluation by the National Toxicology Program. Research Triangle Park, NC: U.S. Department of Health and Human Services, National Institutes of Health, National Institute of Environmental Health Sciences, National Toxicology Program; 2011.
3. Fukuoka N, Kubota K, Iguchi K. Method of preparing 2-phenylbenzotriazoles. Washington, DC: U.S. Patent and Trademark Office; 1993. U.S. Patent No. 5,187,289. [Accessed: June 16, 2023]. https://www.freepatentsonline.com/5187289.pdf
4. U.S. Environmental Protection Agency (USEPA). Chemical data reporting: 2020 CDR data. Washington, DC: U.S. Environmental Protection Agency; 2020. [Accessed: June 16, 2023]. https://www.epa.gov/chemical-data-reporting/access-cdr-data#2020
5. Baoxu Chemical. Additivesforpolymer: Benzophenones and benzotriazole UV absorber. DongGuan City, China: Baoxu Chemical Technology Ltd; 2023. [Accessed: June 16, 2023]. https://www.additivesforpolymer.com/products/uv-absorber-hals/uv-absorber/
6. BASF. Safety data sheet: Tinuvin 384-2. Florham Park, NJ: BASF Corporation; 2023. [Accessed: July 24, 2023]. https://dispersions-resins-products.basf.us/products/tinuvin-384-2
7. BASF. Safety data sheet: Tinuvin 328. Florham Park, NJ: BASF Corporation; 2020. [Accessed: July 24, 2023]. https://dispersions-resins-products.basf.us/products/tinuvin-328
8. BASF. Safety data sheet: Tinuvin 900. Florham Park, NJ: BASF Corporation; 2021. [Accessed: July 28, 2023]. https://dispersions-resins-products.basf.us/products/tinuvin-900
9. BASF. Safety data sheet: Tinuvin 326. Florham Park, NJ: BASF Corporation; 2021. [Accessed: July 28, 2023]. https://dispersions-resins-products.basf.us/products/tinuvin-326
10. Sakuragi Y, Takada H, Sato H, Kubota A, Terasaki M, Takeuchi S, Ikeda-Araki A, Watanabe Y, Kitamura S, Kojima H. An analytical survey of benzotriazole UV stabilizers in plastic products and their endocrine-disrupting potential via human estrogen and androgen receptors. Sci Total Environ. 2021; 800:149374. DOI: 10.1016/j.scitotenv.2021.149374 PubMed: 34388645
11. Begley TH, Biles JE, Cunningham C, Piringer O. Migration of a UV stabilizer from polyethylene terephthalate (PET) into food simulants. Food Addit Contam. 2004; 21(10):1007-1014. DOI: 10.1080/02652030400010447 PubMed: 15712525
12. Durner J, Spahl W, Zaspel J, Schweikl H, Hickel R, Reichl FX. Eluted substances from unpolymerized and polymerized dental restorative materials and their Nernst partition coefficient. Dent Mater. 2010; 26(1):91-99. DOI: 10.1016/j.dental.2009.08.014 PubMed: 19781758
13. Wu Y, Venier M. High levels of synthetic antioxidants and ultraviolet filters in children’s car seats. Sci Total Environ. 2023; 855:158637. DOI: 10.1016/j.scitotenv.2022.158637 PubMed: 36096214
14. Luongo G, Avagyan R, Hongyu R, Östman C. The washout effect during laundry on benzothiazole, benzotriazole, quinoline, and their derivatives in clothing textiles. Environ Sci Pollut Res Int. 2016; 23(3):2537-2548. DOI: 10.1007/s11356-015-5405-7 PubMed: 26429136
15. International Fragrance Association (IFRA). IFRA transparency list. Geneva, Switzerland: International Fragrance Association; 2022. [Accessed: June 16, 2023]. https://ifrafragrance.org/priorities/ingredients/ifra-transparency-list
16. Sardar SW, Choi Y, Park N, Jeon J. Occurrence and concentration of chemical additives in consumer products in Korea. Int J Environ Res Public Health. 2019; 16(24):5075. DOI: 10.3390/ijerph16245075 PubMed: 31842379
17. Environmental Working Group (EWG). EWG's Skin Deep: Products containing bumetrizole. Washington, DC: Environmental Working Group; 2023. [Accessed: June 16, 2023]. https://www.ewg.org/skindeep/browse/ingredients/700836-BUMETRIZOLE/
18. Molins-Delgado D, Olmo-Campos MDM, Valeta-Juan G, Pleguezuelos-Hernández V, Barceló D, Díaz-Cruz MS. Determination of UV filters in human breast milk using turbulent flow chromatography and babies’ daily intake estimation. Environ Res. 2018; 161:532-539. DOI: 10.1016/j.envres.2017.11.033 PubMed: 29232646
19. Lee S, Kim S, Park J, Kim HJ, Lee JJ, Choi G, Choi S, Kim S, Kim SY, Choi K, et al. Synthetic musk compounds and benzotriazole ultraviolet stabilizers in breast milk: Occurrence, time-course variation and infant health risk. Environ Res. 2015; 140:466-473. DOI: 10.1016/j.envres.2015.04.017 PubMed: 25988989
20. Kim JW, Chang KH, Prudente M, Viet PH, Takahashi S, Tanabe S, Kunisue T, Isobe T. Occurrence of benzotriazole ultraviolet stabilizers (BUVSs) in human breast milk from three Asian countries. Sci Total Environ. 2019; 655:1081-1088. DOI: 10.1016/j.scitotenv.2018.11.298 PubMed: 30577102
21. Jungclaus G, Avila V, Hites R. Organic compounds in an industrial wastewater: A case study of their environmental impact. Environ Sci Technol. 1978; 12(1):88-96. DOI: 10.1021/es60137a015
22. Lopez-Avila V, Hites RA. Organic compounds in an industrial wastewater. Their transport into sediments. Environ Sci Technol. 1980; 14(11):1382-1390. DOI: 10.1021/es60171a007
23. Cantwell MG, Sullivan JC, Katz DR, Burgess RM, Bradford Hubeny J, King J. Source determination of benzotriazoles in sediment cores from two urban estuaries on the Atlantic Coast of the United States. Mar Pollut Bull. 2015; 101(1):208-218. DOI: 10.1016/j.marpolbul.2015.10.075 PubMed: 26561444
24. Peng X, Xiong S, Ou W, Wang Z, Tan J, Jin J, Tang C, Liu J, Fan Y. Persistence, temporal and spatial profiles of ultraviolet absorbents and phenolic personal care products in riverine and estuarine sediment of the Pearl River catchment, China. J Hazard Mater. 2017; 323(Pt A):139-146. 10.1016/j.jhazmat.2016.05.020 27209124
25. Ruan T, Liu R, Fu Q, Wang T, Wang Y, Song S, Wang P, Teng M, Jiang G. Concentrations and composition profiles of benzotriazole UV stabilizers in municipal sewage sludge in China. Environ Sci Technol. 2012; 46(4):2071-2079. DOI: 10.1021/es203376x PubMed: 22242929
26. Zhang Z, Ren N, Li YF, Kunisue T, Gao D, Kannan K. Determination of benzotriazole and benzophenone UV filters in sediment and sewage sludge. Environ Sci Technol. 2011; 45(9):3909-3916. DOI: 10.1021/es2004057 PubMed: 21480589
27. Zhao X, Zhang ZF, Xu L, Liu LY, Song WW, Zhu FJ, Li YF, Ma WL. Occurrence and fate of benzotriazoles UV filters in a typical residential wastewater treatment plant in Harbin, China. Environ Pollut. 2017; 227:215-222. DOI: 10.1016/j.envpol.2017.04.072 PubMed: 28472737
28. Lyu Y, Li G, He Y, Li Y, Tang Z. Occurrence and distribution of organic ultraviolet absorbents in soils and plants from a typical industrial area in South China. Sci Total Environ. 2022; 846:157383. DOI: 10.1016/j.scitotenv.2022.157383 PubMed: 35843326
29. Vimalkumar K, Mayilsamy M, Arun E, Gobinath B, Prasanth S, Nikhil PN, Krishna-Kumar S, Srimurali S, Mkandawire M, Babu-Rajendran R. Screening of antimicrobials, fragrances, UV stabilizers, plasticizers and preservatives in sewage treatment plants (STPs) and their risk assessment in India. Chemosphere. 2022; 308(Pt 3):136452. DOI: 10.1016/j.chemosphere.2022.136452 PubMed: 36116630
30. Carpinteiro I, Abuín B, Rodríguez I, Ramil M, Cela R. Pressurized solvent extraction followed by gas chromatography tandem mass spectrometry for the determination of benzotriazole light stabilizers in indoor dust. J Chromatogr A. 2010; 1217(24):3729-3735. DOI: 10.1016/j.chroma.2010.04.022 PubMed: 20435314
31. Blouin K, Malaisé F, Verreault J, Lair S, Lu Z. Occurrence and temporal trends of industrial antioxidants and UV absorbents in the endangered St. Lawrence Estuary beluga whale (Delphinapterus leucas). Sci Total Environ. 2022; 842:156635. DOI: 10.1016/j.scitotenv.2022.156635 PubMed: 35697212
32. Terajima T, Shibahara A, Nakano Y, Kobayashi S, Godwin JR, Nagaoka K, Watanabe G, Takada H, Mizukawa K. Age-related accumulation of persistent organic chemicals in captive king penguins (Aptenodytes patagonicus). J Vet Med Sci. 2022; 84(11):1551-1555. DOI: 10.1292/jvms.22-0245 PubMed: 36198610
33. Pruell RJ, Hoffman EJ, Quinn JG. Total hydrocarbons, polycyclic aromatic hydrocarbons and synthetic organic compounds in the hard shell clam, Mercenaria mercenaria, purchased at commercial seafood stores. Mar Environ Res. 1984; 11(3):163-181. DOI: 10.1016/0141-1136(84)90044-8
34. Kim JW, Isobe T, Ramaswamy BR, Chang KH, Amano A, Miller TM, Siringan FP, Tanabe S. Contamination and bioaccumulation of benzotriazole ultraviolet stabilizers in fish from Manila Bay, the Philippines using an ultra-fast liquid chromatography-tandem mass spectrometry. Chemosphere. 2011; 85(5):751-758. DOI: 10.1016/j.chemosphere.2011.06.054 PubMed: 21741069
35. Nakata H, Murata S, Filatreau J. Occurrence and concentrations of benzotriazole UV stabilizers in marine organisms and sediments from the Ariake Sea, Japan. Environ Sci Technol. 2009; 43(18):6920-6926. DOI: 10.1021/es900939j PubMed: 19806721
36. Nakata H, Shinohara R, Murata S, Watanabe M. Detection of benzotriazole UV stabilizers in the blubber of marine mammals by gas chromatography-high resolution mass spectrometry (GC-HRMS). J Environ Monit. 2010; 12(11):2088-2092. DOI: 10.1039/c0em00170h PubMed: 20959922
37. Nakata H, Shinohara R, Nakazawa Y, Isobe T, Sudaryanto A, Subramanian A, Tanabe S, Zakaria MP, Zheng GJ, Lam PKS, et al. Asia-Pacific mussel watch for emerging pollutants: Distribution of synthetic musks and benzotriazole UV stabilizers in Asian and US coastal waters. Mar Pollut Bull. 2012; 64(10):2211-2218. DOI: 10.1016/j.marpolbul.2012.07.049 PubMed: 22910332
38. Li P, Su W, Liang W, Zhu B, Li T, Ruan T, Jiang G. Occurrence and temporal trends of benzotriazole UV stabilizers in mollusks (2010-2018) from the Chinese Bohai Sea revealed by target, suspect, and nontarget screening analysis. Environ Sci Technol. 2022; 56(23):16759-16767. DOI: 10.1021/acs.est.2c04143 PubMed: 36334087
39. Li Q, Wang P, Wang C, Hu B, Wang X, Li D. Benzotriazole UV stabilizer-induced genotoxicity in freshwater benthic clams: A survey on apoptosis, oxidative stress, histopathology and transcriptomics. Sci Total Environ. 2023; 857(Pt 1):159055. DOI: 10.1016/j.scitotenv.2022.159055 PubMed: 36174688
40. Lu Z, De Silva AO, Provencher JF, Mallory ML, Kirk JL, Houde M, Stewart C, Braune BM, Avery-Gomm S, Muir DCG. Occurrence of substituted diphenylamine antioxidants and benzotriazole UV stabilizers in Arctic seabirds and seals. Sci Total Environ. 2019; 663:950-957. DOI: 10.1016/j.scitotenv.2019.01.354 PubMed: 30739863
41. Provencher JF, Malaisé F, Mallory ML, Braune BM, Pirie-Dominix L, Lu Z. 44-year retrospective analysis of ultraviolet absorbents and industrial antioxidants in seabird eggs from the Canadian Arctic (1975 to 2019). Environ Sci Technol. 2022; 56(20):14562-14573. DOI: 10.1021/acs.est.2c05940 PubMed: 36198135
42. Brandt M, Becker E, Jöhncke U, Sättler D, Schulte C. A weight-of-evidence approach to assess chemicals: Case study on the assessment of persistence of 4,6-substituted phenolic benzotriazoles in the environment. Environ Sci Eur. 2016; 28(1):4. DOI: 10.1186/s12302-016-0072-y PubMed: 27752439
43. Leubner N, Pawlowski S, Salinas ER, Wigh A, Dammann M, Preibisch A, Schmitt C. Assessment of the bioaccumulation potential of four commonly used phenolic benzotriazoles based on in silico and experimental in vivo data. J Appl Toxicol. 2023; 43(9):1272-1283. DOI: 10.1002/jat.4461 PubMed: 36896760
44. European Chemicals Agency (ECHA). Candidate list of substances of very high concern for authorisation. Helsinki, Finland: European Chemicals Agency; 2023. [Accessed: July 2023]. https://echa.europa.eu/candidate-list-table
45. U.S. Environmental Protection Agency (USEPA). 40 CFR Chapter I - Environmental Protection Agency. Subchapter E - Pesticide programs. Subpart D - Exemptions from tolerances. §180.930 Inert ingredients applied to animals; exemptions from the requirement of a tolerance. 2023. [Accessed: June 16, 2023]. https://www.ecfr.gov/current/title-40/chapter-I/subchapter-E/part-180/subpart-D/section-180.930
46. U.S. Environmental Protection Agency (USEPA). 40 CFR Chapter I - Environmental Protection Agency. Subchapter E - Pesticide programs. Subpart D - Exemptions from tolerances. §180.920 Inert ingredients used pre-harvest; exemptions from the requirement of a tolerance. 2023. [Accessed: June 16, 2023]. https://www.ecfr.gov/current/title-40/chapter-I/subchapter-E/part-180/subpart-D/section-180.920
47. U.S. Food and Drug Administration (FDA). 21 CFR Subpart C - Antioxidants and stabilizers. §178.2010 Antioxidants and/or stabilizers for polymers. 2023. [Accessed: June 16, 2023]. https://www.ecfr.gov/current/title-21/chapter-I/subchapter-B/part-178/subpart-C
48. U.S. Food and Drug Administration (FDA). 21 CFR Subpart B - Substances for use only as components of adhesives. §175.105 Adhesives. 2023. [Accessed: June 16, 2023]. https://www.ecfr.gov/current/title-21/chapter-I/subchapter-B/part-175
49. U.S. Environmental Protection Agency (USEPA). InertFinder. Washington, DC: U.S. Environmental Protection Agency; 2023. [Accessed: June 30, 2023]. https://ordspub.epa.gov/ords/pesticides/f?p=INERTFINDER:1:0::NO:1
50. Schmid K, Schweizer W, Stäubli W, Waechter F. Studies of the effect of 2-(2′-hydroxy-5′-methylphenyl)benzotriazole on rat liver. Food Cosmet Toxicol. 1980; 18(3):245-252. DOI: 10.1016/0015-6264(80)90102-9 PubMed: 7419140
51. Thomas H, Hess R, Waechter F. Toxicology of industrial compounds. London, UK: Taylor & Francis; 1995.
52. Organisation for Economic Co-operation and Development (OECD). Case study on the use of an integrated approach to testing and assessment for the repeated-dose toxicity of phenolic benzotriazoles. Paris, France: Organisation for Economic Co-operation and Development; 2017. ENV/JM/MONO(2017)23. [Accessed: July 5, 2023]. https://one.oecd.org/document/ENV/JM/MONO(2017)23/en/pdf
53. Waidyanatha S, Mutlu E, Gibbs S, Pierfelice J, Smith JP, Burback B, Blystone CT. Phenolic benzotriazoles: A class comparison of toxicokinetics of ultraviolet-light absorbers in male rats. Xenobiotica. 2021; 51(7):831-841. DOI: 10.1080/00498254.2021.1927239 PubMed: 33952035
54. Fischer C, Leibold E, Göen T. Identification of in vitro phase I metabolites of benzotriazole UV stabilizer UV-327 using HPLC coupled with mass spectrometry. Toxicol In Vitro. 2020; 68:104932. DOI: 10.1016/j.tiv.2020.104932 PubMed: 32652170
55. Denghel H, Leibold E, Göen T. Oxidative phase I metabolism of the UV absorber 2-(2H-benzotriazol-2-yl)-4,6-di-tert-pentylphenol (UV 328) in an in vitro model with human liver microsomes. Toxicol In Vitro. 2019; 60:313-322. DOI: 10.1016/j.tiv.2019.06.012 PubMed: 31207346
56. Fischer C, Leibold E, Hiller J, Göen T. Human metabolism and excretion kinetics of benzotriazole UV stabilizer UV-327 after single oral administration. Arch Toxicol. 2023; 97(1):165-176. DOI: 10.1007/s00204-022-03401-3 PubMed: 36335248
57. Denghel H, Hiller J, Leibold E, Göen T. Human metabolism and kinetics of the UV absorber 2-(2H-benzotriazol-2-yl)-4,6-di-tert-pentylphenol (UV 328) after oral administration. Arch Toxicol. 2021; 95(8):2677-2690. DOI: 10.1007/s00204-021-03093-1 PubMed: 34180011
58. Environment and Climate Change Canada (ECCC). Health Canada. Draft screening assessment: Benzotriazoles and benzothiazoles group. Gatineau, Quebec, Canada: Environment and Climate Change Canada; 2021. [Accessed: July 28, 2023]. https://www.canada.ca/en/environment-climate-change/services/evaluating-existing-substances/draft-screening-assessment-benzotriazoles-benzothiazoles-group.html
59. U.S. Environmental Protection Agency (USEPA). Screening-level hazard characterization: Sponsored chemicals: Phenolic benzotriazoles category: 2-(2’-hydroxy-5’-methylphenyl) benzotriazole (CASRN 2440-22-4), 2-(2’-hydroxy-5’-octylphenyl) benzotriazole (CASRN 3147-75-9), 2-(2’-hydroxy-3’,5’-di-t-amylphenyl) benzotriazole (CASRN 25973-55-1), 2-(2H-benzotriazol-2-yl)-4,6-bis(1-methyl-1-phenylethyl) phenol (CASRN 70321-86-7). Washington, DC: U.S. Environmental Protection Agency, Office of Pollution Prevention and Toxics; 2009. [Accessed: July 28, 2023]. https://nepis.epa.gov/Exe/ZyPURL.cgi?Dockey=P1013BCS.txt
60. Central Institute for Nutrition Research (TNO). Initial submission: Sub-chronic feeding tests as to the toxicity of 2-(2H-benzotriazol-2-yl)-4-methylphenol in rats with cover letter dated 052092. Basel, Switzerland: Ciba-Geigy Corporation; 1992. TSCATS, Document 88-920002920. OTS0539880. [Accessed: August 7, 2023]. https://ntrl.ntis.gov/NTRL/dashboard/searchResults/titleDetail/OTS0539880.xhtml
61. Ciba-Geigy. Initial submission: Skin sensitisation test in the Guinea pig maximization test (final report) with attachments and cover letter dated 032692. Basel, Switzerland: Ciba-Geigy Corporation; 1992. TSCATS, Document 88-920001579. OTS0535963. [Accessed: August 30, 2023]. https://ntrl.ntis.gov/NTRL/dashboard/searchResults/titleDetail/OTS0535963.xhtml
62. Hald M, Bergendorff O, Isaksson M, Johansen JD. Allergic contact dermatitis caused by plastic items containing the ultraviolet absorber drometrizole. Contact Dermatitis. 2018; 79(2):110-112. DOI: 10.1111/cod.13007 PubMed: 29761506
63. Niklasson B, Björkner B. Contact allergy to the UV-absorber Tinuvin P in plastics. Contact Dermatitis. 1989; 21(5):330-334. DOI: 10.1111/j.1600-0536.1989.tb04753.x PubMed: 2620511
64. Tomar J, Jain VK, Aggarwal K, Dayal S, Gupta S. Contact allergies to cosmetics: Testing with 52 cosmetic ingredients and personal products. J Dermatol. 2005; 32(12):951-955. DOI: 10.1111/j.1346-8138.2005.tb00880.x PubMed: 16471456
65. Ikarashi Y, Tsuchiya T, Nakamura A. Contact sensitivity to Tinuvin P in mice. Contact Dermatitis. 1994; 30(4):226-230. DOI: 10.1111/j.1600-0536.1994.tb00649.x PubMed: 8033549
66. Ikarashi Y, Tsuchiya T, Nakamura A. Contact sensitivity of and cross-sensitivity between 2-(2′-hydroxy-5′-methylphenyl)benzotriazole (Tinuvin P) and 2-(2′-hydroxy-3′-tert-butyl-5′-methylphenyl)-5-chlorobenzotriazole (Tinuvin 326) evaluated by lymph node cell proliferation and ear swelling response in mice. Toxicol Lett. 1994; 71(2):151-159. DOI: 10.1016/0378-4274(94)90175-9 PubMed: 8171445
67. Environment and Climate Change Canada (ECCC), Health Canada. Screening assessment report on phenol, 2-(2H-benzotriazol-2-yl)-4,6-bis(1,1-dimethylpropyl)- (BDTP). Chemical Abstracts Service Registry Number 25973-55-1. Gatineau, Quebec, Canada: Environment and Climate Change Canada; 2016. [Accessed: July 28, 2023]. https://www.ec.gc.ca/ese-ees/default.asp?lang=En&n=78FEE504-1
68. Central Institute for Nutrition Research (TNO). Short-term (49-day) and sub-chronic (90-day) toxicity studies with “RY 1137” in rats. In: Four toxicity studies on Tinuvin 328 (CAS No. 25973-55-1) with cover letter dated 091388. Basil, Switzerland: Ciba-Geigy Corporation; 1988. Study report 2640. TCATS, Document 88-880000056. OTS0516611. [Accessed: August 7, 2023]. https://ntrl.ntis.gov/NTRL/dashboard/searchResults/titleDetail/OTS0516611.xhtml
69. Institut for Industrielle und Biologische Forschung (IIBF). Three-months toxicity study, Tinuvin 328, dietary administration - beagle dogs. In: Four toxicity studies on Tinuvin 328 (CAS No. 25973-55-1) with cover letter dated 091388. Basil, Switzerland: Ciba-Geigy Corporation; 1988. Study report A 0176/049. TCATS, Document 88-880000056. OTS0516611. [Accessed: August 7, 2023]. https://ntrl.ntis.gov/NTRL/dashboard/searchResults/titleDetail/OTS0516611.xhtml
70. Ema M, Fukunishi K, Hirose A, Hirata-Koizumi M, Matsumoto M, Kamata E. Repeated-dose and reproductive toxicity of the ultraviolet absorber 2-(3′,5′-di-tert-butyl-2′-hydroxyphenyl)-5-chlorobenzotriazole in rats. Drug Chem Toxicol. 2008; 31(3):399-412. DOI: 10.1080/01480540802171282 PubMed: 18622873
71. Hirata-Koizumi M, Ise R, Kato H, Matsuyama T, Nishimaki-Mogami T, Takahashi M, Ono A, Ema M, Hirose A. Transcriptome analyses demonstrate that Peroxisome Proliferator-Activated Receptor alpha (PPARalpha) activity of an ultraviolet absorber, 2-(2′-hydroxy-3′,5′-di-tert-butylphenyl)benzotriazole, as possible mechanism of their toxicity and the gender differences. J Toxicol Sci. 2016; 41(5):693-700. DOI: 10.2131/jts.41.693 PubMed: 27665778
72. Hirata-Koizumi M, Matsuno K, Kawabata M, Yajima K, Matsuyama T, Hirose A, Kamata E, Ema M. Gender-related difference in the toxicity of 2-(2′-hydroxy-3′,5′-di-tert-butylphenyl)benzotriazole in rats: Relationship to the plasma concentration, in vitro hepatic metabolism, and effects on hepatic metabolizing enzyme activity. Drug Chem Toxicol. 2009; 32(3):204-214. DOI: 10.1080/01480540902862244 PubMed: 19538016
73. Hirata-Koizumi M, Matsuyama T, Imai T, Hirose A, Kamata E, Ema M. Disappearance of gender-related difference in the toxicity of benzotriazole ultraviolet absorber in juvenile rats. Congenit Anom (Kyoto). 2009; 49(4):247-252. DOI: 10.1111/j.1741-4520.2009.00248.x PubMed: 20021483
74. Hirata-Koizumi M, Matsuyama T, Imai T, Hirose A, Kamata E, Ema M. Gonadal influence on the toxicity of 2-(2′-hydroxy-3′,5′-di-tert-butylphenyl) benzotriazole in rats. Drug Chem Toxicol. 2008; 31(1):115-126. DOI: 10.1080/01480540701688808 PubMed: 18161511
75. Hirata-Koizumi M, Ogata H, Imai T, Hirose A, Kamata E, Ema M. A 52-week repeated dose toxicity study of ultraviolet absorber 2-(2′-hydroxy-3′,5′-di-tert-butylphenyl)benzotriazole in rats. Drug Chem Toxicol. 2008; 31(1):81-96. DOI: 10.1080/01480540701688758 PubMed: 18161509
76. Hirata-Koizumi M, Watari N, Mukai D, Imai T, Hirose A, Kamata E, Ema M. A 28-day repeated dose toxicity study of ultraviolet absorber 2-(2′-hydroxy-3′,5′-di-tert-butylphenyl) benzotriazole in rats. Drug Chem Toxicol. 2007; 30(4):327-341. DOI: 10.1080/01480540701522254 PubMed: 17934922
77. Organisation for Economic Co-operation and Development (OECD). SIDS initial assessment report for SIAM 28: 2-tert-Butyl-6-(5-chloro-2H-benzotriazol-2-yl)-4-methylphenol. Paris, France: Organisation for Economic Co-operation and Development; 2009.
78. Organisation for Economic Co-operation and Development (OECD). Test no. 407: Repeated dose 28-day oral toxicity study in rodents. OECD guidelines for the testing of chemicals, section 4. Paris, France: OECD Publishing; 2008. 10.1787/9789264070684-en
79. Mutlu E, South N, Pierfelice J, Djonabaye A, Pauff M, Burback B, Waidyanatha S. Quantitation of phenolic benzotriazole class compounds in plasma by liquid chromatography-tandem mass spectrometry (LC-MS/MS). Anal Lett. 2022; 55(13):2074-2088. DOI: 10.1080/00032719.2022.2044348 PubMed: 36147651
80. National Toxicology Program (NTP). Specifications for the conduct of studies to evaluate the toxic and carcinogenic potential of chemical, biological and physical agents in laboratory animals for the National Toxicology Program (NTP). Research Triangle Park, NC: U.S. Department of Health and Human Services, Public Health Service, National Institutes of Health, National Toxicology Program; 2011.
81. Sills RC, Cesta MF, Willson CJ, Brix AE, Berridge BR. National Toxicology Program position statement on informed (“nonblinded”) analysis in toxicologic pathology evaluation. Toxicol Pathol. 2019; 47(7):887-890. DOI: 10.1177/0192623319873974 PubMed: 31522628
82. Maronpot RR, Boorman GA. Interpretation of rodent hepatocellular proliferative alterations and hepatocellular tumors in chemical safety assessment. Toxicol Pathol. 1982; 10(2):71-78. DOI: 10.1177/019262338201000210 PubMed: 28094716
83. Boorman GA, Haseman JK, Waters MD, Hardisty JF, Sills RC. Quality review procedures necessary for rodent pathology databases and toxicogenomic studies: The National Toxicology Program experience. Toxicol Pathol. 2002; 30(1):88-92. DOI: 10.1080/01926230252824752 PubMed: 11890481
84. Zhou Y, Vaidya VS, Brown RP, Zhang J, Rosenzweig BA, Thompson KL, Miller TJ, Bonventre JV, Goering PL. Comparison of kidney injury molecule-1 and other nephrotoxicity biomarkers in urine and kidney following acute exposure to gentamicin, mercury, and chromium. Toxicol Sci. 2008; 101(1):159-170. DOI: 10.1093/toxsci/kfm260 PubMed: 17934191
85. Song J, Yu J, Prayogo GW, Cao W, Wu Y, Jia Z, Zhang A. Understanding kidney injury molecule 1: A novel immune factor in kidney pathophysiology. Am J Transl Res. 2019; 11(3):1219-1229. PubMed: 30972157
86. Gart JJ, Chu KC, Tarone RE. Statistical issues in interpretation of chronic bioassay tests for carcinogenicity. J Natl Cancer Inst. 1979; 62(4):957-974. https://doi.org/10.1093/jnci/62.4.957. PubMed: 285297
87. Armitage P. Statistical methods in medical research. Oxford, UK: Blackwell Scientific; 1971.
88. Dunnett CW. A multiple comparison procedure for comparing several treatments with a control. J Am Stat Assoc. 1955; 50(272):1096-1121. DOI: 10.1080/01621459.1955.10501294
89. Williams DA. A test for differences between treatment means when several dose levels are compared with a zero dose control. Biometrics. 1971; 27(1):103-117. DOI: 10.2307/2528930 PubMed: 5547548
90. Williams DA. The comparison of several dose levels with a zero dose control. Biometrics. 1972; 28(2):519-531. DOI: 10.2307/2556164 PubMed: 5037867
91. Shirley E. A non-parametric equivalent of Williams’ test for contrasting increasing dose levels of a treatment. Biometrics. 1977; 33(2):386-389. DOI: 10.2307/2529789 PubMed: 884197
92. Williams DA. A note on Shirley’s nonparametric test for comparing several dose levels with a zero-dose control. Biometrics. 1986; 42(1):183-186. DOI: 10.2307/2531254 PubMed: 3719054
93. Dunn OJ. Multiple comparisons using rank sums. Technometrics. 1964; 6(3):241-252. DOI: 10.1080/00401706.1964.10490181
94. Jonckheere AR. A distribution-free k-sample test against ordered alternatives. Biometrika. 1954; 41(1-2):133-145. DOI: 10.1093/biomet/41.1-2.133
95. Dixon WJ, Massey FJ. Introduction to statistical analysis. 2nd ed. New York, NY: McGraw-Hill; 1957.
96. Livak KJ, Schmittgen TD. Analysis of relative gene expression data using real-time quantitative PCR and the 2(-delta delta C(T)) method. Methods. 2001; 25(4):402-408. DOI: 10.1006/meth.2001.1262 PubMed: 11846609
97. U.S. Food and Drug Administration (FDA). 21 CFR Part 58. https://www.ecfr.gov/current/title-21/chapter-I/subchapter-A/part-58
98. Miller JA, Miller EC. Ultimate chemical carcinogens as reactive mutagenic electrophiles. In: Hiatt HH, Watson JD, Winsten JA, editors. Origins of Human Cancer. Cold Spring Harbor, NY: Cold Spring Harbor Laboratory; 1977. p. 605–627.
99. Straus DS. Somatic mutation, cellular differentiation, and cancer causation. J Natl Cancer Inst. 1981; 67(2):233-241. https://doi.org/10.1093/jnci/67.2.233. PubMed: 7021938
100. Crawford BD. Perspectives on the somatic mutation model of carcinogenesis. In: Flamm WG, Lorentzen RJ, editors. Mechanisms and Toxicity of Chemical Carcinogens and Mutagens. Princeton, NJ: Princeton Scientific Publishing; 1985. p. 13–59.
101. Schmid W. The micronucleus test. Mutat Res. 1975; 31(1):9-15. DOI: 10.1016/0165-1161(75)90058-8 PubMed: 48190
102. Heddle JA, Hite M, Kirkhart B, Mavournin K, MacGregor JT, Newell GW, Salamone MF. The induction of micronuclei as a measure of genotoxicity: A report of the U.S. Environmental Protection Agency Gene-Tox Program. Mutat Res. 1983; 123(1):61-118. DOI: 10.1016/0165-1110(83)90047-7 PubMed: 6888413
103. Shelby MD, Erexson GL, Hook GJ, Tice RR. Evaluation of a three-exposure mouse bone marrow micronucleus protocol: Results with 49 chemicals. Environ Mol Mutagen. 1993; 21(2):160-179. DOI: 10.1002/em.2850210210 PubMed: 8444144
104. Shelby MD, Witt KL. Comparison of results from mouse bone marrow chromosome aberration and micronucleus tests. Environ Mol Mutagen. 1995; 25(4):302-313. DOI: 10.1002/em.2850250407 PubMed: 7607185
105. Witt KL, Knapton A, Wehr CM, Hook GJ, Mirsalis J, Shelby MD, MacGregor JT. Micronucleated erythrocyte frequency in peripheral blood of B6C3F(1) mice from short-term, prechronic, and chronic studies of the NTP carcinogenesis bioassay program. Environ Mol Mutagen. 2000; 36(3):163-194. 10.1002/1098-2280(2000)36:3<163::AID-EM1>3.0.CO;2-P
106. National Toxicology Program (NTP). TOX-108: Pathology tables, survival and growth curves from NTP short-term, genetic toxicology studies. Research Triangle Park, NC: U.S. Department of Health and Human Services, Public Health Service, National Toxicology Program; 2025. 10.22427/NTP-DATA-TOX-108
107. Yang J, Yang X, Zhang YF, Tian JN, Fan SC, Gao Y, Li HL, Cai CH, Huang M, Bi HC. Peroxisome proliferator-activated receptor α agonist induces mouse hepatomegaly through the spatial hepatocyte enlargement and proliferation. Acta Pharmacol Sin. 2023; 44(10):2037-2047. DOI: 10.1038/s41401-023-01096-5 PubMed: 37193756
108. Qin X, Zhang Y, Lu J, Huang S, Liu Z, Wang X. CYP3A deficiency alters bile acid homeostasis and leads to changes in hepatic susceptibility in rats. Toxicol Appl Pharmacol. 2021; 429:115703. DOI: 10.1016/j.taap.2021.115703 PubMed: 34461081
109. Hirata-Koizumi M, Matsuyama T, Imai T, Hirose A, Kamata E, Ema M. Gender-related difference in the toxicity of ultraviolet absorber 2-(3′,5′-di-tert-butyl-2′-hydroxyphenyl)-5-chlorobenzotriazole in rats. Drug Chem Toxicol. 2008; 31(3):383-398. DOI: 10.1080/01480540802171431 PubMed: 18622872
110. Ohta R, Takagi A, Ohmukai H, Marumo H, Ono A, Matsushima Y, Inoue T, Ono H, Kanno J. Ovariectomized mouse uterotrophic assay of 36 chemicals. J Toxicol Sci. 2012; 37(5):879-889. DOI: 10.2131/jts.37.879 PubMed: 23037998
111. Maffini MV, Rayasam SDG, Axelrad DA, Birnbaum LS, Cooper C, Franjevic S, MacRoy PM, Nachman KE, Patisaul HB, Rodgers KM, et al. Advancing the science on chemical classes. Environ Health. 2023; 21 Suppl 1:120. DOI: 10.1186/s12940-022-00919-y PubMed: 36635752
112. Advanced Chemistry Development (ACD/Labs). NMR Predictors, version 14.00. Toronto, Ontario, Canada: Advanced Chemistry Development; 2015. https://www.acdlabs.com/products/spectrus-platform/nmr-predictors/
113. National Institute of Advanced Industrial Science and Technology (AIST). Spectral Database for Organic Compounds: SDBS-7180. Tokyo, Japan: National Institute of Advanced Industrial Science and Technology; 1999. [Accessed: July 2023]. https://sdbs.db.aist.go.jp/CompoundLanding.aspx?sdbsno=7180
114. Sadtler Research Laboratories. Sadtler Alcohols and Phenols Library: No. OMX-1352. Hercules, CA: Bio-Rad Laboratories; 2015.
115. National Center for Biotechnology Information (NCBI). PubChem compound summary for CID 17113, drometrizole: Chemical and physical properties. Bethesda, MD: U.S. Department of Health and Human Services, National Institutes of Health, National Library of Medicine, National Center for Biotechnology Information; 2023. [Accessed: July 2023]. https://pubchem.ncbi.nlm.nih.gov/compound/17113#section=Chemical-and-Physical-Properties
116. Royal Society of Chemistry (RSC). ChemSpider: 2-(2H-benzotriazol-2-yl)-4-tert-butylphenol. London, UK: Royal Society of Chemistry; 2015. [Accessed: July 2023]. https://www.chemspider.com/Chemical-Structure.69069.html
117. Bio-Rad Laboratories (Bio-Rad). KnowItAll, version 14.1.209.0: No. HSX-5839. Hercules, CA: Bio-Rad Laboratories; 2015.
118. Royal Society of Chemistry (RSC). ChemSpider: Octrizole. London, UK: Royal Society of Chemistry; 2015. [Accessed: July 2023]. https://www.chemspider.com/Chemical-Structure.56265.html
119. Royal Society of Chemistry (RSC). ChemSpider: 2-(2H-benzotriazol-2-yl)-4,6-di-tert-pentylphenol. London, UK: Royal Society of Chemistry; 2015. [Accessed: July 2023]. https://www.chemspider.com/Chemical-Structure.30728.html
120. Sadtler Research Laboratories. Sadtler Alcohols and Phenols Library: No. OMX-1348. Hercules, CA: Bio-Rad Laboratories; 2015.
121. National Institute of Advanced Industrial Science and Technology (AIST). Spectral Database for Organic Compounds: SDBS-52954. Tokyo, Japan: National Institute of Advanced Industrial Science and Technology; 2012. [Accessed: July 2023]. https://sdbs.db.aist.go.jp/CompoundLanding.aspx?sdbsno=52954
122. Royal Society of Chemistry (RSC). ChemSpider: 2-(2H-benzotriazol-2-yl)-4,6-bis(2-phenyl-2-propanyl)phenol. London, UK: Royal Society of Chemistry; 2015. [Accessed: July 2023]. https://www.chemspider.com/Chemical-Structure.100754.html
123. Advanced Chemistry Development (ACD/Labs). MS Fragmenter. Toronto, Ontario, Canada: Advanced Chemistry Development; 2015. https://www.acdlabs.com/products/spectrus-platform/ms-fragmenter/
124. Sadtler Research Laboratories. Sadtler UV Light Absorbers; Amines; Compounds Containing Halogen Library: No. BPX-1180. Hercules, CA: Bio-Rad Laboratories; 2015.
125. Royal Society of Chemistry (RSC). ChemSpider: Bumetrizole. London, UK: Royal Society of Chemistry; 2015. [Accessed: July 2023]. https://www.chemspider.com/Chemical-Structure.56304.html
126. National Institute of Advanced Industrial Science and Technology (AIST). Spectral Database for Organic Compounds: SDBS-7557. Tokyo, Japan: National Institute of Advanced Industrial Science and Technology; 1999. [Accessed: July 2023]. https://sdbs.db.aist.go.jp/CompoundLanding.aspx?sdbsno=7557
127. Royal Society of Chemistry (RSC). ChemSpider: 2,4-Di-tert-butyl-6-(5-chlorobenzotriazol-2-yl)phenol. London, UK: Royal Society of Chemistry; 2015. [Accessed: July 2023]. https://www.chemspider.com/Chemical-Structure.69879.html
128. Witt KL, Livanos E, Kissling GE, Torous DK, Caspary W, Tice RR, Recio L. Comparison of flow cytometry- and microscopy-based methods for measuring micronucleated reticulocyte frequencies in rodents treated with nongenotoxic and genotoxic chemicals. Mutat Res. 2008; 649(1-2):101-113. DOI: 10.1016/j.mrgentox.2007.08.004 PubMed: 17869571
129. Dertinger SD, Camphausen K, MacGregor JT, Bishop ME, Torous DK, Avlasevich S, Cairns S, Tometsko CR, Menard C, Muanza T, et al. Three‐color labeling method for flow cytometric measurement of cytogenetic damage in rodent and human blood. Environ Mol Mutagen. 2004; 44(5):427-435. DOI: 10.1002/em.20075 PubMed: 15517570
130. Hsieh JH, Sedykh A, Huang R, Xia M, Tice RR. A data analysis pipeline accounting for artifacts in Tox21 quantitative high-throughput screening assays. J Biomol Screen. 2015; 20(7):887-897. DOI: 10.1177/1087057115581317 PubMed: 25904095
131. Hubbard TD, Hsieh JH, Rider CV, Sipes NS, Sedykh A, Collins BJ, Auerbach SS, Xia M, Huang R, Walker NJ, et al. Using Tox21 high-throughput screening assays for the evaluation of botanical and dietary supplements. Appl In Vitro Toxicol. 2019; 5(1):10-25. DOI: 10.1089/aivt.2018.0020 PubMed: 30944845
132. Sedykh A. CurveP method for rendering high-throughput screening dose-response data into digital fingerprints. In: Zhu H, Xia M, editors. High-Throughput Screening Assays in Toxicology. New York, NY: Humana Press; 2016. p. 135-141. 10.1007/978-1-4939-6346-1_14
133. U.S. Environmental Protection Agency (USEPA). CompTox Chemicals Dashboard: 2-(2H-benzotriazol-2-yl)-4-methylphenol: 2440-22-4 | DTXSID1027479: Bioactivity - TOXCAST summary. Washington, DC: U.S. Environmental Protection Agency; 2023. [Accessed: November 16, 2023]. https://comptox.epa.gov/dashboard/chemical/invitrodb/DTXSID1027479
134. Judson RS, Thomas RS, Baker N, Simha A, Howey XM, Marable C, Kleinstreuer NC, Houck KA. Workflow for defining reference chemicals for assessing performance of in vitro assays. ALTEX. 2019; 36(2):261-276. DOI: 10.14573/altex.1809281 PubMed: 30570668
Appendices
Appendix A. Chemical Characterization and Dose Formulation Studies
A.1. Procurement and Characterization of Phenolic Benzotriazoles
Reports on analyses performed in support of the phenolic benzotriazole studies are on file at the National Institute of Environmental Health Sciences (NIEHS).
A.1.1. 2-(2H-benzotriazol-2-yl)phenol (P-BZT)
2-(2H-benzotriazol-2-yl)phenol (P-BZT) was obtained from Richman Chemical (Lower Gwynedd, PA) in a single lot (373PAL021). After homogenization of the original lot, a portion was sieved, oven-dried to remove water, and assigned a new lot number (09042015) to use as the test article. Identity, purity, and stability analyses were conducted by the analytical chemistry laboratory at Battelle (Columbus, OH).
Lot 09042015, a tan powder, was identified as P-BZT using Fourier transform infrared (FTIR), 1H nuclear magnetic resonance (NMR), and 13C NMR spectroscopy. The FTIR spectrum (Figure A-1) was consistent with the proposed structure of P-BZT. The 1H and 13C NMR spectra (Figure A-2, Figure A-3) were consistent with the proposed structure and the predicted spectra from the Advanced Chemistry Development (ACD) NMR spectral prediction program.112 The 1H NMR spectrum also showed the presence of an impurity, methyl tert-butyl ether (MTBE). Elemental analysis was performed by Galbraith Laboratories, Inc. (Knoxville, TN) for identification. The relative amounts of carbon (67.08%), hydrogen (4.40%), and nitrogen (19.70%) were within 2% of the theoretical values. The relative amount of oxygen (7.16%) was within 6% of the theoretical value; oxygen values for all nine phenolic benzotriazoles were analyzed at the same time, and all nine were low, suggesting a systematic error in the analyses.
112. Advanced Chemistry Development (ACD/Labs). NMR Predictors, version 14.00. Toronto, Ontario, Canada: Advanced Chemistry Development; 2015. https://www.acdlabs.com/products/spectrus-platform/nmr-predictors/
The lot 09042015 purity was determined by the analytical chemistry laboratory using high-performance liquid chromatography (HPLC) with ultraviolet (UV) detection, gas chromatography (GC) with flame ionization detection (FID), and differential scanning calorimetry (DSC). The HPLC/UV spectrum had one major peak accounting for 99.8% and one reportable impurity accounting for 0.2% of the total integrated peak area (Table A-1, System A). Initial GC/FID analysis indicated 100% sample purity with no reportable impurity peaks ≥0.1% (Table A-2, System H). Subsequent GC/FID analysis was conducted to determine the volatile content using four halogenated and six nonhalogenated standards (Table A-2, System I). Volatile content analysis showed that the sample contained 0.11% MTBE, 0.03% toluene, and ≤0.012% benzene. The DSC thermogram reported the sample was 99.5% P-BZT with an average measured melting point of 127.4°C. The moisture content was determined by Karl Fischer titration performed at Galbraith Laboratories (Knoxville, TN) and thermal gravimetric analysis (TGA) conducted by the analytical chemistry laboratory. Karl Fischer titration yielded a water content of ≤0.1%. TGA measured no detectable volatile or nonvolatile impurities, and the evaporation transition was consistent with an identity of P-BZT. The overall purity of lot 09042015 was determined to be >99%.
Accelerated stability studies were conducted using HPLC/UV (Table A-1, System A). Lot 09042015 was stored under an inert headspace in amber glass vials at frozen (−20°C), refrigerated (5°C), room (25°C), and elevated (60°C) temperatures for 2 weeks and then analyzed for purity relative to a frozen (−20°C) reference sample. Stability was confirmed for at least 2 weeks when stored under an inert headspace and protected from light at temperatures ≤60°C.
The bulk chemical from the original lot 373PAL021 was homogenized in the receipt container (plastic bag) by first double bagging and then kneading and turning for about 12 minutes. After drying and sieving, the newly created, homogenized test article (lot 09042015) was repacked into amber glass bottles with an inert headspace, sealed with Teflon-lined lids, and stored at room temperature in a foil bag with desiccant.
A.1.2. 2-(2H-benzotriazol-2-yl)-4-methylphenol (Drometrizole)
2-(2H-benzotriazol-2-yl)-4-methylphenol (drometrizole) was obtained from Gojira Fine Chemicals, LLC (Bedford Heights, OH) in a single lot (120935). Identity, purity, and stability analyses were conducted by the analytical chemistry laboratory at Battelle (Columbus, OH).
Lot 120935, a light yellow powder, was identified as drometrizole using FTIR, 1H NMR, and 13C NMR. The FTIR, 1H NMR, and 13C NMR spectra (Figure A-4, Figure A-5, Figure A-6) were consistent with the proposed structure of drometrizole and with reference spectra.113,114 The octanol/water partition coefficient (log P) was determined by HPLC/UV (Table A-1, System B). The determined average log P (4.31) for drometrizole was consistent with the calculated values (4.31) from the literature115 and from ACD.112 Elemental analysis was performed by Galbraith Laboratories, Inc. for identification. The relative amounts of carbon (69.36%), hydrogen (5.10%), and nitrogen (18.80%) were within 4% of the theoretical values. The relative amount of oxygen (6.31%) was within 12% of the theoretical value; oxygen values for all nine phenolic benzotriazoles were analyzed at the same time, and all nine were low, suggesting a systematic error in the analyses.
113. National Institute of Advanced Industrial Science and Technology (AIST). Spectral Database for Organic Compounds: SDBS-7180. Tokyo, Japan: National Institute of Advanced Industrial Science and Technology; 1999. [Accessed: July 2023]. https://sdbs.db.aist.go.jp/CompoundLanding.aspx?sdbsno=7180
114. Sadtler Research Laboratories. Sadtler Alcohols and Phenols Library: No. OMX-1352. Hercules, CA: Bio-Rad Laboratories; 2015.
115. National Center for Biotechnology Information (NCBI). PubChem compound summary for CID 17113, drometrizole: Chemical and physical properties. Bethesda, MD: U.S. Department of Health and Human Services, National Institutes of Health, National Library of Medicine, National Center for Biotechnology Information; 2023. [Accessed: July 2023]. https://pubchem.ncbi.nlm.nih.gov/compound/17113#section=Chemical-and-Physical-Properties
112. Advanced Chemistry Development (ACD/Labs). NMR Predictors, version 14.00. Toronto, Ontario, Canada: Advanced Chemistry Development; 2015. https://www.acdlabs.com/products/spectrus-platform/nmr-predictors/
The lot 120935 purity was determined by the analytical chemistry laboratory using HPLC/UV, GC/FID, and DSC. The HPLC/UV spectrum had one major peak accounting for 100% of the total integrated peak area and no reportable impurity peaks ≥0.1% (Table A-1, System A). Initial GC/FID analysis indicated 99.9% sample purity with one reportable impurity with peak area ≥0.1% of the total integrated peak area (Table A-2, System H). Subsequent GC/FID analysis was conducted to determine the volatile content using four halogenated and six nonhalogenated standards (Table A-2, System I). The sample did not contain quantifiable (≥0.01%) amounts of any of the tested volatiles. The DSC thermogram reported the sample was 99.9% drometrizole with an average measured melting point of 131.3°C. The moisture content was determined by Karl Fischer titration performed at Galbraith Laboratories, Inc. and TGA. Karl Fischer titration yielded a water content of <0.1%. TGA measured no detectable volatile or nonvolatile impurities, and the evaporation transition was consistent with an identity of drometrizole. The overall purity of lot 120935 was determined to be >99%.
Accelerated stability studies were conducted using HPLC/UV (Table A-1, System A). Lot 120935 was stored in sealed amber glass vials at frozen, refrigerated, room, and elevated temperatures for 2 weeks and then analyzed for purity relative to a frozen (−20°C) reference sample. Stability was confirmed for at least 2 weeks when stored protected from light at temperatures ≤60°C. The bulk chemical was transferred from the original glass bottles into a plastic bag, double bagged, and then homogenized by kneading and turning for about 12 minutes. The homogenized test article was repacked into amber glass bottles, sealed with Teflon-lined lids, and stored at room temperature.
A.1.3. 2-(2H-benzotriazol-2-yl)-4-tert-butylphenol (tBu-BZT)
2-(2H-benzotriazol-2-yl)-4-tert-butylphenol (tBu-BZT) was obtained from TCI America (Portland, OR) in a single lot (IDRWA). Identity, purity, and stability analyses were conducted by the analytical chemistry laboratory at Battelle (Columbus, OH).
Lot IDRWA, a white to pale yellow crystal powder, was identified as tBu-BZT using FTIR, 1H NMR, and 13C NMR. The FTIR spectrum (Figure A-7) was consistent with the structure of tBu-BZT. The 1H NMR and 13C NMR spectra (Figure A-8, Figure A-9) were consistent with the structure of tBu-BZT and with predicted reference spectra.112 The log P was determined by HPLC/UV (Table A-1, System C). The observed average log P (5.89) for tBu-BZT was greater than the predicted value (4.36).116 Elemental analysis was performed by Galbraith Laboratories, Inc. to aid in identification. The relative amounts of carbon (71.76%), hydrogen (6.55%), and nitrogen (15.82%) were within 3% of the theoretical values. The relative amount of oxygen (5.49%) was within 9% of the theoretical value; oxygen values for all nine phenolic benzotriazoles were analyzed at the same time, and all nine were low, suggesting a systematic error in the analyses.
112. Advanced Chemistry Development (ACD/Labs). NMR Predictors, version 14.00. Toronto, Ontario, Canada: Advanced Chemistry Development; 2015. https://www.acdlabs.com/products/spectrus-platform/nmr-predictors/
116. Royal Society of Chemistry (RSC). ChemSpider: 2-(2H-benzotriazol-2-yl)-4-tert-butylphenol. London, UK: Royal Society of Chemistry; 2015. [Accessed: July 2023]. https://www.chemspider.com/Chemical-Structure.69069.html
The purity of lot IDRWA was determined by the analytical chemistry laboratory using HPLC/UV, HPLC/CAD (charged aerosol detection), GC/FID, and DSC. HPLC/UV and HPLC/CAD spectra each had one major peak accounting for 100% of the total integrated peak area and no reportable impurity peaks ≥0.1% (Table A-1, System A and System D). Initial GC/FID analysis indicated 100% sample purity with no reportable impurities with peak area ≥0.1% of the total integrated peak area (Table A-2, System H). Subsequent GC/FID analysis was conducted to determine the volatile content using four halogenated and six nonhalogenated standards (Table A-2, System I). The sample did not contain quantifiable (≥0.01%) amounts of any of the tested volatiles. The DSC thermogram reported the sample was 99.9% tBu-BZT with an average measured melting point of 99.3°C. The moisture content was determined by Karl Fischer titration performed at Galbraith Laboratories, Inc. and TGA conducted by the analytical chemistry laboratory. Karl Fischer titration yielded a water content of <0.1%. TGA measured no detectable volatile or nonvolatile impurities, and the evaporation transition was consistent with an identity of tBu-BZT. The overall purity of lot IDRWA was determined to be ≥99.9%.
Accelerated stability studies were conducted using HPLC/UV (Table A-1, System A). Lot IDRWA was stored in sealed amber glass vials at frozen, refrigerated, room, and elevated temperatures for 2 weeks and then analyzed for purity relative to a frozen (−20°C) reference sample. Stability was confirmed for at least 2 weeks when stored protected from light at temperatures ≤60°C. The bulk chemical was transferred from the original glass bottles into a plastic bag, double bagged, and then homogenized by kneading and turning for about 12 minutes. The homogenized test article was repacked into amber glass bottles and stored at room temperature.
A.1.4. 2-(2H-benzotriazol-2-yl)-4-(1,1,3,3-tetramethylbutyl)phenol (Octrizole)
2-(2H-benzotriazol-2-yl)-4-(1,1,3,3-tetramethylbutyl)phenol (octrizole) was obtained from Gojira Fine Chemicals, LLC (Bedford Heights, OH) in a single lot (120932). Identity, purity, and stability analyses were conducted by the analytical chemistry laboratory at Battelle (Columbus, OH).
Lot 120932, a white to off-white powder, was identified as octrizole using FTIR, 1H NMR, and 13C NMR. The FTIR spectrum (Figure A-10) was consistent with a reference spectrum.117 The 1H NMR and 13C NMR spectra (Figure A-10, Figure A-11) were consistent with the proposed structure of octrizole and with predicted reference spectra.112 The log P was determined by HPLC/UV (Table A-1, System C). The observed average log P (7.64) for octrizole was greater than the predicted value (6.21).118 Elemental analysis was performed by Galbraith Laboratories, Inc. to aid in identification. The relative amounts of carbon (74.37%), hydrogen (7.94%), and nitrogen (13.10%) were within 2% of the theoretical values. The relative amount of oxygen (4.33%) was within 13% of the theoretical value; oxygen values for all nine phenolic benzotriazoles were analyzed at the same time, and all nine were low, suggesting a systematic error in the analyses.
117. Bio-Rad Laboratories (Bio-Rad). KnowItAll, version 14.1.209.0: No. HSX-5839. Hercules, CA: Bio-Rad Laboratories; 2015.
112. Advanced Chemistry Development (ACD/Labs). NMR Predictors, version 14.00. Toronto, Ontario, Canada: Advanced Chemistry Development; 2015. https://www.acdlabs.com/products/spectrus-platform/nmr-predictors/
118. Royal Society of Chemistry (RSC). ChemSpider: Octrizole. London, UK: Royal Society of Chemistry; 2015. [Accessed: July 2023]. https://www.chemspider.com/Chemical-Structure.56265.html
The purity of lot 120932 was determined by the analytical chemistry laboratory using HPLC/UV, HPLC/CAD, GC/FID, and DSC. HPLC/UV analysis demonstrated one major peak accounting for 98.4% of the total integrated peak area and one reportable impurity peak of 1.6% (Table A-1, System F). The HPLC/CAD spectrum had one major peak accounting for 98.4% of the total integrated peak area and one reportable impurity accounting for 1.6% (Table A-1, System G). Initial GC/FID analysis indicated an almost identical composition to the two HPLC methods, indicating 98.7% sample purity with one reportable impurity peak of 1.3% (Table A-2, System H). Subsequent GC/FID analysis was conducted to determine the volatile content using four halogenated and six nonhalogenated standards (Table A-2, System I). Volatile content analysis showed that the sample contained 0.06% toluene. The DSC thermogram reported the sample was 99.7% octrizole with an average measured melting point of 104.7°C. The moisture content was determined by Karl Fischer titration performed at Galbraith Laboratories, Inc. and TGA conducted by the analytical chemistry laboratory. Karl Fischer titration yielded a water content of <0.1%. TGA measured no detectable volatile or nonvolatile impurities, and the evaporation transition was consistent with an identity of octrizole.
GC coupled with mass selective detection (GC/MSD) and HPLC coupled with mass spectrometry (HPLC/MS) were used to identify the impurity. MSD analysis of the major GC peak was consistent with the molecular weight and predicted fragmentation pattern of octrizole from the ACD MS Fragmenter prediction program (2015, Advanced Chemistry Development Inc., Toronto, Ontario) (Table A-2, System J). The one impurity peak had the same MSD mass cluster, suggesting the identity of the impurity as an isomer of octrizole. HPLC/MS analysis identified the major peak as octrizole and the impurity peak as an isomer of octrizole with an almost identical mass spectrum (Table A-1, System E). The overall purity of lot 120932 was determined to be ≥98.4%.
Accelerated stability studies were conducted using HPLC/UV (Table A-1, System F). Lot 120932 was stored in sealed amber glass vials at frozen, refrigerated, room, and elevated temperatures for 2 weeks and then analyzed for purity relative to a frozen (−20°C) reference sample. Stability was confirmed for at least 2 weeks when stored protected from light at temperatures ≤60°C. The bulk chemical was homogenized in the plastic bag it was received in by kneading and turning for about 12 minutes, repacked into amber glass bottles, sealed with Teflon-lined lids, and stored at room temperature.
A.1.5. 2-(2H-benzotriazol-2-yl)-4,6-bis(1,1-dimethylpropyl)phenol (ditPe-BZT)
2-(2H-benzotriazol-2-yl)-4,6-bis(1,1-dimethylpropyl)phenol (ditPe-BZT) was obtained from Gojira Fine Chemicals, LLC (Bedford Heights, OH) in a single lot (120933). Identity, purity, and stability analyses were conducted by the analytical chemistry laboratory at Battelle (Columbus, OH).
Lot 120933, a light yellow powder, was identified as ditPe-BZT using FTIR, 1H NMR, and 13C NMR. The FTIR spectrum (Figure A-13) was consistent with the structure of ditPe-BZT. The 1H NMR, and 13C NMR spectra (Figure A-14, Figure A-15) were also consistent with the proposed structure of ditPe-BZT and the predicted spectra.112 The log P was determined by HPLC/UV (Table A-1, System C). The determined average log P (9.44) for ditPe-BZT was greater than the predicted values from the literature (7.25)119 and the ACD calculated value (7.872 ± 1.2540).112 Elemental analysis was performed by Galbraith Laboratories, Inc. to aid in identification. The relative amounts of carbon (75.33%), hydrogen (8.41%), and nitrogen (12.06%) were within 2% of the theoretical values. The relative amount of oxygen (4.04%) was within 12% of the theoretical value; oxygen values for all nine phenolic benzotriazoles were analyzed at the same time, and all nine were low, suggesting a systematic error in the analyses.
112. Advanced Chemistry Development (ACD/Labs). NMR Predictors, version 14.00. Toronto, Ontario, Canada: Advanced Chemistry Development; 2015. https://www.acdlabs.com/products/spectrus-platform/nmr-predictors/
119. Royal Society of Chemistry (RSC). ChemSpider: 2-(2H-benzotriazol-2-yl)-4,6-di-tert-pentylphenol. London, UK: Royal Society of Chemistry; 2015. [Accessed: July 2023]. https://www.chemspider.com/Chemical-Structure.30728.html
112. Advanced Chemistry Development (ACD/Labs). NMR Predictors, version 14.00. Toronto, Ontario, Canada: Advanced Chemistry Development; 2015. https://www.acdlabs.com/products/spectrus-platform/nmr-predictors/
The purity of lot 120933 was determined by the analytical chemistry laboratory using HPLC/UV, HPLC/CAD, GC/FID, and DSC. HPLC/UV and HPLC/CAD spectra each had one major peak accounting for 100% of the total integrated peak area and no reportable impurity peaks ≥0.1% (Table A-1, System A and System D, respectively). Initial GC/FID analysis indicated 100% sample purity with no reportable impurities with peak area ≥0.1% of the total integrated peak area (Table A-2, System H). Subsequent GC/FID analysis was conducted to determine the volatile content using four halogenated and six nonhalogenated standards (Table A-2, System I). The sample did not contain quantifiable amounts of any of the tested volatiles. The DSC thermogram reported the sample was 99.8% ditPe-BZT with an average measured melting point of 81.7°C. The moisture content was determined by Karl Fischer titration performed at Galbraith Laboratories, Inc. and TGA conducted by the analytical chemistry laboratory. Karl Fischer titration yielded a water content of <0.1%. TGA measured no detectable volatile or nonvolatile impurities, and the evaporation transition was consistent with an identity of ditPe-BZT. The overall purity of lot 120933 was determined to be >99%.
Accelerated stability studies were conducted using HPLC/UV (Table A-1, System A). Lot 120933 was stored in sealed amber glass vials at frozen, refrigerated, room, and elevated temperatures for 2 weeks and then analyzed for purity relative to a frozen (−20°C) reference sample. Stability was confirmed for at least 2 weeks when stored protected from light at temperatures ≤60°C. The bulk chemical was homogenized in the plastic bag it was received in by first double bagging and then kneading and turning for about 12 minutes; it was then repacked into amber glass bottles and stored at room temperature.
A.1.6. 2-(2H-benzotriazol-2-yl)-4,6-bis(1-methyl-1-phenylethyl)phenol (diMeEtPh-BZT)
2-(2H-benzotriazol-2-yl)-4,6-bis(1-methyl-1-phenylethyl)phenol (diMeEtPh-BZT) was obtained from Gojira Fine Chemicals, LLC (Bedford Heights, OH) in a single lot (120934). Identity, purity, and stability analyses were conducted by the analytical chemistry laboratory at Battelle (Columbus, OH).
Lot 120934, a light yellow to off-white powder, was identified as diMeEtPh-BZT using FTIR, 1H NMR, and 13C NMR. The FTIR spectrum (Figure A-16) was consistent with the proposed structure of P-BZT and the reference spectrum.120 The 1H and 13C NMR spectra (Figure A-17, Figure A-18) were also consistent with the proposed structure and reference spectra.121 The log P was determined by HPLC/UV (Table A-1, System C). The observed average log P (8.0) for diMeEtPh-BZT was close to the predicted value (7.67).122 Elemental analysis was performed by Galbraith Laboratories, Inc. to aid in identification. The relative amounts of carbon (80.59%), hydrogen (6.67%), and nitrogen (9.45%) were within 2% of the theoretical values. The relative amount of oxygen (2.98%) was within 17% of the theoretical value; oxygen values for all nine phenolic benzotriazoles were analyzed at the same time, and all nine were low, suggesting a systematic error in the analyses.
120. Sadtler Research Laboratories. Sadtler Alcohols and Phenols Library: No. OMX-1348. Hercules, CA: Bio-Rad Laboratories; 2015.
121. National Institute of Advanced Industrial Science and Technology (AIST). Spectral Database for Organic Compounds: SDBS-52954. Tokyo, Japan: National Institute of Advanced Industrial Science and Technology; 2012. [Accessed: July 2023]. https://sdbs.db.aist.go.jp/CompoundLanding.aspx?sdbsno=52954
122. Royal Society of Chemistry (RSC). ChemSpider: 2-(2H-benzotriazol-2-yl)-4,6-bis(2-phenyl-2-propanyl)phenol. London, UK: Royal Society of Chemistry; 2015. [Accessed: July 2023]. https://www.chemspider.com/Chemical-Structure.100754.html
The purity of lot 120934 was determined by the analytical chemistry laboratory using HPLC/UV, HPLC/CAD, GC/FID, and DSC. HPLC/UV and HPLC/CAD spectra each had one major peak accounting for 100% of the total integrated peak area and no reportable impurity peaks ≥0.1% (Table A-1, System A and System D, respectively). Initial GC/FID analysis indicated 100% sample purity with no reportable impurities with peak area ≥0.1% of the total integrated peak area (Table A-2, System H). Subsequent GC/FID analysis was conducted to determine the volatile content using four halogenated and six nonhalogenated standards (Table A-2, System I). Volatile content analysis indicated that the sample contained 0.01% toluene and no significant amounts of any other tested volatiles. The DSC thermogram reported the sample was 99.6% diMeEtPh-BZT with an average measured melting point of 140.6°C. The moisture content was determined by Karl Fischer titration performed at Galbraith Laboratories, Inc. and TGA conducted by the analytical chemistry laboratory. Karl Fischer titration yielded a water content of <0.1%. TGA measured no detectable volatile or nonvolatile impurities, and the evaporation transition was consistent with an identity of diMeEtPh-BZT. The overall purity of lot 120934 was determined to be >99%.
Accelerated stability studies were conducted using HPLC/UV (Table A-1, System A). Lot 120934 was stored in sealed amber glass vials at frozen, refrigerated, room, and elevated temperatures for 2 weeks and then analyzed for purity relative to a frozen (−20°C) reference sample. Stability was confirmed for at least 2 weeks when stored protected from light at temperatures ≤60°C. The bulk chemical was homogenized in the plastic bag it was received in by first double bagging and then kneading and turning for about 12 minutes; it was then repacked into amber glass bottles with Teflon-lined lids and stored at room temperature.
A.1.7. 3-(2H-benzotriazol-2-yl)-5-(1,1-dimethylethyl)-4-hydroxybenzenepropanoic acid, octyl ester (tBuPrOcEst-BZT)
3-(2H-benzotriazol-2-yl)-5-(1,1-dimethylethyl)-4-hydroxybenzenepropanoic acid, octyl ester (tBuPrOcEst-BZT) was obtained from Richman Chemical in a single lot (354PAL67). Lot 354PAL67 was melted in the original containers in a water bath, dried in a vacuum oven, and stored in a large high-density polyethylene container. The handled and restored test article was assigned a new lot number (09022015). Identity, purity, and stability analyses were conducted by the analytical chemistry laboratory at Battelle (Columbus, OH).
Lot 09022015, an off-white solid, was identified as tBuPrOcEst-BZT using FTIR, 1H NMR, 13C NMR, and GC/MSD. The FTIR spectra (Figure A-19) were consistent with the proposed structure of tBuPrOcEst-BZT. The 1H and 13C NMR spectra (Figure A-20, Figure A-21) were consistent with the proposed structure and the predicted spectra.112 The 1H NMR also showed the presence of an impurity, tentatively identified as 3-(2H-benzotriazol-2-yl)-5-(1,1-dimethylethyl)-4-hydroxybenzenepropanoic acid, ethyl ester. GC/MSD analysis indicated one major peak consistent with the molecular weight of tBuPrOcEst-BZT and a fragmentation scheme that was consistent with the predicted mass spectral fragmentation from ACD/MS Fragmenter (Table A-2, System J).123 Elemental analysis was performed by Galbraith Laboratories, Inc. to aid in identification. The relative amounts of carbon (71.87%), hydrogen (8.41%), nitrogen (9.21%), and oxygen (10.35%) were within 3% of the theoretical values. Oxygen values for all nine phenolic benzotriazoles were analyzed at the same time, and all nine were low, suggesting a systematic error in the analyses.
112. Advanced Chemistry Development (ACD/Labs). NMR Predictors, version 14.00. Toronto, Ontario, Canada: Advanced Chemistry Development; 2015. https://www.acdlabs.com/products/spectrus-platform/nmr-predictors/
123. Advanced Chemistry Development (ACD/Labs). MS Fragmenter. Toronto, Ontario, Canada: Advanced Chemistry Development; 2015. https://www.acdlabs.com/products/spectrus-platform/ms-fragmenter/
The purity of lot 09022015 was determined by the analytical chemistry laboratory using HPLC/UV, GC/FID, and DSC. The HPLC/UV spectrum had one major peak accounting for 96.8% of the total integrated peak area and four reportable impurity peaks ≥0.1% (Table A-1, System A). Initial GC/FID analysis indicated 96.9% sample purity with four reportable impurities, each with a peak area ≥0.1% of the total integrated peak area (Table A-2, System H). The one impurity peak was tentatively identified by its GC/MSD spectrum as 3-(2H-benzotriazol-2-yl)-5-(1,1-dimethylethyl)-4-hydroxybenzenepropanoic acid, ethyl ester, comprising 1.5% of the total integrated peak area. No other additional impurities could be identified with MS. Subsequent GC/FID analysis was conducted to determine the volatile content using four halogenated and six nonhalogenated standards (Table A-2, System I). Volatile content analysis indicated that the sample contained 0.20% toluene and 0.14% heptane. The DSC thermogram reported the sample was 96.6% tBuPrOcEst-BZT with an average measured melting point of 31.6°C. The moisture content was determined by Karl Fischer titration performed at Galbraith Laboratories, Inc. and TGA conducted by the analytical chemistry laboratory. Karl Fischer titration yielded a water content of <0.1%. TGA measured no detectable volatile or nonvolatile impurities, and the evaporation transition was consistent with an identity of tBuPrOcEst-BZT. The overall purity of lot 09022015 was determined to be >96.6%.
Accelerated stability studies were conducted using HPLC/UV (Table A-1, System A). Lot 09022015 was stored in sealed amber glass vials at frozen, refrigerated, room, and elevated temperatures for 2 weeks and then analyzed for purity relative to a frozen (−20°C) reference sample. Stability was confirmed for at least 2 weeks when stored protected from light at temperatures ≤60°C.
Prior to handling to become lot 09022015, the bulk chemical was homogenized by overhead stirring the melted chemical in a water bath for 5 minutes and then stored in its original containers with inert headspace at room temperature. Lot 354PAL67 was then handled to become lot 09022015 as described above and stored in an HDPE container with inert headspace at room temperature.
A.1.8. 2-(5-chloro-2H-1,2,3-benzotriazol-2-yl)-6-(1,1-dimethylethyl)-4-methylphenol (Bumetrizole)
2-(5-chloro-2H-1,2,3-benzotriazol-2-yl)-6-(1,1-dimethylethyl)-4-methylphenol (bumetrizole) was obtained from Gojira Fine Chemicals, LLC (Bedford Heights, OH) in a single lot (120936). Identity, purity, and stability analyses were conducted by the analytical chemistry laboratory at Battelle (Columbus, OH).
Lot 120936, a light yellow powder, was identified as bumetrizole using FTIR, 1H NMR, and 13C NMR. The FTIR spectrum (Figure A-22) was consistent with the reference spectrum.124 The 1H NMR and 13C NMR spectra (Figure A-23, Figure A-24) were consistent with the proposed structure of bumetrizole and the predicted spectra.112 The log P was determined by HPLC/UV (Table A-1, System C). The observed average log P (8.47) for bumetrizole was higher than the predicted value from the literature (5.55)125 and the ACD calculated value (6.812 ± 1.245).112 Elemental analysis was performed by Galbraith Laboratories, Inc. to aid in identification. The relative amounts of carbon (64.73%), hydrogen (5.91%), nitrogen (13.34%), and chlorine (10.92%) were within 3% of the theoretical values. The relative amount of oxygen (4.52%) was within 11% of the theoretical value; oxygen values for all nine phenolic benzotriazoles were analyzed at the same time, and all nine were low, suggesting a systematic error in the analyses.
124. Sadtler Research Laboratories. Sadtler UV Light Absorbers; Amines; Compounds Containing Halogen Library: No. BPX-1180. Hercules, CA: Bio-Rad Laboratories; 2015.
112. Advanced Chemistry Development (ACD/Labs). NMR Predictors, version 14.00. Toronto, Ontario, Canada: Advanced Chemistry Development; 2015. https://www.acdlabs.com/products/spectrus-platform/nmr-predictors/
125. Royal Society of Chemistry (RSC). ChemSpider: Bumetrizole. London, UK: Royal Society of Chemistry; 2015. [Accessed: July 2023]. https://www.chemspider.com/Chemical-Structure.56304.html
112. Advanced Chemistry Development (ACD/Labs). NMR Predictors, version 14.00. Toronto, Ontario, Canada: Advanced Chemistry Development; 2015. https://www.acdlabs.com/products/spectrus-platform/nmr-predictors/
The purity of lot 120936 was determined by the analytical chemistry laboratory using HPLC/UV, HPLC/CAD, GC/FID, and DSC. HPLC/UV analysis demonstrated one major peak accounting for 99.5% of the total integrated peak area and two reportable impurity peaks ≥0.1% (Table A-1, System A). The HPLC/CAD spectrum had one major peak accounting for 100% of the total integrated peak area and no reportable impurities with a peak ≥0.1% (Table A-1, System D). Initial GC/FID analysis indicated 99.9% sample purity with one reportable impurity with peak area ≥0.1% of the total integrated peak area (Table A-2, System H). Subsequent GC/FID analysis was conducted to determine the volatile content using four halogenated and six nonhalogenated standards (Table A-2, System I). The sample did not contain quantifiable amounts of any of the tested volatiles. The DSC thermogram reported the sample was 99.7% bumetrizole with an average measured melting point of 141.1°C. The moisture content was determined by Karl Fischer titration performed at Galbraith Laboratories, Inc. and TGA conducted by the analytical chemistry laboratory. Karl Fischer titration yielded a water content of <0.1%. TGA measured no detectable volatile or nonvolatile impurities, and the evaporation transition was consistent with an identity of bumetrizole. The overall purity of lot 120936 was determined to be >99%.
Accelerated stability studies were conducted using HPLC/UV (Table A-1, System A). Lot 120936 was stored in sealed amber glass vials at frozen, refrigerated, room, and elevated temperatures for 2 weeks and then analyzed for purity relative to a frozen (−20°C) reference sample. Stability was confirmed for at least 2 weeks when stored protected from light at temperatures ≤60°C. The bulk chemical was homogenized in the plastic bag it was received in by first double bagging and then kneading and turning for about 12 minutes; it was then repacked into amber glass bottles with Teflon-lined lids and stored at room temperature.
A.1.9. 2-(5-chloro-2H-benzotriazol-2-yl)-4,6-bis(1,1-dimethylethyl)phenol(ditBuCl-BZT)
2-(5-chloro-2H-benzotriazol-2-yl)-4,6-bis(1,1-dimethylethyl)phenol (ditBuCl-BZT) was obtained from Gojira Fine Chemicals, LLC (Bedford Heights, OH) in a single lot (120937). Identity, purity, and stability analyses were conducted by the analytical chemistry laboratory at Battelle (Columbus, OH).
Lot 120937, a light yellow powder, was identified as ditBuCl-BZT using FTIR, 1H NMR, and 13C NMR. The FTIR spectrum (Figure A-25) was consistent with the proposed structure of ditBuCl-BZT and with the reference spectrum.126 The 1H NMR and 13C NMR spectra (Figure A-26, Figure A-27) were also consistent with the proposed structure of ditBuCl-BZT and with the reference spectrum.126 The log P was determined by HPLC/UV (Table A-1, System C). The observed average log P (9.4) for ditBuCl-BZT was greater than the predicted value (6.91).127 Elemental analysis was performed by Galbraith Laboratories, Inc. to aid in identification. The relative amounts of carbon (67.31%), hydrogen (6.88%), nitrogen (11.80%), and chlorine (9.67%) were within 3% of the theoretical values. The relative amount of oxygen (4.26%) was within 5% of the theoretical value; oxygen values for all nine phenolic benzotriazoles were analyzed at the same time, and all nine were low, suggesting a systematic error in the analyses.
126. National Institute of Advanced Industrial Science and Technology (AIST). Spectral Database for Organic Compounds: SDBS-7557. Tokyo, Japan: National Institute of Advanced Industrial Science and Technology; 1999. [Accessed: July 2023]. https://sdbs.db.aist.go.jp/CompoundLanding.aspx?sdbsno=7557
126. National Institute of Advanced Industrial Science and Technology (AIST). Spectral Database for Organic Compounds: SDBS-7557. Tokyo, Japan: National Institute of Advanced Industrial Science and Technology; 1999. [Accessed: July 2023]. https://sdbs.db.aist.go.jp/CompoundLanding.aspx?sdbsno=7557
127. Royal Society of Chemistry (RSC). ChemSpider: 2,4-Di-tert-butyl-6-(5-chlorobenzotriazol-2-yl)phenol. London, UK: Royal Society of Chemistry; 2015. [Accessed: July 2023]. https://www.chemspider.com/Chemical-Structure.69879.html
The purity of lot 120937 was determined by the analytical chemistry laboratory using HPLC/UV, HPLC/CAD, GC/FID, and DSC. HPLC/UV and HPLC/CAD spectra both had one major peak accounting for 100% of the total integrated peak area and no reportable impurity peaks ≥0.1% (Table A-1, System A and System D, respectively). Initial GC/FID analysis indicated 99.8% sample purity with two reportable impurities with peak area ≥0.1% of the total integrated peak area (Table A-2, System H). Subsequent GC/FID analysis was conducted to determine the volatile content using four halogenated and six nonhalogenated standards (Table A-2, System I). The sample did not contain quantifiable amounts of any of the tested volatiles. The DSC thermogram reported the sample was 99.5% ditBuCl-BZT with an average measured melting point of 156.1°C. The moisture content was determined by Karl Fischer titration performed at Galbraith Laboratories, Inc. and TGA conducted by the analytical chemistry laboratory. Karl Fischer titration yielded a water content of <0.1%. TGA measured no detectable volatile or nonvolatile impurities, and the evaporation transition was consistent with an identity of ditBuCl-BZT. The overall purity of lot 120937 was determined to be >99%.
Accelerated stability studies were conducted using HPLC/UV (Table A-1, System A). Lot 120937 was stored in sealed amber glass vials at frozen, refrigerated, room, and elevated temperatures for 2 weeks and then analyzed for purity relative to a frozen (−20°C) reference sample. Stability was confirmed for at least 2 weeks when stored protected from light at temperatures ≤60°C. The bulk chemical was homogenized in the plastic bag it was received in by first double bagging and then kneading and turning for about 12 minutes; it was then repacked into amber glass bottles with Teflon-lined lids and stored at room temperature.
A.1.10. Methylcellulose
Methylcellulose used to make the 0.5% aqueous vehicle for gavage formulations was obtained from Spectrum Chemical Manufacturing Corporation (New Brunswick, NJ) in one lot (2DH0326). Deionized water was used as the solvent. The identity of the methylcellulose was confirmed by the analytical chemistry laboratory using FTIR spectroscopy. Methoxy content (31.0%) was initially confirmed by Galbraith Laboratories, Inc. Prior to starting the phenolic benzotriazole studies, additional methoxy content analysis was performed by Whitehouse Laboratories (Readington, NJ). Lot 2DH0326 (32.1%) had methoxy group content inside of the acceptance criteria of 26.0%–33.0%.
A.2. Preparation and Analysis of Dose Formulations
The dose formulations of each chemical (P-BZT, drometrizole, tBu-BZT, octrizole, ditPe-BZT, diMeEtPh-BZT, tBuPrOcEst-BZT, bumetrizole, or ditBuCl-BZT) in 0.5% aqueous methylcellulose were prepared at the analytical chemistry laboratory following the protocols outlined in Table A-3. Dose formulations of each test chemical were prepared once at 0, 6, 20, 60, and 200 mg/mL.
Homogeneity of 0.5 and 200 mg/mL dose formulations and stability of 0.5 mg/mL dose formulations were determined by the analytical chemistry laboratory using HPLC/UV (Table A-1; System F for octrizole, System A for the other eight test chemicals). Additional dose formulations were assessed for tBuPrOcEst-BZT: 5 and 150 mg/mL dose formulations were assessed for homogeneity, and 5 mg/mL dose formulations for stability. Homogeneity was confirmed for all chemicals at all dose concentrations. Stability of 0.5 mg/mL P-BZT, drometrizole, tBu-BZT, octrizole, ditPe-BZT, diMeEtPh-BZT, bumetrizole, and ditBuCl-BZT was confirmed for 42 days at both refrigerated (5°C) and room (25°C) temperatures while protected from light. Stability of 0.5 mg/mL tBuPrOcEst-BZT was confirmed for 42 days at room temperature, and a 5 mg/mL formulation was stable for 42 days at refrigerated or room temperature. All formulations of tBuPrOcEst-BZT required heating and mixing to resuspend the formulation prior to sampling. Additionally, 0.5 mg/mL formulations of P-BZT, drometrizole, tBu-BZT, octrizole, ditPe-BZT, diMeEtPh-BZT, bumetrizole, and ditBuCl-BZT were stable under simulated animal room conditions for at least 3 hours. tBuPrOcEst-BZT was stable for 1.5 hours under simulated animal room conditions when heated and mixed immediately prior. All dose formulations were stored protected from light at either room temperature or refrigerated temperature (5°C) for up to 15 days until shipment to the study laboratory (Battelle, West Jefferson, OH). At the study laboratory, all dose formulations were stored in sealed, clear glass bottles, protected from light in amber plastic bags, at room temperature and were used within 35 days from the mix date.
Analyses of preadministration and postadministration dose formulations were conducted by the analytical chemistry laboratory using HPLC/UV (Table A-1; System F for octrizole, System A for the other eight test chemicals). All preadministration samples were within 10% of the target concentrations (Table A-4 through Table A-12). All postadministration samples were within 10% of the target concentrations, except for tBuPrOcEst-BZT for which the 20, 60, and 200 mg/mL results were 10.7%, 10.6%, and 10.8% above the target concentrations, respectively. All 0 mg/mL formulations were below the limit of quantitation.
Table A-1. Liquid Chromatography Systems Used in the Two-week Gavage Studies of Select Phenolic Benzotriazoles
| Chromatography | Detection System | Column | Mobile Phase |
|---|---|---|---|
| System A | |||
| High-performance liquid chromatography | Ultraviolet (332 nm) | Phenomenex Inertsil Phenyl (150 × 4.6 mm ID, 5 µm particle size) | A: ASTM Type I Water B: Filtered Acetonitrile Gradient program: A:B 50:50 for 5 minutes, 50:50 to 0:100 in 20 minutes, held at 0:100 for 5 minutes, 0:100 to 50:50 in 1 minute, held at 50:50 for 5 minutes, 1 mL/min flow rate |
| System B | |||
| High-performance liquid chromatography | Ultraviolet (205 nm) | Thermo BDS Hypersil C18, 120A (100 × 4.6 mm ID, 3 µm particle size) | A: Acetonitrile B: ASTM Water Gradient program: A:B Isocratic 50:50, 0.6 mL/min flow rate |
| System C | |||
| High-performance liquid chromatography | Ultraviolet (205 nm) | Thermo BDS Hypersil C18, 120A (100 × 4.6 mm ID, 3 µm particle size) | A: Acetonitrile B: ASTM Water Gradient program: A:B Isocratic 90:10, 0.6 mL/min flow rate |
| System D | |||
| High-performance liquid chromatography | Charged aerosol detector | Phenomenex Inertsil Phenyl (150 × 4.6 mm ID, 5 µm particle size) | A: ASTM Type I Water B: Filtered Acetonitrile Gradient program: A:B 50:50 for 5 minutes, 50:50 to 0:100 in 20 minutes, held at 0:100 for 5 minutes, 0:100 to 50:50 in 1 minute, held at 50:50 for 5 minutes, 1 mL/min flow rate |
| System E | |||
| High-performance liquid chromatography | Mass spectrometry | Phenomenex Luna C18 (150 × 4.6 mm ID, 5 µm particle size) | A: ASTM Type I Water B: Methanol Gradient program: A:B 20:80 for 2.5 minutes, 20:80 to 0:100 in 20 minutes, held for 7.5 minutes, 0:100 to 20:80 in 1 minute, held for 5 minutes, 1 mL/min flow rate |
| System F | |||
| High-performance liquid chromatography | Ultraviolet (332 nm) | Phenomenex Luna C18 (150 × 4.6 mm ID, 5 µm particle size) | A: ASTM Type I Water B: Methanol Gradient program: A:B 20:80 for 2.5 minutes, 20:80 to 0:100 in 20 minutes, held for 7.5 minutes, 0:100 to 20:80 in 1 minute, held for 5 minutes, 1 mL/min flow rate |
| System G | |||
| High-performance liquid chromatography | Charged aerosol detector | Phenomenex Luna C18 (150 × 4.6 mm ID, 5 µm particle size) | A: ASTM Type I Water B: Methanol Gradient program: A:B 20:80 for 2.5 minutes, 20:80 to 0:100 in 20 minutes, held for 7.5 minutes, 0:100 to 20:80 in 1 minute, held for 5 minutes, 1 mL/min flow rate |
Table A-2. Gas Chromatography Systems Used in the Two-week Gavage Studies of Select Phenolic Benzotriazoles
| Detection System | Column | Carrier Gas | Oven Temperature Program |
|---|---|---|---|
| System H | |||
| Flame ionization (320°C) | Restek Rxi-1HT 30 m × 0.25 mm ID, 0.10 µm film | Helium at 2 mL/min | 10°C/min from 75°C to 300°C, held for 12.5 minutes |
| System I | |||
| Flame ionization (260°C) | Restek Rtx-624 30 m × 0.53 mm ID, 3 µm film | Helium at 5 mL/min | 35°C for 14 minutes, then 15°C/min to 40°C, held for 3 minutes, then 15°C/min to 240°C, held for 2 minutes |
| System J | |||
| Electron impact mass selective detection | Restek Rxi-1HT 30 m × 0.25 mm ID, 0.10 µm film | Helium at 2 mL/min | 10°C/min from 75°C to 300°C, held for 12.5 minutes |
Table A-3. Preparation and Storage of Dose Formulations Administered to Male Rats in the Two-week Gavage Studies of Select Phenolic Benzotriazoles
| Preparation | |
|---|---|
| Except for tBuPrOcEst-BZT, the appropriate mass for each target concentration was transferred from the bulk test articles into tared >1.5 L containers. Approximately 1.2 L of vehicle (5% aqueous methylcellulose) was added, and the test article was mixed into the vehicle using an overhead stirrer until homogenous. Each batch was then mixed with a bead mill in order of ascending concentration for ~15 minutes. At the end of milling, any remaining solution was pumped from the bead mill, which was subsequently washed twice with a 100 mL aliquot of the vehicle. For the preparation of tBuPrOcEst-BZT, the test article and approximately 7 L of vehicle were heated in a water bath set at approximately 37°C overnight to melt the test article and warm the vehicle. After melting, the appropriate amount of tBuPrOcEst-BZT to reach each target concentration was weighed into a tared >1.5 L container. The 37°C vehicle was then added to each container to a total volume of approximately 1.35 L. Each batch of tBuPrOcEst-BZT was homogenized using a Silverson mixer for ~5 minutes until the mixture was visibly uniform. For all test articles, the formulation containers used for batch mixing were placed on a balance, and additional vehicle was added to produce a total weight of 1,500 g, with the final volume confirmed to be ~1.5 L. Overhead stirring was continuous throughout sampling and dispensing for all formulations; sampling and dispensing began after at least 10 minutes of stirring for tBuPrOcEst-BZT to allow the test article to be completely mixed into the final volume. Formulations were dispensed into clear glass bottles, sealed with Teflon-lined lids, placed in amber plastic bags, and stored at refrigerated or room temperature until dosing and analysis. Immediately prior to dosing and analysis, formulations were equilibrated to room temperature, resuspended by shaking for 30 seconds, and stirred magnetically for 5 minutes. | |
| Chemical lot numbers | |
| P-BZT | 09042015 [created from Richman Chemical (Lower Gwynedd, PA) lot 373PAL021] |
| Drometrizole | 120935 (Gojira Fine Chemicals, LLC, Bedford Heights, OH) |
| tBu-BZT | IDRWA (TCI America, Tokyo, Japan) |
| Octrizole | 120932 (Gojira Fine Chemicals, LLC, Bedford Heights, OH) |
| ditPe-BZT | 120933 (Gojira Fine Chemicals, LLC, Bedford Heights, OH) |
| diMeEtPh-BZT | 120934 (Gojira Fine Chemicals, LLC, Bedford Heights, OH) |
| tBuPrOcEst-BZT | 09022015 [created from Richman Chemical (Lower Gwynedd, PA) lot 354PAL67] |
| Bumetrizole | 120936 (Gojira Fine Chemicals, LLC, Bedford Heights, OH) |
| ditBuCl-BZT | 120937 (Gojira Fine Chemicals, LLC, Bedford Heights, OH) |
| Vehicle lot number | |
| 2DH0326 (Spectrum Chemical Manufacturing Corporation, New Brunswick, NJ) | |
| Maximum storage time | |
| 35 days | |
| Storage conditions | |
| Stored in sealed, clear glass bottles with Teflon-lined lids within amber plastic bags at room temperature and shipped to and from the study laboratory for analysis at the analytical chemistry laboratory. | |
| Analytical chemistry laboratory | |
| Battelle (Columbus, OH) | |
| Study laboratory | |
| Battelle (West Jefferson, OH) | |
A.2.1. 2-(2H-benzotriazol-2-yl)phenol (P-BZT)
Table A-4. Results of Analyses of Dose Formulations Administered to Male Rats in the Two-week Gavage Study of P-BZT
| Date Prepared | Dates Analyzed | Target Concentration (mg/mL) | Determined Concentration (mg/mL)a | Difference from Target (%) |
|---|---|---|---|---|
| December 28, 2015 | December 29–30, 2015 | 0 | BLOQ | NA |
| 6 | 5.81 ± 0.04 | −3.2 | ||
| 20 | 19.4 ± 0.1 | −2.8 | ||
| 60 | 59.3 ± 0.1 | −1.1 | ||
| 200 | 206 ± 1 | 3.2 | ||
| Animal room samples | ||||
| December 28, 2015 | February 5–6, 2016 | 0 | BLOQ | NA |
| 6 | 6.15 ± 0.03 | 2.5 | ||
| 20 | 20.1 ± 0.0 | 0.5 | ||
| 60 | 61.6 ± 0.1 | 2.7 | ||
| 200 | 212 ± 2 | 6.2 | ||
Figure A-1. Infrared Absorption Spectrum of P-BZT (Lot 09042015)
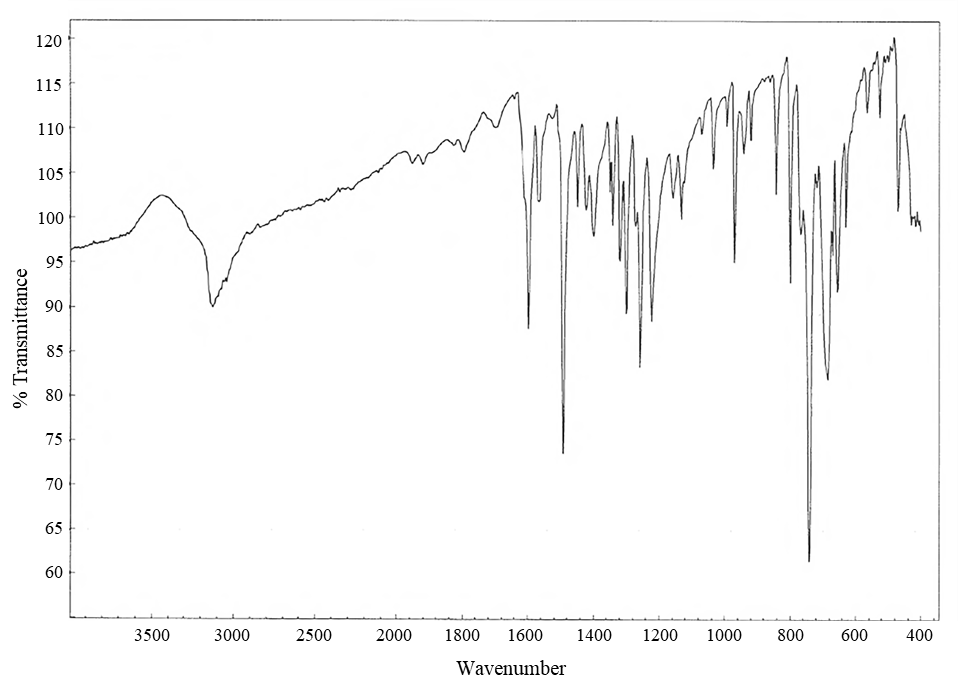
P-BZT = 2-(2H-benzotriazol-2-yl)phenol.
Figure A-2. 1H Nuclear Magnetic Resonance Spectrum of P-BZT (Lot 09042015)
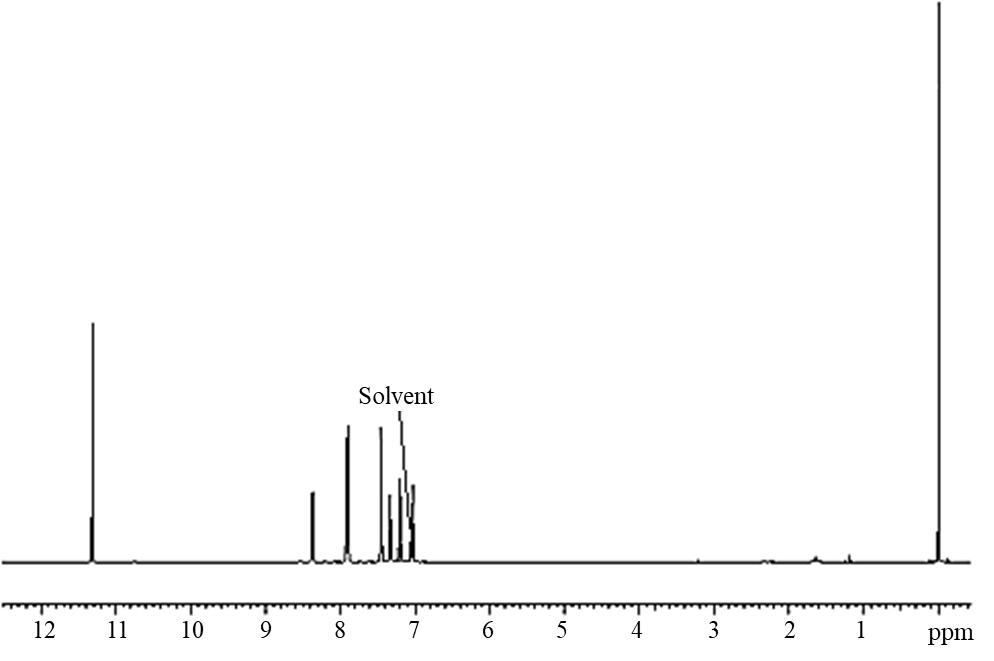
P-BZT = 2-(2H-benzotriazol-2-yl)phenol.
Figure A-3. 13C Nuclear Magnetic Resonance Spectrum of P-BZT (Lot 09042015)
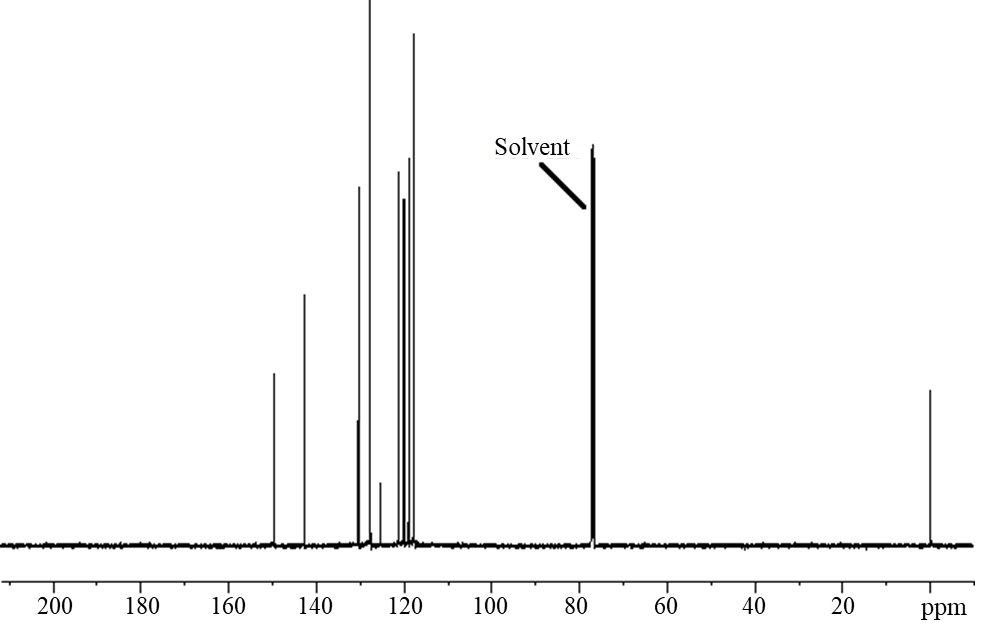
P-BZT = 2-(2H-benzotriazol-2-yl)phenol.
A.2.2. 2-(2H-benzotriazol-2-yl)-4-methylphenol (Drometrizole)
Table A-5. Results of Analyses of Dose Formulations Administered to Male Rats in the Two-week Gavage Study of Drometrizole
| Date Prepared | Dates Analyzed | Target Concentration (mg/mL) | Determined Concentration (mg/mL)a | Difference from Target (%) |
|---|---|---|---|---|
| January 21, 2016 | January 22–23, 2016 | 0 | BLOQ | NA |
| 6 | 5.77 ± 0.02 | −3.8 | ||
| 20 | 19.4 ± 0.0 | −3.0 | ||
| 60 | 60.7 ± 0.1 | 1.2 | ||
| 200 | 205 ± 1 | 2.3 | ||
| Animal room samples | ||||
| January 21, 2016 | February 22–23, 2016 | 0 | BLOQ | NA |
| 6 | 5.89 ± 0.03 | −1.9 | ||
| 20 | 20.1 ± 0.0 | 0.5 | ||
| 60 | 61.9 ± 0.2 | 3.2 | ||
| 200 | 206 ± 1 | 3.2 | ||
Figure A-4. Infrared Absorption Spectrum of Drometrizole (Lot 120935)
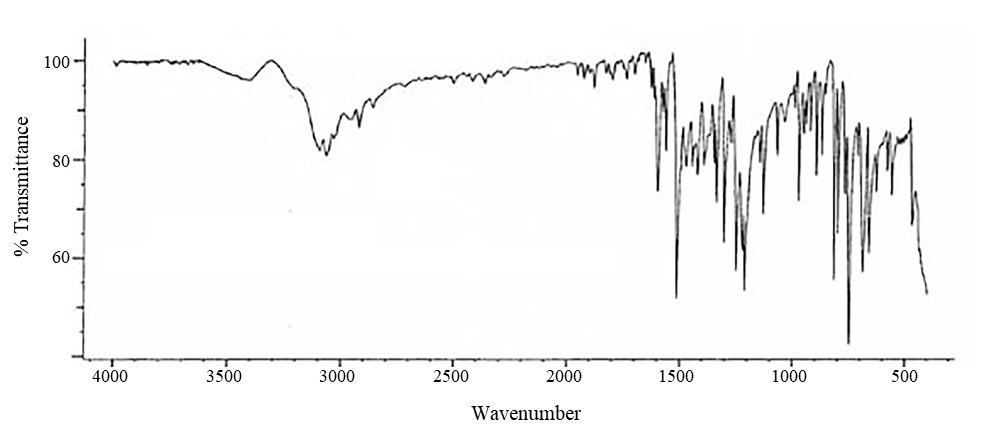
Drometrizole = 2-(2H-benzotriazol-2-yl)-4-methylphenol.
Figure A-5. 1H Nuclear Magnetic Resonance Spectrum of Drometrizole (Lot 120935)
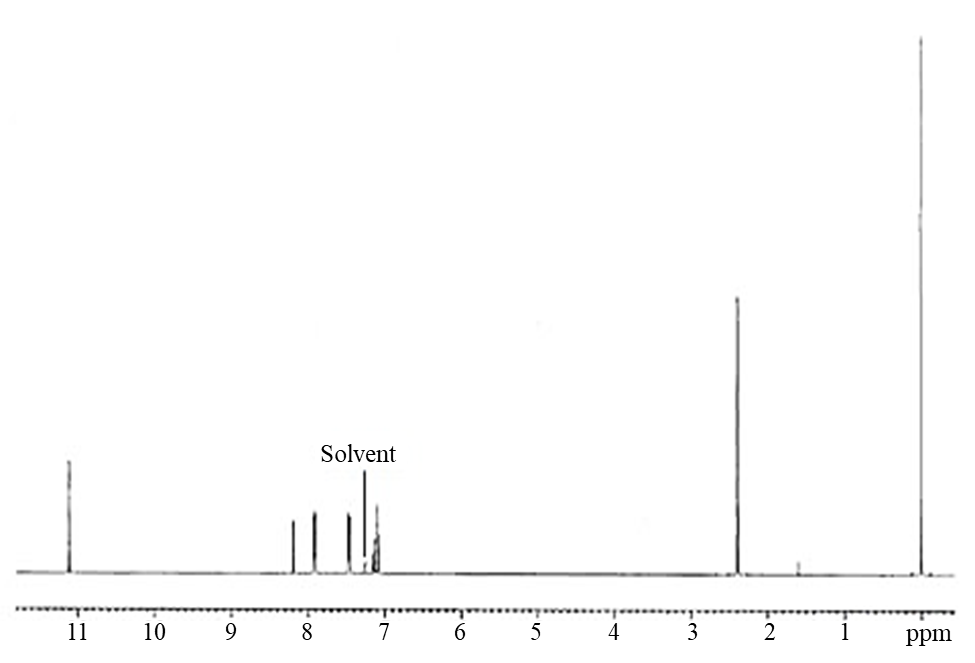
Drometrizole = 2-(2H-benzotriazol-2-yl)-4-methylphenol.
Figure A-6. 13C Nuclear Magnetic Resonance Spectrum of Drometrizole (Lot 120935)
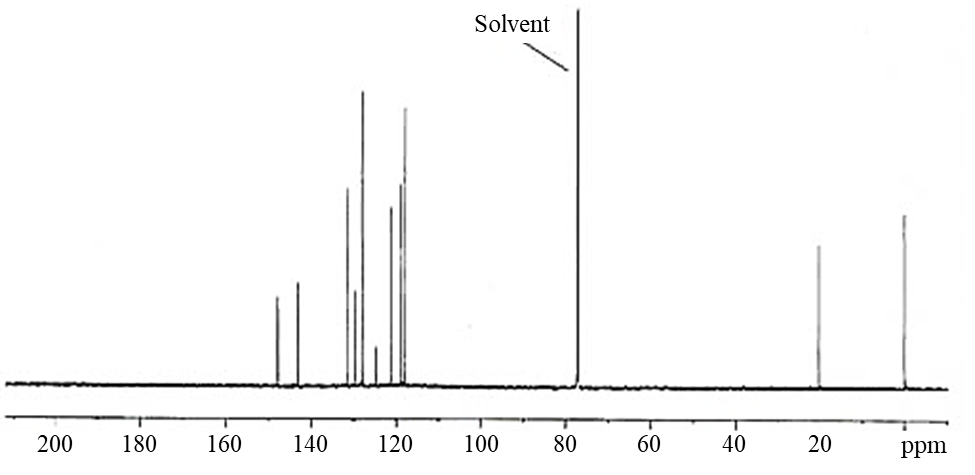
Drometrizole = 2-(2H-benzotriazol-2-yl)-4-methylphenol.
A.2.3. 2-(2H-benzotriazol-2-yl)-4-tert-butylphenol (tBu-BZT)
Table A-6. Results of Analyses of Dose Formulations Administered to Male Rats in the Two-week Gavage Study of tBu-BZT
| Date Prepared | Dates Analyzed | Target Concentration (mg/mL) | Determined Concentration (mg/mL)a | Difference from Target (%) |
|---|---|---|---|---|
| January 25, 2016 | January 26–27, 2016 | 0 | BLOQ | NA |
| 6 | 6.00 ± 0.02 | 0.0 | ||
| 20 | 20.2 ± 0.1 | 1.2 | ||
| 60 | 60.8 ± 0.3 | 1.3 | ||
| 200 | 207 ± 1 | 3.3 | ||
| Animal room samples | ||||
| January 25, 2016 | February 24–25, 2016 | 0 | BLOQ | NA |
| 6 | 6.02 ± 0.01 | 0.3 | ||
| 20 | 19.8 ± 0.1 | −0.8 | ||
| 60 | 60.8 ± 0.3 | 1.3 | ||
| 200 | 206 ± 1 | 2.8 | ||
Figure A-7. Infrared Absorption Spectrum of tBu-BZT (Lot IDRWA)
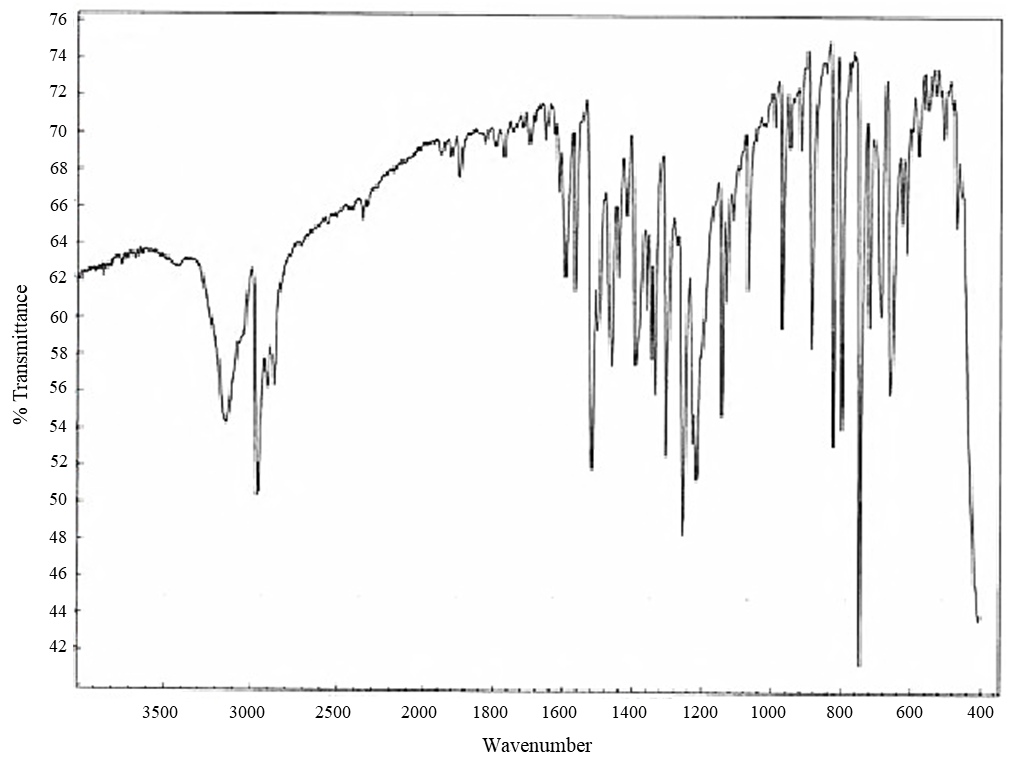
tBu-BZT = 2-(2H-benzotriazol-2-yl)-4-tert-butylphenol.
Figure A-8. 1H Nuclear Magnetic Resonance Spectrum of tBu-BZT (Lot IDRWA)
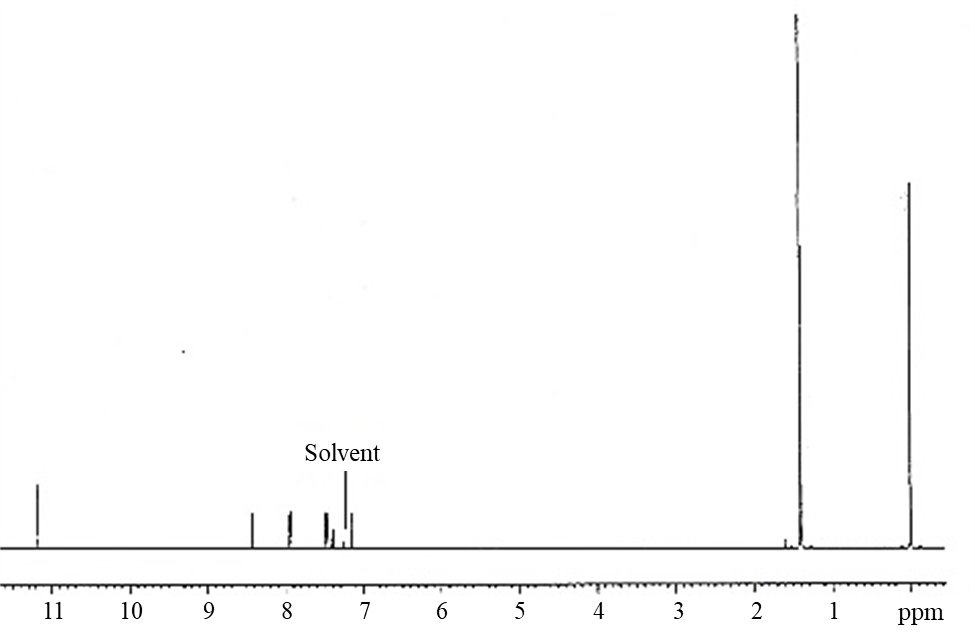
tBu-BZT = 2-(2H-benzotriazol-2-yl)-4-tert-butylphenol.
Figure A-9. 13C Nuclear Magnetic Resonance Spectrum of tBu-BZT (Lot IDRWA)
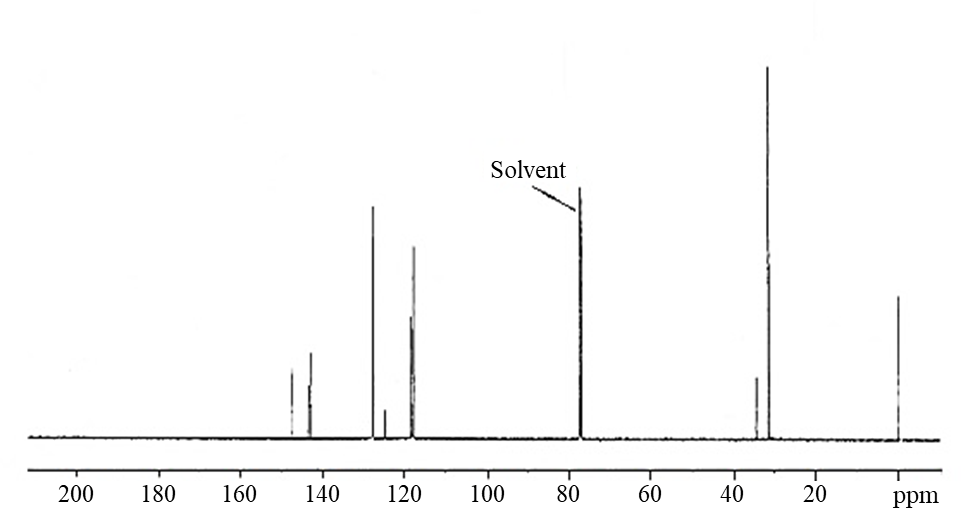
tBu-BZT = 2-(2H-benzotriazol-2-yl)-4-tert-butylphenol.
A.2.4. 2-(2H-benzotriazol-2-yl)-4-(1,1,3,3-tetramethylbutyl)phenol (Octrizole)
Table A-7. Results of Analyses of Dose Formulations Administered to Male Rats in the Two-week Gavage Study of Octrizole
| Date Prepared | Dates Analyzed | Target Concentration (mg/mL) | Determined Concentration (mg/mL)a | Difference from Target (%) |
|---|---|---|---|---|
| January 14, 2016 | January 15–16, 2016 | 0 | BLOQ | NA |
| 6 | 5.74 ± 0.02 | −4.3 | ||
| 20 | 19.5 ± 0.1 | −2.7 | ||
| 60 | 58.4 ± 0.1 | −2.6 | ||
| 200 | 200 ± 0 | 0.0 | ||
| Animal room samples | ||||
| January 14, 2016 | February 17–18, 2016 | 0 | BLOQ | NA |
| 6 | 5.79 ± 0.01 | −3.4 | ||
| 20 | 19.9 ± 0.0 | −0.5 | ||
| 60 | 59.5 ± 0.1 | −0.9 | ||
| 200 | 203 ± 0 | 1.5 | ||
Figure A-10. Infrared Absorption Spectrum of Octrizole (Lot 120932)
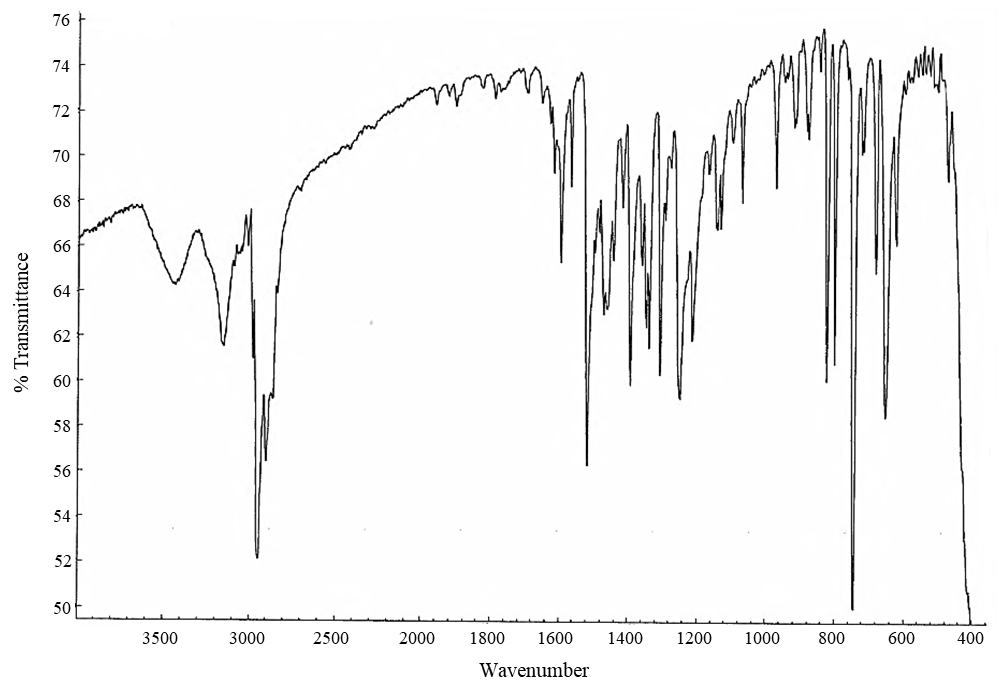
Octrizole = 2-(2H-benzotriazol-2-yl)-4-(1,1,3,3-tetramethylbutyl)phenol.
Figure A-11. 1H Nuclear Magnetic Resonance Spectrum of Octrizole (Lot 120932)
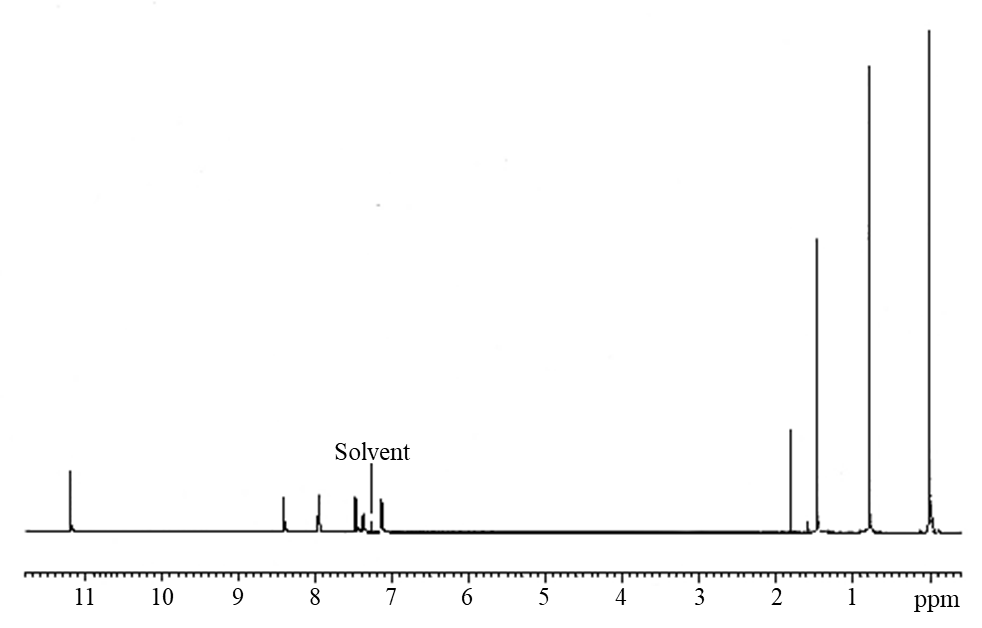
Octrizole = 2-(2H-benzotriazol-2-yl)-4-(1,1,3,3-tetramethylbutyl)phenol.
Figure A-12. 13C Nuclear Magnetic Resonance Spectrum of Octrizole (Lot 120932)
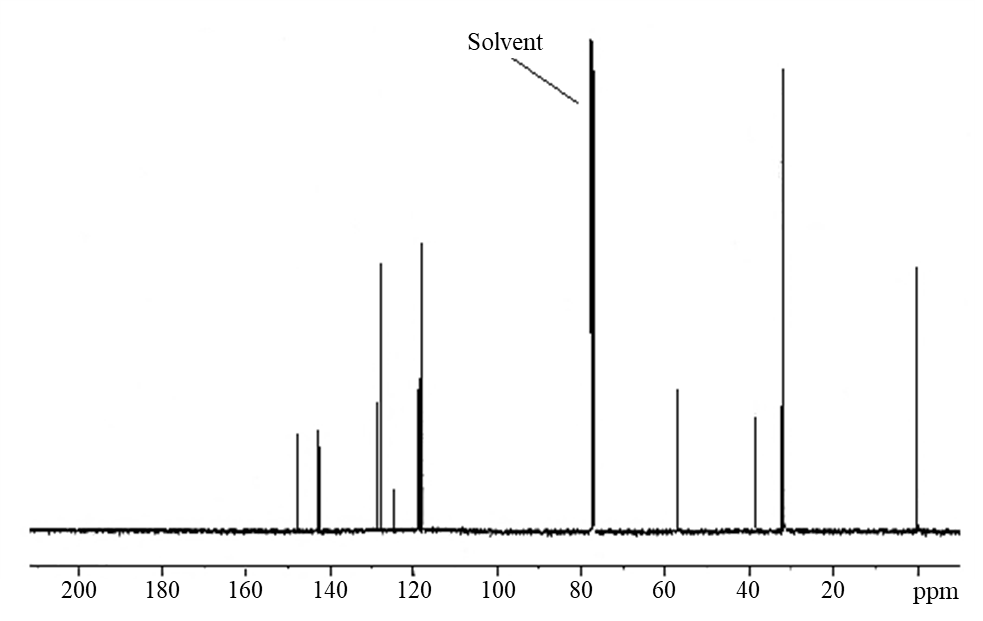
Octrizole = 2-(2H-benzotriazol-2-yl)-4-(1,1,3,3-tetramethylbutyl)phenol.
A.2.5. 2-(2H-benzotriazol-2-yl)-4,6-bis(1,1-dimethylpropyl)phenol (ditPe-BZT)
Table A-8. Results of Analyses of Dose Formulations Administered to Male Rats in the Two-week Gavage Study of ditPe-BZT
| Date Prepared | Dates Analyzed | Target Concentration (mg/mL) | Determined Concentration (mg/mL)a | Difference from Target (%) |
|---|---|---|---|---|
| January 7, 2016 | January 8–9, 2016 | 0 | BLOQ | NA |
| 6 | 5.84 ± 0.01 | −2.6 | ||
| 20 | 19.3 ± 0.1 | −3.5 | ||
| 60 | 58.9 ± 0.3 | −1.8 | ||
| 200 | 204 ± 1 | 1.8 | ||
| Animal room samples | ||||
| January 7, 2016 | February 12–13, 2016 | 0 | BLOQ | NA |
| 6 | 5.98 ± 0.01 | −0.3 | ||
| 20 | 20.5 ± 0.1 | 2.3 | ||
| 60 | 61.0 ± 0.2 | 1.6 | ||
| 200 | 207 ± 2 | 3.3 | ||
Figure A-13. Infrared Absorption Spectrum of ditPe-BZT (Lot 120933)
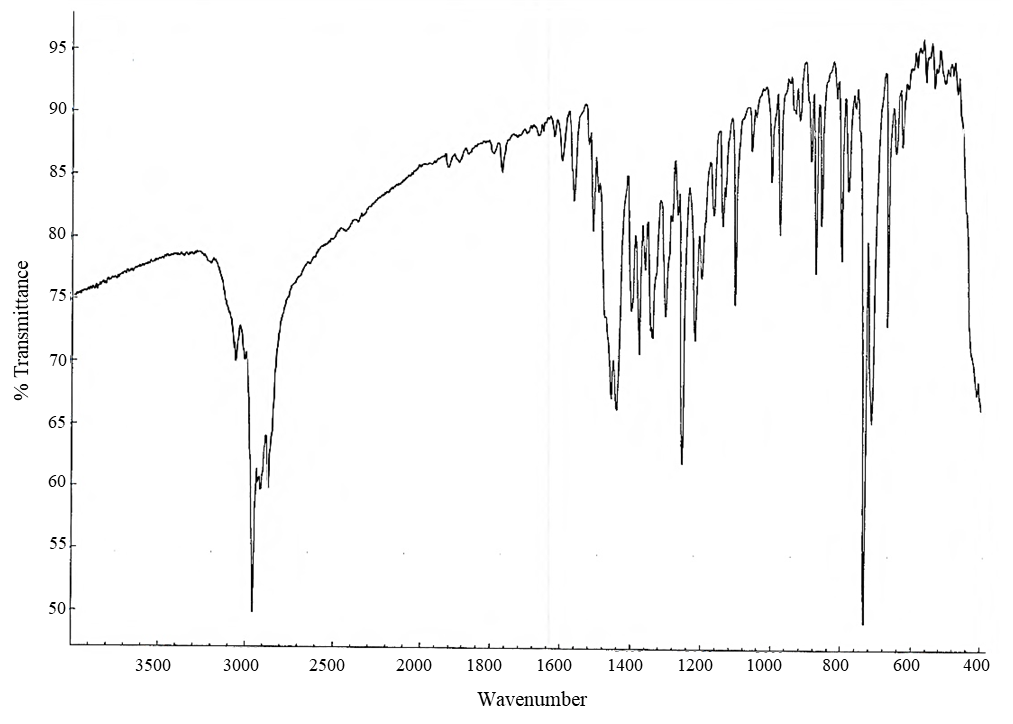
ditPe-BZT = 2-(2H-benzotriazol-2-yl)-4,6-bis(1,1-dimethylpropyl)phenol.
Figure A-14. 1H Nuclear Magnetic Resonance Spectrum of ditPe-BZT (Lot 120933)
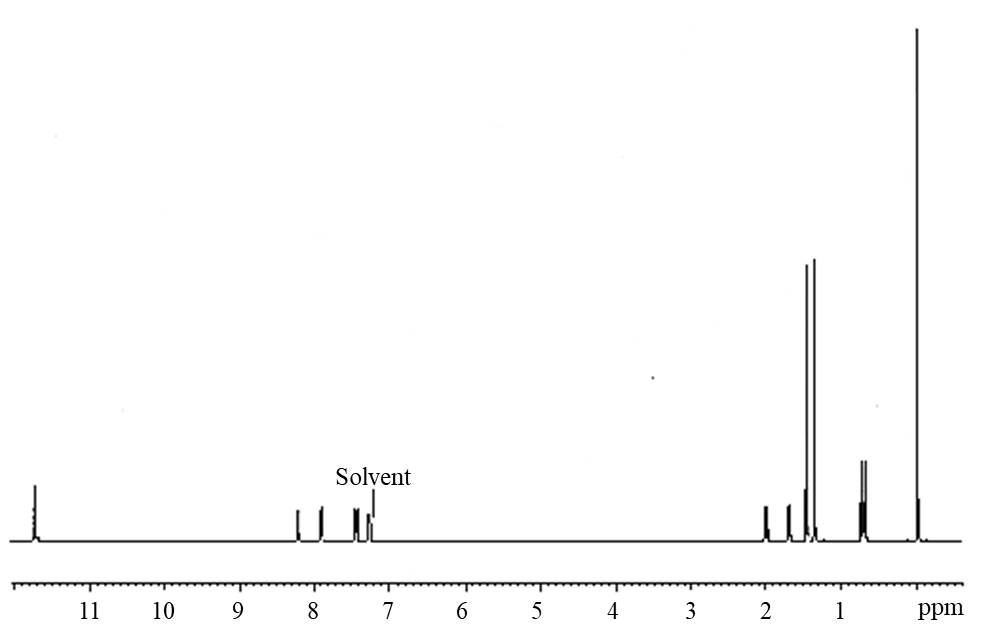
ditPe-BZT = 2-(2H-benzotriazol-2-yl)-4,6-bis(1,1-dimethylpropyl)phenol.
Figure A-15. 13C Nuclear Magnetic Resonance Spectrum of ditPe-BZT (Lot 120933)
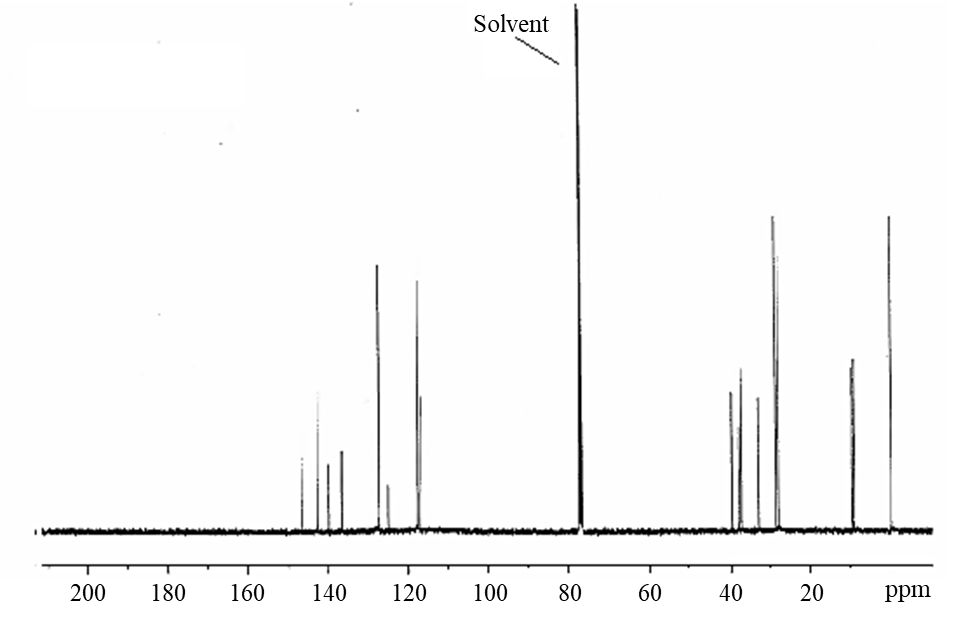
ditPe-BZT = 2-(2H-benzotriazol-2-yl)-4,6-bis(1,1-dimethylpropyl)phenol.
A.2.6. 2-(2H-benzotriazol-2-yl)-4,6-bis(1-methyl-1-phenylethyl)phenol(diMeEtPh-BZT)
Table A-9. Results of Analyses of Dose Formulations Administered to Male Rats in the Two-week Gavage Study of diMeEtPh-BZT
| Date Prepared | Dates Analyzed | Target Concentration (mg/mL) | Determined Concentration (mg/mL)a | Difference from Target (%) |
|---|---|---|---|---|
| January 11, 2016 | January 12–13, 2016 | 0 | BLOQ | NA |
| 6 | 5.73 ± 0.02 | −4.5 | ||
| 20 | 19.5 ± 0.1 | −2.7 | ||
| 60 | 57.7 ± 0.2 | −3.8 | ||
| 200 | 202 ± 0 | 1.0 | ||
| Animal room samples | ||||
| January 11, 2016 | February 15–16, 2016 | 0 | BLOQ | NA |
| 6 | 5.87 ± 0.03 | −2.2 | ||
| 20 | 20.2 ± 0.2 | 1.2 | ||
| 60 | 60.7 ± 0.2 | 1.2 | ||
| 200 | 206 ± 1 | 2.8 | ||
Figure A-16. Infrared Absorption Spectrum of diMeEtPh-BZT (Lot 120934)
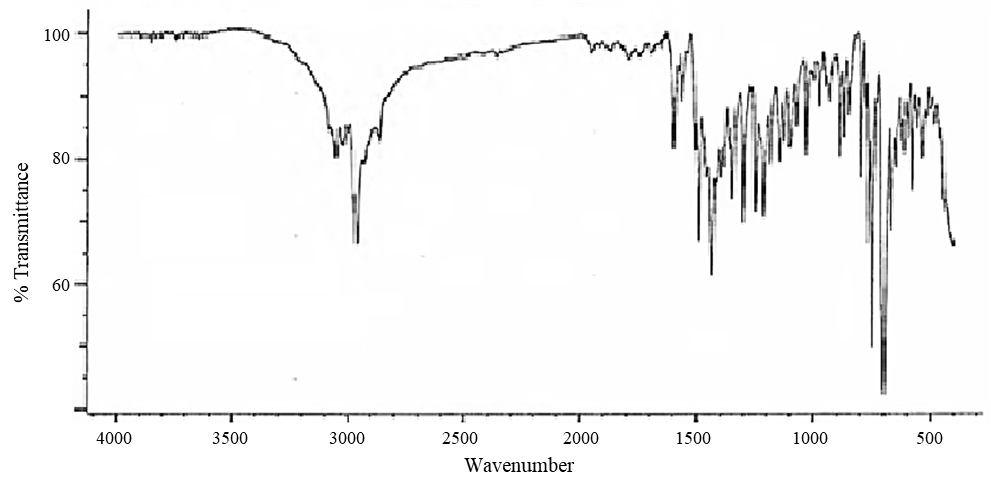
diMeEtPh-BZT = 2-(2H-benzotriazol-2-yl)-4,6-bis(1-methyl-1-phenylethyl)phenol.
Figure A-17. 1H Nuclear Magnetic Resonance Spectrum of diMeEtPh-BZT (Lot 120934)
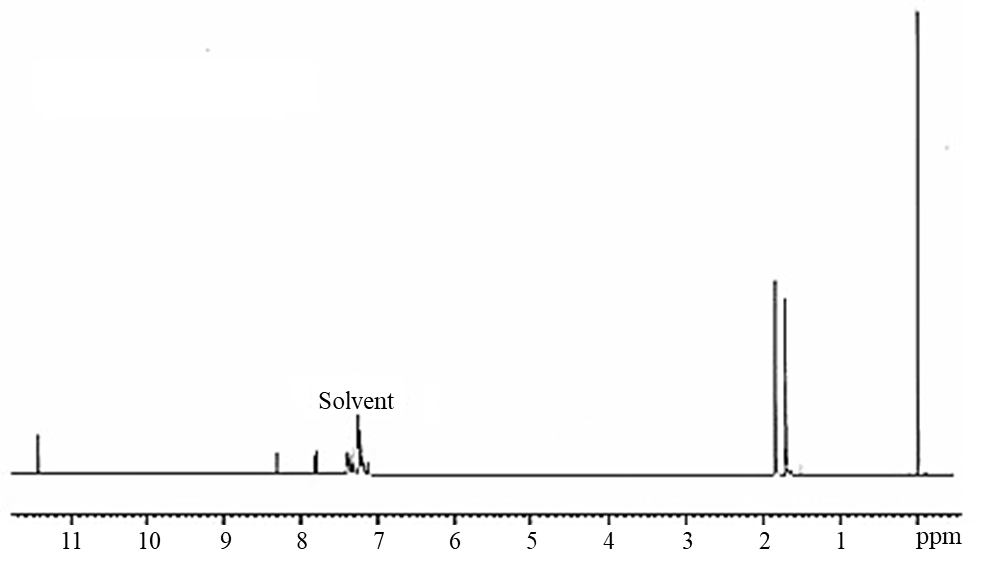
diMeEtPh-BZT = 2-(2H-benzotriazol-2-yl)-4,6-bis(1-methyl-1-phenylethyl)phenol.
Figure A-18. 13C Nuclear Magnetic Resonance Spectrum of diMeEtPh-BZT (Lot 120934)
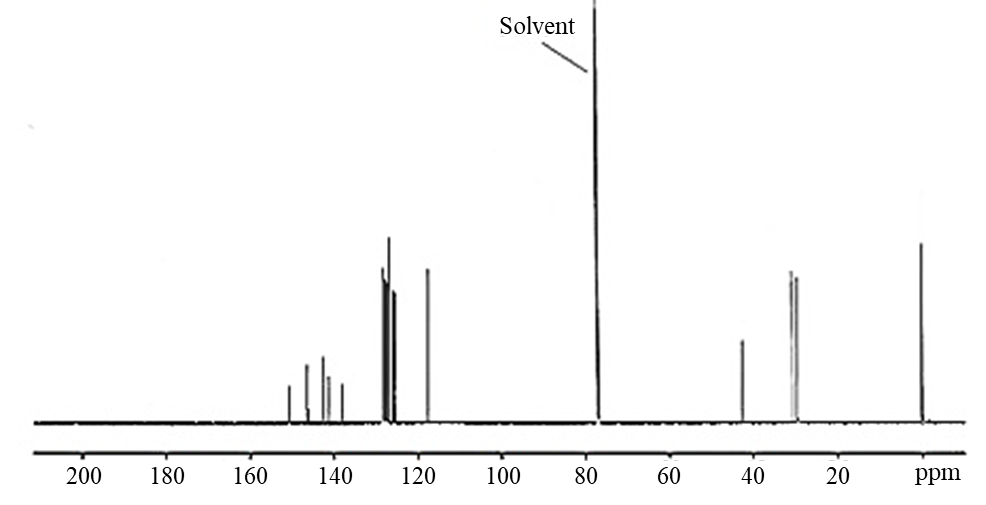
diMeEtPh-BZT = 2-(2H-benzotriazol-2-yl)-4,6-bis(1-methyl-1-phenylethyl)phenol.
A.2.7. 3-(2H-benzotriazol-2-yl)-5-(1,1-dimethylethyl)-4-hydroxybenzenepropanoic acid, octyl ester (tBuPrOcEst-BZT)
Table A-10. Results of Analyses of Dose Formulations Administered to Male Rats in the Two-week Gavage Study of tBuPrOcEst-BZT
| Date Prepared | Dates Analyzed | Target Concentration (mg/mL) | Determined Concentration (mg/mL)a | Difference from Target (%) |
|---|---|---|---|---|
| December 30, 2015 | December 31, 2015–January 1, 2016 | 0 | BLOQ | NA |
| 6 | 6.16 ± 0.11 | 2.7 | ||
| 20 | 20.5 ± 0.1 | 2.5 | ||
| 60 | 63.3 ± 1.0 | 5.5 | ||
| 200 | 206 ± 1 | 3.2 | ||
| Animal room samples | ||||
| December 30, 2015 | February 9–10, 2016 | 0 | BLOQ | NA |
| 6 | 6.26 ± 0.11 | 4.4 | ||
| 20 | 22.1 ± 0.4 | 10.7 | ||
| 60 | 66.4 ± 1.2 | 10.6 | ||
| 200 | 222b | 10.8 | ||
Figure A-19. Infrared Absorption Spectrum of tBuPrOcEst-BZT (Lot 09022015)
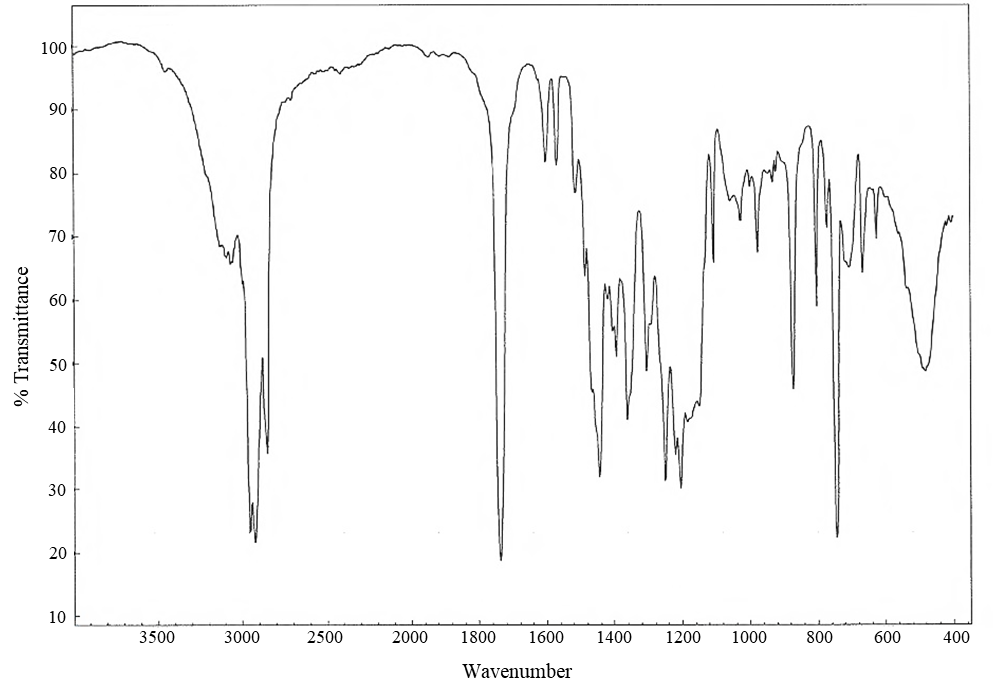
tBuPrOcEst-BZT = 3-(2H-benzotriazol-2-yl)-5-(1,1-dimethylethyl)-4-hydroxybenzenepropanoic acid, octyl ester.
Figure A-20. 1H Nuclear Magnetic Resonance Spectrum of tBuPrOcEst-BZT (Lot 09022015)
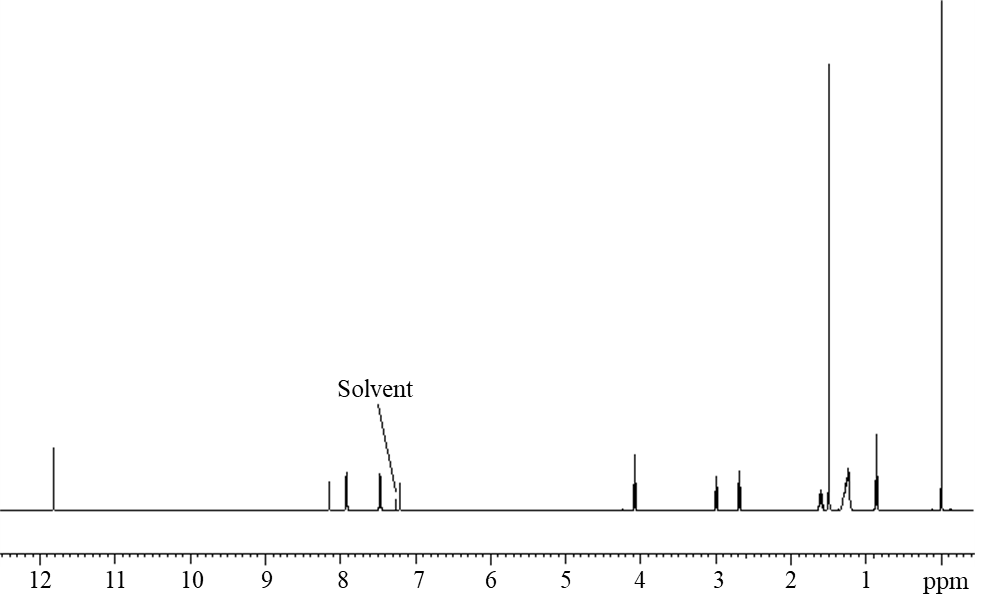
tBuPrOcEst-BZT = 3-(2H-benzotriazol-2-yl)-5-(1,1-dimethylethyl)-4-hydroxybenzenepropanoic acid, octyl ester.
Figure A-21. 13C Nuclear Magnetic Resonance Spectrum of tBuPrOcEst-BZT (Lot 09022015)
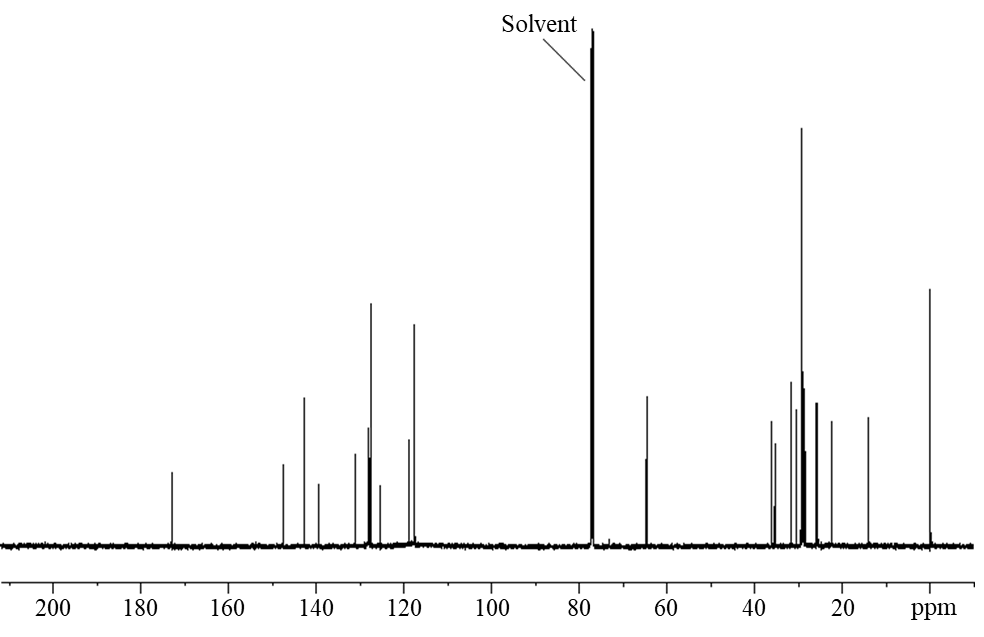
tBuPrOcEst-BZT = 3-(2H-benzotriazol-2-yl)-5-(1,1-dimethylethyl)-4-hydroxybenzenepropanoic acid, octyl ester.
A.2.8. 2-(5-chloro-2H-1,2,3-benzotriazol-2-yl)-6-(1,1-dimethylethyl)-4-methylphenol (Bumetrizole)
Table A-11. Results of Analyses of Dose Formulations Administered to Male Rats in the Two-week Gavage Study of Bumetrizole
| Date Prepared | Dates Analyzed | Target Concentration (mg/mL) | Determined Concentration (mg/mL)a | Difference from Target (%) |
|---|---|---|---|---|
| January 18, 2016 | January 22–25, 2016 | 0 | BLOQ | NA |
| 6 | 5.79 ± 0.01 | −3.4 | ||
| 20 | 19.8 ± 0.0 | −1.0 | ||
| 60 | 58.9 ± 0.2 | −1.9 | ||
| 200 | 198 ± 1 | −1.2 | ||
| Animal room samples | ||||
| January 18, 2016 | February 19–20, 2016 | 0 | BLOQ | NA |
| 6 | 5.94 ± 0.00 | −1.0 | ||
| 20 | 19.7 ± 0.1 | −1.7 | ||
| 60 | 60.5 ± 0.1 | 0.9 | ||
| 200 | 209 ± 1 | 4.5 | ||
Figure A-22. Infrared Absorption Spectrum of Bumetrizole (Lot 120936)
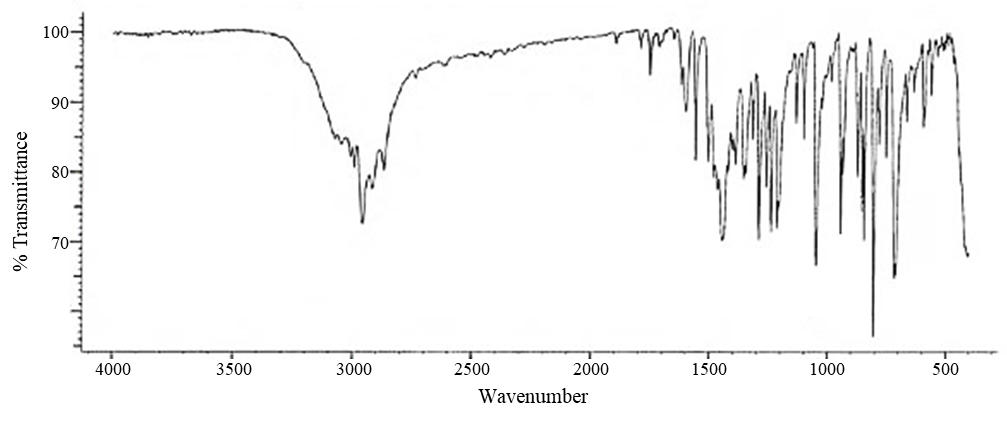
Bumetrizole = 2-(5-chloro-2H-1,2,3-benzotriazol-2-yl)-6-(1,1-dimethylethyl)-4-methylphenol.
Figure A-23. 1H Nuclear Magnetic Resonance Spectrum of Bumetrizole (Lot 120936)
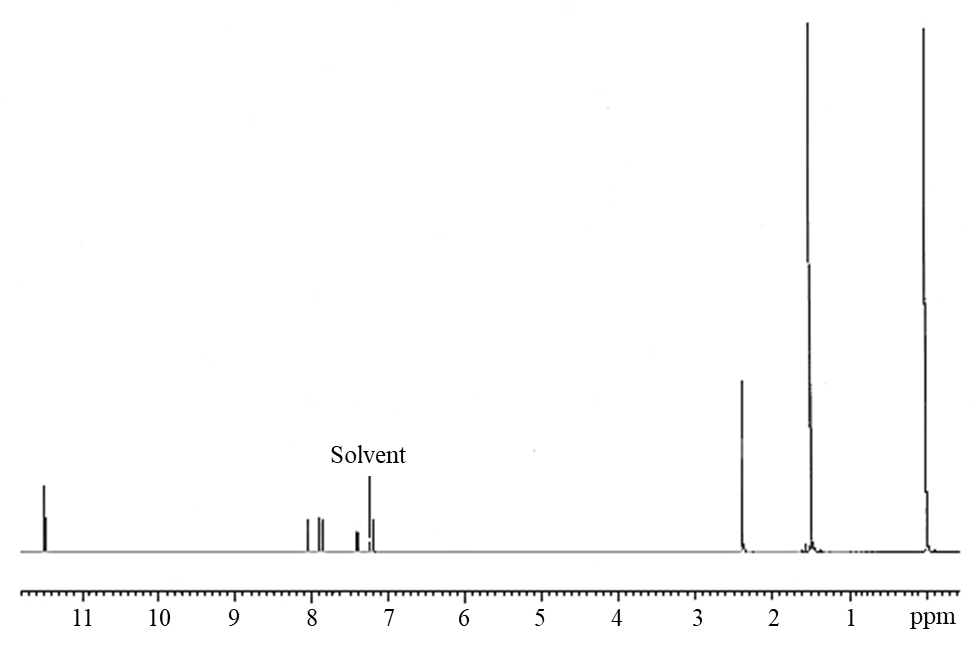
Bumetrizole = 2-(5-chloro-2H-1,2,3-benzotriazol-2-yl)-6-(1,1-dimethylethyl)-4-methylphenol.
Figure A-24. 13C Nuclear Magnetic Resonance Spectrum of Bumetrizole (Lot 120936)
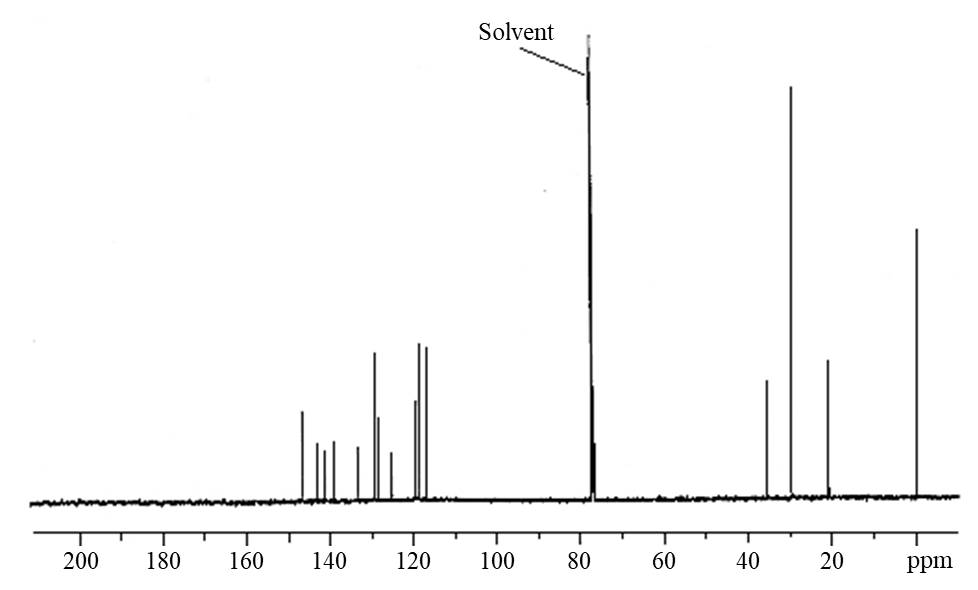
Bumetrizole = 2-(5-chloro-2H-1,2,3-benzotriazol-2-yl)-6-(1,1-dimethylethyl)-4-methylphenol.
A.2.9. 2-(5-chloro-2H-benzotriazol-2-yl)-4,6-bis(1,1-dimethylethyl)phenol (ditBuCl-BZT)
Table A-12. Results of Analyses of Dose Formulations Administered to Male Rats in the Two-week Gavage Study of ditBuCl-BZT
| Date Prepared | Dates Analyzed | Target Concentration (mg/mL) | Determined Concentration (mg/mL)a | Difference from Target (%) |
|---|---|---|---|---|
| January 4, 2016 | January 5–6, 2016 | 0 | BLOQ | NA |
| 6 | 5.72 ± 0.03 | −4.7 | ||
| 20 | 19.1 ± 0.1 | −4.7 | ||
| 60 | 58.3 ± 0.1 | −2.8 | ||
| 200 | 197 ± 1 | −1.7 | ||
| Animal room samples | ||||
| January 4, 2016 | February 10–11, 2016 | 0 | BLOQ | NA |
| 6 | 5.83 ± 0.03 | −2.8 | ||
| 20 | 20.1 ± 0.6 | 0.7 | ||
| 60 | 59.8 ± 0.2 | −0.3 | ||
| 200 | 199 ± 2 | −0.7 | ||
Figure A-25. Infrared Absorption Spectrum of ditBuCl-BZT (Lot 120937)
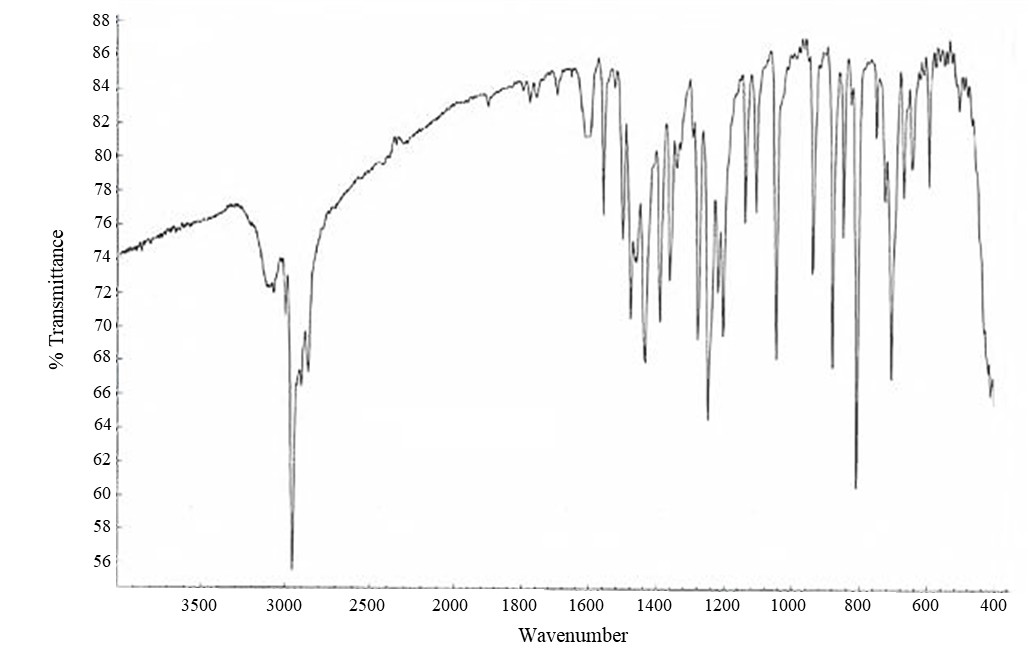
ditBuCl-BZT = 2-(5-chloro-2H-benzotriazol-2-yl)-4,6-bis(1,1-dimethylethyl)phenol.
Figure A-26. 1H Nuclear Magnetic Resonance Spectrum of ditBuCl-BZT (Lot 120937)
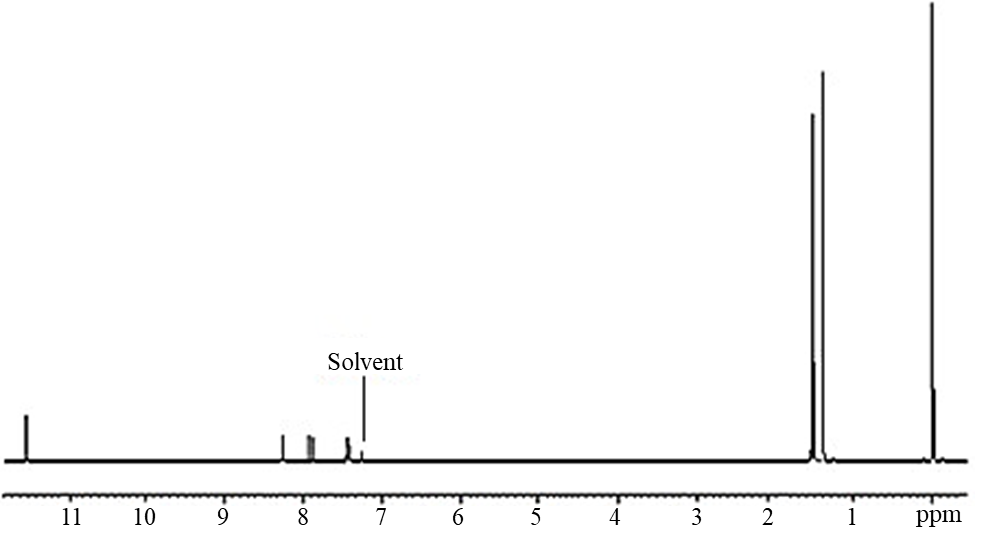
ditBuCl-BZT = 2-(5-chloro-2H-benzotriazol-2-yl)-4,6-bis(1,1-dimethylethyl)phenol.
Figure A-27. 13C Nuclear Magnetic Resonance Spectrum of ditBuCl-BZT (Lot 120937)
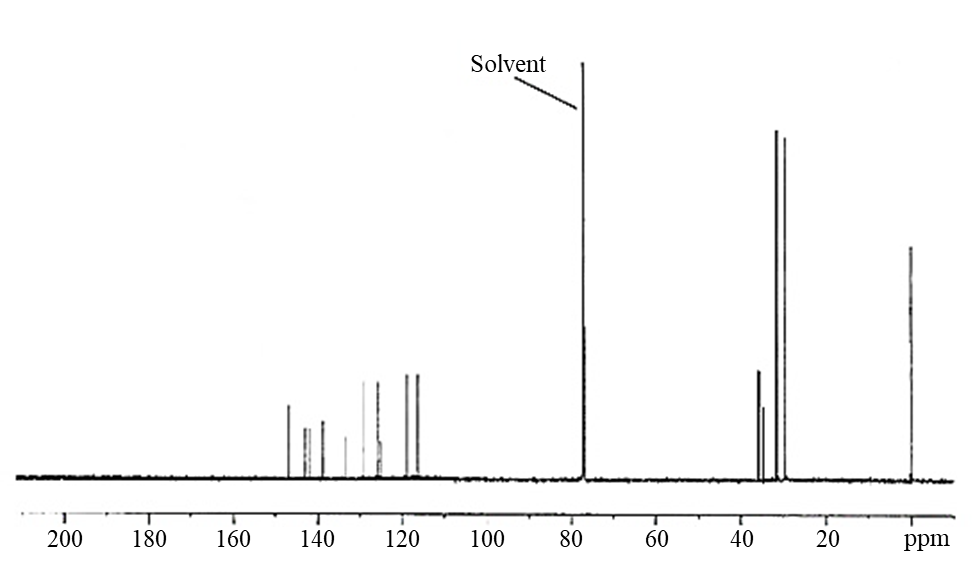
ditBuCl-BZT = 2-(5-chloro-2H-benzotriazol-2-yl)-4,6-bis(1,1-dimethylethyl)phenol.
Appendix B. Ingredients, Nutrient Composition, and Contaminant Levels in NTP-2000 Rat Ration
Table B-1. Ingredients of NTP-2000 Rat Ration
| Ingredients | Percent by Weight |
|---|---|
| Ground hard winter wheat | 23.00 |
| Ground #2 yellow shelled corn | 22.44 |
| Wheat middlings | 15.0 |
| Oat hulls | 8.5 |
| Alfalfa meal (dehydrated, 17% protein) | 7.5 |
| Purified cellulose | 5.5 |
| Soybean meal (49% Protein) | 4.0 |
| Fish meal (60% Protein) | 4.0 |
| Corn oil (without Preservatives) | 3.0 |
| Soy oil (without Preservatives) | 3.0 |
| Dried brewer’s yeast | 1.0 |
| Calcium carbonate (USP) | 0.9 |
| Vitamin premixa | 0.5 |
| Mineral premixb | 0.5 |
| Calcium phosphate, dibasic (USP) | 0.4 |
| Sodium chloride | 0.3 |
| Choline chloride (70% choline) | 0.26 |
| Methionine | 0.2 |
Table B-1. Ingredients of NTP-2000 Rat Ration
| Ingredients | Percent by Weight |
|---|---|
| Ground hard winter wheat | 23.00 |
| Ground #2 yellow shelled corn | 22.44 |
| Wheat middlings | 15.0 |
| Oat hulls | 8.5 |
| Alfalfa meal (dehydrated, 17% protein) | 7.5 |
| Purified cellulose | 5.5 |
| Soybean meal (49% Protein) | 4.0 |
| Fish meal (60% Protein) | 4.0 |
| Corn oil (without Preservatives) | 3.0 |
| Soy oil (without Preservatives) | 3.0 |
| Dried brewer’s yeast | 1.0 |
| Calcium carbonate (USP) | 0.9 |
| Vitamin premixa | 0.5 |
| Mineral premixb | 0.5 |
| Calcium phosphate, dibasic (USP) | 0.4 |
| Sodium chloride | 0.3 |
| Choline chloride (70% choline) | 0.26 |
| Methionine | 0.2 |
Table B-2. Vitamins and Minerals in NTP-2000 Rat Ration
| Amounta | Source | |
|---|---|---|
| Vitamins | ||
| Vitamin A | 4,000 IU | Stabilized vitamin A palmitate or acetate |
| Vitamin D | 1,000 IU | D-activated animal sterol |
| Vitamin K | 1.0 mg | Menadione sodium bisulfite complex |
| α-Tocopheryl acetate | 100 IU | – |
| Niacin | 23 mg | – |
| Folic acid | 1.1 mg | – |
| d-Pantothenic acid | 10 mg | d-Calcium pantothenate |
| Riboflavin | 3.3 mg | – |
| Thiamine | 4 mg | Thiamine mononitrate |
| B12 | 52 µg | – |
| Pyridoxine | 6.3 mg | Pyridoxine hydrochloride |
| Biotin | 0.2 mg | d-Biotin |
| Minerals | ||
| Magnesium | 514 mg | Magnesium oxide |
| Iron | 35 mg | Iron sulfate |
| Zinc | 12 mg | Zinc oxide |
| Manganese | 10 mg | Manganese oxide |
| Copper | 2.0 mg | Copper sulfate |
| Iodine | 0.2 mg | Calcium iodate |
| Chromium | 0.2 mg | Chromium acetate |
Table B-2. Vitamins and Minerals in NTP-2000 Rat Ration
| Amounta | Source | |
|---|---|---|
| Vitamins | ||
| Vitamin A | 4,000 IU | Stabilized vitamin A palmitate or acetate |
| Vitamin D | 1,000 IU | D-activated animal sterol |
| Vitamin K | 1.0 mg | Menadione sodium bisulfite complex |
| α-Tocopheryl acetate | 100 IU | – |
| niacin | 23 mg | – |
| Folic acid | 1.1 mg | – |
| d-Pantothenic acid | 10 mg | d-Calcium pantothenate |
| Riboflavin | 3.3 mg | – |
| Thiamine | 4 mg | Thiamine mononitrate |
| B12 | 52 µg | – |
| Pyridoxine | 6.3 mg | Pyridoxine hydrochloride |
| Biotin | 0.2 mg | d-Biotin |
| Minerals | ||
| Magnesium | 514 mg | Magnesium oxide |
| Iron | 35 mg | Iron sulfate |
| Zinc | 12 mg | Zinc oxide |
| Manganese | 10 mg | Manganese oxide |
| Copper | 2.0 mg | Copper sulfate |
| Iodine | 0.2 mg | Calcium iodate |
| Chromium | 0.2 mg | Chromium acetate |
Table B-3. Nutrient Composition of NTP-2000 Rat Ration
| Nutrient | Mean ± Standard Deviation | Range | Number of Samples |
|---|---|---|---|
| Protein (% by weight) | 15.0 ± 0.283 | 14.8–15.2 | 2 |
| Crude fat (% by weight) | 8.35 ± 0.071 | 8.3–8.4 | 2 |
| Crude fiber (% by weight) | 9.67 ± 0.017 | 9.55–9.79 | 2 |
| Ash (% by weight) | 4.89 ± 0.113 | 4.81–4.97 | 2 |
| Amino acids (% of total diet) | |||
| Arginine | 0.808 ± 0.073 | 0.67–0.97 | 31 |
| Cystine | 0.220 ± 0.021 | 0.15–0.25 | 31 |
| Glycine | 0.703 ± 0.037 | 0.62–0.8 | 31 |
| Histidine | 0.341 ± 0.068 | 0.27–0.68 | 31 |
| Isoleucine | 0.548 ± 0.039 | 0.43–0.66 | 31 |
| Leucine | 1.096 ± 0.061 | 0.96–1.24 | 31 |
| Lysine | 0.070 ± 0.101 | 0.31–0.86 | 31 |
| Methionine | 0.409 ± 0.040 | 0.26–0.49 | 31 |
| Phenylalanine | 0.623 ± 0.045 | 0.471–0.72 | 31 |
| Threonine | 0.513 ± 0.040 | 0.43–0.61 | 31 |
| Tryptophan | 0.156 ± 0.026 | 0.11–0.2 | 31 |
| Tyrosine | 0.425 ± 0.064 | 0.28–0.54 | 31 |
| Valine | 0.666 ± 0.038 | 0.55–0.73 | 31 |
| Essential fatty acids (% of total diet) | |||
| Linoleic | 3.927 ± 0.238 | 3.49–4.55 | 31 |
| Linolenic | 0.304 ± 0.030 | 0.21–0.368 | 31 |
| Vitamins | |||
| Vitamin A (IU/kg) | 3,545 ± 205.77 | 2,090–5,000 | 2 |
| Vitamin D (IU/kg) | 1,000a | – | – |
| α-Tocopherol (ppm) | 2,376 ± 12,602 | 13.6–69,100 | 30 |
| Thiamine (ppm)b | 7.55 ± 0.212 | 7.4–7.7 | 2 |
| Riboflavin (ppm) | 8.32 ± 2.868 | 4.2–17.5 | 31 |
| Niacin (ppm) | 79.78 ± 8.978 | 66.4–98.2 | 31 |
| Pantothenic acid (ppm) | 26.28 ± 10.69 | 17.4–81.0 | 31 |
| Pyridoxine (ppm)b | 9.832 ± 2.080 | 6.44–14.3 | 31 |
| Folic acid (ppm) | 1.61 ± 0.434 | 1.15–3.27 | 31 |
| Biotin (ppm) | 0.319 ± 0.113 | 0.0–0.704 | 31 |
| B12 (ppb) | 49.82 ± 33.79 | 18.3–174.0 | 31 |
| Choline (as chloride) (ppm) | 2,553 ± 632 | 1,160–3,790 | 31 |
| Minerals | |||
| Calcium (%) | 0.965 ± 0.004 | 0.962–0.968 | 2 |
| Phosphorus (%) | 0.573 ± 0.001 | 0.572–0.573 | 2 |
| Potassium (%) | 0.663 ± 0.035 | 0.563–0.733 | 31 |
| Chloride (%) | 0.389 ± 0.044 | 0.3–0.517 | 31 |
| Sodium (%) | 0.194 ± 0.027 | 0.153–0.283 | 31 |
| Magnesium (%) | 0.216 ± 0.052 | 0.185–0.49 | 31 |
| Iron (ppm) | 190.0 ± 35.69 | 135–311 | 31 |
| Manganese (ppm) | 49.87 ± 9.15 | 21.0–73.1 | 31 |
| Zinc (ppm) | 56.53 ± 24.87 | 42.5–184 | 31 |
| Copper (ppm) | 7.64 ± 2.42 | 3.21–16.3 | 31 |
| Iodine (ppm) | 0.50 ± 0.232 | 0–0.972 | 31 |
| Chromium (ppm) | 1.164 ± 1.16 | 0.33–3.97 | 30 |
| Cobalt (ppm) | 0.217 ± 0.148 | 0.086–0.864 | 29 |
Table B-3. Nutrient Composition of NTP-2000 Rat Ration
| Nutrient | Mean ± Standard Deviation | Range | Number of Samples |
|---|---|---|---|
| Protein (% by weight) | 15.0 ± 0.283 | 14.8–15.2 | 2 |
| Crude fat (% by weight) | 8.35 ± 0.071 | 8.3–8.4 | 2 |
| Crude fiber (% by weight) | 9.67 ± 0.017 | 9.55–9.79 | 2 |
| Ash (% by weight) | 4.89 ± 0.113 | 4.81–4.97 | 2 |
| Amino acids (% of total diet) | |||
| Arginine | 0.808 ± 0.073 | 0.67–0.97 | 31 |
| Cystine | 0.220 ± 0.021 | 0.15–0.25 | 31 |
| Glycine | 0.703 ± 0.037 | 0.62–0.8 | 31 |
| Histidine | 0.341 ± 0.068 | 0.27–0.68 | 31 |
| Isoleucine | 0.548 ± 0.039 | 0.43–0.66 | 31 |
| Leucine | 1.096 ± 0.061 | 0.96–1.24 | 31 |
| Lysine | 0.070 ± 0.101 | 0.31–0.86 | 31 |
| Methionine | 0.409 ± 0.040 | 0.26–0.49 | 31 |
| Phenylalanine | 0.623 ± 0.045 | 0.471–0.72 | 31 |
| Threonine | 0.513 ± 0.040 | 0.43–0.61 | 31 |
| Tryptophan | 0.156 ± 0.026 | 0.11–0.2 | 31 |
| Tyrosine | 0.425 ± 0.064 | 0.28–0.54 | 31 |
| Valine | 0.666 ± 0.038 | 0.55–0.73 | 31 |
| Essential fatty acids (% of total diet) | |||
| Linoleic | 3.927 ± 0.238 | 3.49–4.55 | 31 |
| Linolenic | 0.304 ± 0.030 | 0.21–0.368 | 31 |
| Vitamins | |||
| Vitamin A (IU/kg) | 3,545 ± 205.77 | 2,090–5,000 | 2 |
| Vitamin D (IU/kg) | 1,000a | – | – |
| α-Tocopherol (ppm) | 2,376 ± 12,602 | 13.6–69,100 | 30 |
| Thiamine (ppm)b | 7.55 ± 0.212 | 7.4–7.7 | 2 |
| Riboflavin (ppm) | 8.32 ± 2.868 | 4.2–17.5 | 31 |
| Niacin (ppm) | 79.78 ± 8.978 | 66.4–98.2 | 31 |
| Pantothenic acid (ppm) | 26.28 ± 10.69 | 17.4–81.0 | 31 |
| Pyridoxine (ppm)b | 9.832 ± 2.080 | 6.44–14.3 | 31 |
| Folic acid (ppm) | 1.61 ± 0.434 | 1.15–3.27 | 31 |
| Biotin (ppm) | 0.319 ± 0.113 | 0.0–0.704 | 31 |
| B12 (ppb) | 49.82 ± 33.79 | 18.3–174.0 | 31 |
| Choline (as chloride) (ppm) | 2,553 ± 632 | 1,160–3,790 | 31 |
| Minerals | |||
| Calcium (%) | 0.965 ± 0.004 | 0.962–0.968 | 2 |
| Phosphorus (%) | 0.573 ± 0.001 | 0.572–0.573 | 2 |
| Potassium (%) | 0.663 ± 0.035 | 0.563–0.733 | 31 |
| Chloride (%) | 0.389 ± 0.044 | 0.3–0.517 | 31 |
| Sodium (%) | 0.194 ± 0.027 | 0.153–0.283 | 31 |
| Magnesium (%) | 0.216 ± 0.052 | 0.185–0.49 | 31 |
| Iron (ppm) | 190.0 ± 35.69 | 135–311 | 31 |
| Manganese (ppm) | 49.87 ± 9.15 | 21.0–73.1 | 31 |
| Zinc (ppm) | 56.53 ± 24.87 | 42.5–184 | 31 |
| Copper (ppm) | 7.64 ± 2.42 | 3.21–16.3 | 31 |
| Iodine (ppm) | 0.50 ± 0.232 | 0–0.972 | 31 |
| Chromium (ppm) | 1.164 ± 1.16 | 0.33–3.97 | 30 |
| Cobalt (ppm) | 0.217 ± 0.148 | 0.086–0.864 | 29 |
Table B-4. Contaminant Levels in NTP-2000 Rat Ration
| Mean ± Standard Deviation | Range | Number of Samples | |
|---|---|---|---|
| Contaminants | |||
| Arsenic (ppm) | 0.272 ± 0.06 | 0.229–0.314 | 2 |
| Cadmium (ppm) | 0.051 ± 0.001 | 0.05–0.051 | 2 |
| Lead (ppm) | 0.085 ± 0.008 | 0.079–0.091 | 2 |
| Mercury (ppm) | 0.01 ± 0.00 | 0.01–0.01 | 2 |
| Selenium (ppm) | 0.165 ± 0.034 | 0.141–0.189 | 2 |
| Aflatoxins (ppb)a | <5.0 | – | 2 |
| Nitrate nitrogen (ppm)b | 10.35 ± 0.212 | 10.2–10.5 | 2 |
| Nitrite nitrogen (ppm)b | 0.121 ± 0.001 | 0.12–0.122 | 2 |
| BHA (ppm)a,c | <1.0 | – | 2 |
| BHT (ppm)a,c | <1.0 | – | 2 |
| Aerobic plate count (CFU/g)d | <10.0 | – | 2 |
| Coliform (MPN/g)d | <3 | – | 2 |
| Escherichia coli (MPN/g)d | <3 | – | 2 |
| Salmonella sp. (MPN/g) | Negative | – | 2 |
| Total nitrosamines (ppb)e | 9.35 ± 4.738 | 6.3–12.7 | 2 |
| N-Nitrosodimethylamine (ppb)e | 2.75 ± 3.889 | 0.0–5.5 | 2 |
| N-Nitrosopyrrolidine (ppb)e | 6.6 ± 0.849 | 6.0–7.2 | 2 |
| Pesticides (ppm)f | |||
| Methyl chlorpyrifos | 0.088 ± 0.008 | 0.082–0.093 | 2 |
| Malathion | 0.058 ± 0.053 | 0.02–0.095 | 2 |
Table B-4. Contaminant Levels in NTP-2000 Rat Ration
| Mean ± Standard Deviation | Range | Number of Samples | |
|---|---|---|---|
| Contaminants | |||
| Arsenic (ppm) | 0.272 ± 0.06 | 0.229–0.314 | 2 |
| Cadmium (ppm) | 0.051 ± 0.001 | 0.05–0.051 | 2 |
| Lead (ppm) | 0.085 ± 0.008 | 0.079–0.091 | 2 |
| Mercury (ppm) | 0.01 ± 0.00 | 0.01–0.01 | 2 |
| Selenium (ppm) | 0.165 ± 0.034 | 0.141–0.189 | 2 |
| Aflatoxins (ppb)a | <5.0 | – | 2 |
| Nitrate nitrogen (ppm)b | 10.35 ± 0.212 | 10.2–10.5 | 2 |
| Nitrite nitrogen (ppm)b | 0.121 ± 0.001 | 0.12–0.122 | 2 |
| BHA (ppm)a,c | <1.0 | – | 2 |
| BHT (ppm)a,c | <1.0 | – | 2 |
| Aerobic plate count (CFU/g)d | <10.0 | – | 2 |
| Coliform (MPN/g)d | <3 | – | 2 |
| Escherichia coli (MPN/g)d | <3 | – | 2 |
| Salmonella sp. (MPN/g) | Negative | – | 2 |
| Total nitrosamines (ppb)e | 9.35 ± 4.738 | 6.3–12.7 | 2 |
| N-Nitrosodimethylamine (ppb)e | 2.75 ± 3.889 | 0.0–5.5 | 2 |
| N-Nitrosopyrrolidine (ppb)e | 6.6 ± 0.849 | 6.0–7.2 | 2 |
| Pesticides (ppm)f | |||
| Methyl chlorpyrifos | 0.088 ± 0.008 | 0.082–0.093 | 2 |
| Malathion | 0.058 ± 0.053 | 0.02–0.095 | 2 |
Appendix C. Sentinel Animal Program
C.1. Methods
Rodents used in the National Toxicology Program are produced in optimally clean facilities to eliminate potential pathogens that might affect study results. The Sentinel Animal Program is part of the periodic monitoring of animal health that occurs during the toxicological evaluation of test compounds. Under this program, the disease state of the rodents is monitored via sera or feces from extra (sentinel) or dosed animals in the study rooms. The sentinel animals and the study animals are subject to identical environmental conditions. Furthermore, the sentinel animals come from the same production source and weanling groups as the animals used for the studies of test compounds.
In these toxicity studies, blood samples were collected from each sentinel animal and allowed to clot, and the serum was separated. Additionally, fecal samples were collected and tested for endoparasites. All samples were processed appropriately with serology testing performed by IDEXX BioResearch (formerly Rodent Animal Diagnostic Laboratory [RADIL], University of Missouri), Columbia, MO, for determination of the presence of pathogens. Evaluation for endo- and ectoparasites was performed in-house by the testing laboratory.
The laboratory methods and agents for which testing was performed are tabulated below; the times at which samples were collected during the studies are also listed (Table C-1).
C.2. Results
Rats: All test results were negative.
Table C-1. Methods and Results for Sentinel Animal Testing in Male Rats
| Collection Time Point | Two-week Studies |
|---|---|
| Quarantine | |
| Number examined | 10 |
| Method/test | |
| Multiplex fluorescent immunoassay (MFI) | |
| Kilham rat virus (KRV) | – |
| Mycoplasma pulmonis | – |
| Pneumonia virus of mice (PVM) | – |
| Rat coronavirus/sialodacryoadenitis virus (RCV/SDA) | – |
| Rat minute virus (RMV) | – |
| Rat parvo virus (RPV) | – |
| Rat theilovirus (RTV) | – |
| Sendai | – |
| Theiler’s murine encephalomyelitis virus (TMEV) | – |
| Toolan’s H-1 | – |
| In-house evaluation | |
| Endoparasites (evaluation of cecal content) | – |
| Ectoparasites (evaluation of perianal surface) | – |
Appendix D. Genetic Toxicology
D.1. Evaluation Protocol
National Toxicology Program (NTP) reports consider biological as well as statistical factors to determine an overall assay result. For an individual assay, the statistical procedures for data analysis are described in the following protocols. There have been instances, however, in which multiple samples of a chemical were tested in the same assay, and different results were obtained among these samples and/or among laboratories. In such cases, all the data are critically evaluated with attention given to possible protocol variations in determining the weight of evidence for an overall conclusion of chemical activity in an assay. The summary table in the abstract of this Toxicity Report presents the Division of Translational Toxicology’s (DTT’s) scientific judgment regarding the overall evidence for activity of the chemical in an assay.
D.2. Micronucleus Assay
D.2.1. Peripheral Blood Micronucleus Test Protocol
Peripheral blood samples were analyzed by Integrated Laboratory Systems, LLC (ILS; Research Triangle Park, NC) for determination of erythrocyte micronucleus frequencies. At termination of the 2-week toxicity studies of phenolic benzotriazoles, blood samples (approximately 200 μL) were collected from male rats, placed in ethylenediaminetetraacetic acid (EDTA)-coated tubes, and shipped overnight to the testing laboratory. Upon arrival, blood samples were fixed in ultracold methanol using a MicroFlowPLUS Kit (Litron Laboratories, Rochester, NY) according to the manufacturer’s instructions. Fixed samples were stored in a −80°C freezer until analysis. Thawed blood samples were analyzed for frequency of micronucleated immature erythrocytes (i.e., reticulocytes) and mature erythrocytes (ME) using a flow cytometer128; both the mature and immature erythrocyte populations can be analyzed separately by employing special cell surface markers to differentiate the two cell types. Because the very young reticulocyte subpopulation (CD71+ cells) can be targeted using this technique, rat blood samples can be analyzed for damage that occurred in the bone marrow within the past 24–48 hours, before the rat spleen appreciably alters the percentage of reticulocytes in circulation.129 Approximately 20,000 reticulocytes and 1 × 10⁶ erythrocytes were analyzed per animal for frequency of micronucleated cells, and the percentage of immature erythrocytes (% RET) was calculated as a measure of bone marrow toxicity resulting from chemical exposure.
128. Witt KL, Livanos E, Kissling GE, Torous DK, Caspary W, Tice RR, Recio L. Comparison of flow cytometry- and microscopy-based methods for measuring micronucleated reticulocyte frequencies in rodents treated with nongenotoxic and genotoxic chemicals. Mutat Res. 2008; 649(1-2):101-113. DOI: 10.1016/j.mrgentox.2007.08.004 PubMed: 17869571
129. Dertinger SD, Camphausen K, MacGregor JT, Bishop ME, Torous DK, Avlasevich S, Cairns S, Tometsko CR, Menard C, Muanza T, et al. Three‐color labeling method for flow cytometric measurement of cytogenetic damage in rodent and human blood. Environ Mol Mutagen. 2004; 44(5):427-435. DOI: 10.1002/em.20075 PubMed: 15517570
For evaluation of in vivo micronucleus data, the nonparametric statistical tests selected for trend and for pairwise comparisons with the control group make no assumptions about the underlying distribution of measurements and do not require equal variances among the groups. The Jonckheere test is used to test for linear trend, and the Dunn test is used for pairwise comparisons of each dosed group with the control group. To correct for multiple pairwise comparisons, the p value for each comparison with the control group is multiplied by the number of comparisons made. If this product is greater than 1.00, the value is replaced with 1.00.
In the micronucleus test, it is preferable to base a positive result on the presence of both a significant trend test and at least one significantly elevated dosed group compared to the corresponding control group. A response is equivocal if only the trend test is significant or if only a single dosed group is significantly increased over the control group. To maintain the overall significance level at 0.05 for positive and equivocal calls, the trend and pairwise differences are considered statistically significant if the one‐sided p value is ≤0.025 (0.05/2).
In addition, historical control data are used to evaluate the biological significance of any observed response. Both statistical significance and biological significance are considered when arriving at a call. The presence of either a positive trend or a single significant exposed group generally results in an equivocal call. The absence of both a trend and any significant differences between exposed groups and the control group results in a negative call. Ultimately, the scientific staff determines the final call after considering the results of statistical analyses, reproducibility of any effects observed (in acute studies), and the magnitudes of those effects.
D.2.2. Results
The genetic toxicity of phenolic benzotriazoles was evaluated in the peripheral blood micronucleus test in male rats. Micronucleated reticulocytes were not increased in male rats administered phenolic benzotriazoles for 2 weeks via gavage, except when administered 3-(2H-benzotriazol-2-yl)-5-(1,1-dimethylethyl)-4-hydroxybenzenepropanoic acid, octyl ester (tBuPrOcEst-BZT) (Table D-1 to Table D-9). Although a significant increase in micronucleated reticulocytes was observed in the 1,000 mg/kg/day tBuPrOcEst-BZT group, the increase was within the historical control 95% confidence interval and was judged to be an equivocal response. Administration of phenolic benzotriazoles did not affect the percentage of reticulocytes, indicating a lack of toxicity to the bone marrow.
Table D-1. Frequency of Micronuclei in Peripheral Blood Erythrocytes of Male Rats in the Two-week Gavage Study of P-BZT
| Number of Rats with Erythrocytes Scored | MN-RET/1,000a | P Valueb | MN-ME/1,000a | P Valueb | % RETa | P Valueb | |
|---|---|---|---|---|---|---|---|
| Dose (mg/kg/day) | |||||||
| 0 | 5 | 0.560 ± 0.06 | 0.102 ± 0.03 | 0.960 ± 0.08 | |||
| 30 | 5 | 0.750 ± 0.09 | 0.561 | 0.076 ± 0.01 | 1.000 | 1.082 ± 0.08 | 1.000 |
| 100 | 5 | 0.620 ± 0.14 | 1.000 | 0.078 ± 0.01 | 1.000 | 1.286 ± 0.13 | 0.157 |
| 300 | 5 | 0.340 ± 0.07 | 1.000 | 0.074 ± 0.01 | 1.000 | 1.348 ± 0.10 | 0.035 |
| 1,000 | 5 | 0.710 ± 0.10 | 0.730 | 0.097 ± 0.01 | 0.780 | 1.210 ± 0.06 | 0.157 |
| Trendc | p = 0.623 | p = 0.195 | p = 0.007 | ||||
Table D-2. Frequency of Micronuclei in Peripheral Blood Erythrocytes of Male Rats in the Two-week Gavage Study of Drometrizole
| Number of Rats with Erythrocytes Scored | MN-RET/1,000a | P Valueb | MN-ME/1,000a | P Valueb | % RETa | P Valueb | |
|---|---|---|---|---|---|---|---|
| Dose (mg/kg/day) | |||||||
| 0 | 5 | 0.580 ± 0.10 | 0.077 ± 0.01 | 1.248 ± 0.04 | |||
| 30 | 5 | 0.720 ± 0.13 | 1.000 | 0.061 ± 0.00 | 1.000 | 1.237 ± 0.07 | 1.000 |
| 100 | 5 | 0.640 ± 0.14 | 1.000 | 0.049 ± 0.00 | 1.000 | 1.459 ± 0.06 | 0.127 |
| 300 | 5 | 0.690 ± 0.09 | 1.000 | 0.050 ± 0.00 | 1.000 | 1.330 ± 0.10 | 0.731 |
| 1,000 | 5 | 0.755 ± 0.17 | 1.000 | 0.045 ± 0.00 | 1.000 | 1.298 ± 0.08 | 1.000 |
| Trendc | p = 0.299 | p = 1.000 | p = 0.315 | ||||
Table D-3. Frequency of Micronuclei in Peripheral Blood Erythrocytes of Male Rats in the Two-week Gavage Study of tBu-BZT
| Number of Rats with Erythrocytes Scored | MN-RET/1,000a | P Valueb | MN-ME/1,000a | P Valueb | % RETa | P Valueb | |
|---|---|---|---|---|---|---|---|
| Dose (mg/kg/day) | |||||||
| 0 | 5 | 1.000 ± 0.13 | 0.095 ± 0.02 | 1.454 ± 0.09 | |||
| 30 | 5 | 0.830 ± 0.03 | 1.000 | 0.095 ± 0.01 | 1.000 | 1.256 ± 0.10 | 1.000 |
| 100 | 5 | 0.760 ± 0.04 | 1.000 | 0.039 ± 0.01 | 1.000 | 1.471 ± 0.10 | 1.000 |
| 300 | 5 | 1.020 ± 0.16 | 1.000 | 0.063 ± 0.01 | 1.000 | 1.787 ± 0.11 | 0.488 |
| 1,000 | 5 | 1.090 ± 0.11 | 0.801 | 0.091 ± 0.02 | 1.000 | 2.360 ± 0.22 | 0.027 |
| Trendc | p = 0.135 | p = 0.805 | p = 0.000 | ||||
Table D-4. Frequency of Micronuclei in Peripheral Blood Erythrocytes of Male Rats in the Two-week Gavage Study of Octrizole
| Number of Rats with Erythrocytes Scored | MN-RET/1,000a | P Valueb | MN-ME/1,000a | P Valueb | % RETa | P Valueb | |
|---|---|---|---|---|---|---|---|
| Dose (mg/kg/day) | |||||||
| 0 | 5 | 0.890 ± 0.08 | 0.046 ± 0.01 | 1.192 ± 0.04 | |||
| 30 | 5 | 0.930 ± 0.17 | 1.000 | 0.037 ± 0.01 | 1.000 | 1.303 ± 0.11 | 1.000 |
| 100 | 5 | 0.900 ± 0.13 | 1.000 | 0.053 ± 0.01 | 1.000 | 1.75 ± 0.73 | 1.000 |
| 300 | 5 | 0.985 ± 0.05 | 0.953 | 0.038 ± 0.01 | 1.000 | 1.258 ± 0.05 | 1.000 |
| 1,000 | 5 | 1.220 ± 0.12 | 0.140 | 0.060 ± 0.01 | 0.605 | 1.253 ± 0.07 | 1.000 |
| Trendc | p = 0.030 | p = 0.169 | p = 0.667 | ||||
Table D-5. Frequency of Micronuclei in Peripheral Blood Erythrocytes of Male Rats in the Two-week Gavage Study of ditPe-BZT
| Number of Rats with Erythrocytes Scored | MN-RET/1,000a | P Valueb | MN-ME/1,000a | P Valueb | % RETa | P Valueb | |
|---|---|---|---|---|---|---|---|
| Dose (mg/kg/day) | |||||||
| 0 | 5 | 0.860 ± 0.11 | 0.125 ± 0.02 | 1.138 ± 0.08 | |||
| 30 | 5 | 1.030 ± 0.07 | 0.755 | 0.156 ± 0.01 | 0.244 | 1.058 ± 0.07 | 1.000 |
| 100 | 5 | 0.820 ± 0.15 | 1.000 | 0.124 ± 0.02 | 1.000 | 1.137 ± 0.05 | 1.000 |
| 300 | 5 | 0.969 ± 0.10 | 1.000 | 0.107 ± 0.00 | 1.000 | 1.107 ± 0.07 | 1.000 |
| 1,000 | 5 | 1.195 ± 0.18 | 0.393 | 0.125 ± 0.01 | 1.000 | 0.893 ± 0.13 | 0.677 |
| Trendc | p = 0.146 | p = 0.733 | p = 0.272 | ||||
Table D-6. Frequency of Micronuclei in Peripheral Blood Erythrocytes of Male Rats in the Two-week Gavage Study of diMeEtPh-BZT
| Number of Rats with Erythrocytes Scored | MN-RET/1,000a | P Valueb | MN-ME/1,000a | P Valueb | % RETa | P Valueb | |
|---|---|---|---|---|---|---|---|
| Dose (mg/kg/day) | |||||||
| 0 | 5 | 0.840 ± 0.06 | 0.077 ± 0.01 | 1.157 ± 0.05 | |||
| 30 | 5 | 0.870 ± 0.05 | 1.000 | 0.060 ± 0.01 | 1.000 | 1.198 ± 0.04 | 1.000 |
| 100 | 5 | 0.890 ± 0.10 | 1.000 | 0.050 ± 0.01 | 1.000 | 1.186 ± 0.05 | 1.000 |
| 300 | 5 | 0.730 ± 0.13 | 1.000 | 0.056 ± 0.01 | 1.000 | 1.174 ± 0.09 | 1.000 |
| 1,000 | 5 | 0.740 ± 0.08 | 1.000 | 0.046 ± 0.01 | 1.000 | 1.142 ± 0.10 | 1.000 |
| Trendc | p = 0.792 | p = 0.993 | p = 0.962 | ||||
Table D-7. Frequency of Micronuclei in Peripheral Blood Erythrocytes of Male Rats in the Two-week Gavage Study of tBuPrOcEst-BZT
| Number of Rats with Erythrocytes Scored | MN-RET/1,000a | P Valueb | MN-ME/1,000a | P Valueb | % RETa | P Valueb | |
|---|---|---|---|---|---|---|---|
| Dose (mg/kg/day) | |||||||
| 0 | 5 | 0.600 ± 0.11 | 0.090 ± 0.01 | 0.793 ± 0.11 | |||
| 30 | 5 | 0.597 ± 0.10 | 1.000 | 0.131 ± 0.02 | 0.288 | 0.918 ± 0.07 | 1.000 |
| 100 | 5 | 0.830 ± 0.09 | 0.160 | 0.130 ± 0.02 | 0.244 | 1.182 ± 0.12 | 0.192 |
| 300 | 5 | 0.660 ± 0.07 | 1.000 | 0.103 ± 0.02 | 1.000 | 0.841 ± 0.12 | 1.000 |
| 1,000 | 5 | 0.948 ± 0.07 | 0.019 | 0.297 ± 0.04 | 0.001 | 1.464 ± 0.39 | 0.488 |
| Trendc | p = 0.004 | p = 0.003 | p = 0.232 | ||||
Table D-8. Frequency of Micronuclei in Peripheral Blood Erythrocytes of Male Rats in the Two-week Gavage Study of Bumetrizole
| Number of Rats with Erythrocytes Scored | MN-RET/1,000a | P Valueb | MN-ME/1,000a | P Valueb | % RETa | P Valueb | |
|---|---|---|---|---|---|---|---|
| Dose (mg/kg/day) | |||||||
| 0 | 5 | 0.580 ± 0.06 | 0.038 ± 0.00 | 1.064 ± 0.04 | |||
| 30 | 5 | 0.670 ± 0.12 | 1.000 | 0.046 ± 0.00 | 0.650 | 1.200 ± 0.08 | 0.514 |
| 100 | 5 | 0.730 ± 0.06 | 0.277 | 0.048 ± 0.01 | 0.527 | 1.186 ± 0.06 | 0.470 |
| 300 | 4c | 0.613 ± 0.10 | 1.000 | 0.048 ± 0.01 | 0.451 | 1.061 ± 0.06 | 1.000 |
| 1,000 | 5 | 0.810 ± 0.07 | 0.113 | 0.035 ± 0.01 | 1.000 | 1.178 ± 0.06 | 0.779 |
| Trendd | p = 0.046 | p = 0.600 | p = 0.542 | ||||
Table D-9. Frequency of Micronuclei in Peripheral Blood Erythrocytes of Male Rats in the Two-week Gavage Study of ditBuCl-BZT
| Number of Rats with Erythrocytes Scored | MN-RET/1,000a | P Valueb | MN-ME/1,000a | P Valueb | % RETa | P Valueb | |
|---|---|---|---|---|---|---|---|
| Dose (mg/kg/day) | |||||||
| 0 | 5 | 0.646 ± 0.09 | 0.081 ± 0.02 | 1.361 ± 0.21 | |||
| 30 | 5 | 0.660 ± 0.11 | 1.000 | 0.079 ± 0.00 | 0.395 | 0.558 ± 0.03 | 0.03 |
| 100 | 5 | 0.810 ± 0.13 | 0.662 | 0.077± 0.03 | 1.000 | 0.780 ± 0.15 | 0.141 |
| 300 | 5 | 0.590 ± 0.08 | 1.000 | 0.070 ± 0.01 | 1.000 | 0.904 ± 0.09 | 0.790 |
| 1,000 | 5 | 0.740 ± 0.10 | 1.000 | 0.065 ± 0.01 | 1.000 | 1.098 ± 0.08 | 1.000 |
| Trendc | p = 0.324 | p = 0.733 | p = 0.315 | ||||
Appendix E. Bioactivity Screening of Select Phenolic Benzotriazoles Using Tox21 In Vitro Assay Data
E.1. Introduction
Thousands of chemical substances exist in the world, but only a small fraction of these have been adequately assessed for their potential toxicity to humans. The Toxicology in the 21st Century program, or Tox21, is a unique collaboration among several federal agencies to develop new methods to rapidly test the potential ability of thousands of substances to adversely affect human health. One method to rapidly generate compound-induced, human-relevant toxicity data is to use the quantitative high-throughput screening (qHTS) approach on a large number of substances based on in vitro, human cell-based assays. In Tox21 qHTS, to have better confidence in the compound potency data, each substance is tested using 15 concentrations (generally from 5 nM to 92 µM) in three different batches. Since 2011, approximately 10,000 substances have been screened in more than 70 assays covering mostly human stress response and nuclear receptor pathways. The data provide rich resources to query activities of compounds of interest, such as the class of phenolic benzotriazoles.
E.2. Materials and Methods
The data were analyzed as described in a publication by Hsieh et al.130 The concentration-response data per substance for each batch (each batch was conducted on different days) were analyzed separately using the Curvep algorithm in the Rcurvep package (v.1.2.0, https://cran.r-project.org/web/packages/Rcurvep/index.html), and activity metrics, including the point-of-departure (POD), maximum response (Emax), and weighted area under the curve (wAUC), were calculated. The POD is the compound potency at which the elicited response exceeds the noise threshold. The Emax is in the percentage scale, relative to the response elicited by the respective assay positive control (PC). In Tox21 assays, the baseline value of Emax is set to 0%. A positive or negative Emax value indicates an increasing or decreasing effect, respectively, and a higher absolute Emax value indicates a stronger effect. The wAUC is a summarized activity value that includes both potency and efficacy information and is weighted by both POD and the testing concentration range, thus allowing for proper across-chemical comparison.131,132 The activities from batches were summarized using the median, and known artifacts were flagged using integrative analysis on existing multiple data sources (e.g., readout data in the same screen, counter-screens, and/or external data). Additionally, the substance quality control (QC) information (compound identity, purity, and concentration) was included to remove data with poor QC. The final output from the analysis using the current data sets includes a total of 209 endpoints, each of which has the activity calls at the compound level with summary statistics and warning flags. The activity values at the compound level were summarized (mean) when testing substances had the same activity call (e.g., all active) and acceptable QC. For POD, values were calculated as the mean of log10(M) and then converted back to µM. The activity values resulting from the 209 endpoints were considered directly associated with the annotated target by excluding the current known assay artifacts.
130. Hsieh JH, Sedykh A, Huang R, Xia M, Tice RR. A data analysis pipeline accounting for artifacts in Tox21 quantitative high-throughput screening assays. J Biomol Screen. 2015; 20(7):887-897. DOI: 10.1177/1087057115581317 PubMed: 25904095
131. Hubbard TD, Hsieh JH, Rider CV, Sipes NS, Sedykh A, Collins BJ, Auerbach SS, Xia M, Huang R, Walker NJ, et al. Using Tox21 high-throughput screening assays for the evaluation of botanical and dietary supplements. Appl In Vitro Toxicol. 2019; 5(1):10-25. DOI: 10.1089/aivt.2018.0020 PubMed: 30944845
132. Sedykh A. CurveP method for rendering high-throughput screening dose-response data into digital fingerprints. In: Zhu H, Xia M, editors. High-Throughput Screening Assays in Toxicology. New York, NY: Humana Press; 2016. p. 135-141. 10.1007/978-1-4939-6346-1_14
The results were deposited into the NTP database and can be retrieved using the Tox21 Data Application Programming Interface (API) (https://rstudio.niehs.nih.gov/tox21_qhts_api/). The current Tox21 data sets cover 86 protocols and include a total of 209 endpoints. Of these endpoints for which data were collected, 89 are for detecting nonspecific effects (e.g., cytotoxicity) and 37 are for identifying autofluorescent chemical structures in various conditions. The remaining 83 endpoints are for detecting specific effects such as covering activation/inhibition of nuclear receptor pathways, activation of stress response pathways, and inhibition of cytochrome p450 (CYP).
E.3. Results
E.3.1. Activity of Select Phenolic Benzotriazoles in Tox21 Assays
The nine select phenolic benzotriazoles were:
Unsubstituted (0)
2-(2H-benzotriazol-2-yl)phenol (P-BZT)
Monosubstituted (1)
2-(2H-benzotriazol-2-yl)-4-methylphenol (drometrizole)
2-(2H-benzotriazol-2-yl)-4-tert-butylphenol (tBu-BZT)
2-(2H-benzotriazol-2-yl)-4-(1,1,3,3-tetramethylbutyl)phenol (octrizole)
Disubstituted (2)
2-(2H-benzotriazol-2-yl)-4,6-bis(1,1-dimethylpropyl)phenol (ditPe-BZT)
2-(2H-benzotriazol-2-yl)-4,6-bis(1-methyl-1-phenylethyl)phenol (diMeEtPh-BZT)
3-(2H-benzotriazol-2-yl)-5-(1,1-dimethylethyl)-4-hydroxybenzenepropanoic acid, octyl ester (tBuPrOcEst-BZT)
Trisubstituted (3)
2-(5-chloro-2H-1,2,3-benzotriazol-2-yl)-6-(1,1-dimethylethyl)-4-methylphenol (bumetrizole)
2-(5-chloro-2H-benzotriazol-2-yl)-4,6-bis(1,1-dimethylethyl)phenol (ditBuCl-BZT)
The number in the parentheses represents the number of substitutions on the unsubstituted base structure, P-BZT.
In the Tox21 library, five of the nine select phenolic benzotriazoles were included: drometrizole (1), octrizole (1), ditPe-BZT (2), diMeEtPh-BZT (2), and bumetrizole (3). Each phenolic benzotriazole can have multiple testing substances in the Tox21 library: drometrizole was identified to have three independent substances (Tox21_112369 [Tox21_112369_1 as an additional copy], Tox21_200876, Tox21_303578); octrizole was identified to have three independent substances (Tox21_112086 [Tox21_112086_1 as an additional copy], Tox21_201456, Tox21_300498); ditPe-BZT was identified to have one substance (Tox21_200465); diMeEtPh-BZT was identified to have one substance (Tox21_202571); and bumetrizole was identified to have one substance (Tox21_112379 [Tox21_112379_1 as an additional copy]).
For the five phenolic benzotriazoles in the Tox21 library, all copies of the substances from diMeEtPh-BZT and ditPe-BZT and one copy of the substances from octrizole (Tox21_112086_1) and from bumetrizole (Tox21_112379_1) had unacceptable QC. Only substances with acceptable QC (https://tripod.nih.gov/tox/samples) and their data were used to generate activity results at the substance level and then at the compound level. The substances with acceptable QC for at least one copy were drometrizole, octrizole, and bumetrizole. The activity results at the compound level are discussed throughout this appendix.
The activity results reported below include data for only three phenolic benzotriazoles: octrizole (n = 209 endpoints), drometrizole (n = 209 endpoints), and bumetrizole (n = 80 endpoints, fewer endpoints due to excluded data from Tox21_112379_1). The number of activities in endpoints is sorted as follows: drometrizole (n = 38) > octrizole (n = 36) > bumetrizole (n = 1). Despite drometrizole and octrizole causing a similar number of activities in endpoints, the activities induced by drometrizole were more potent than those caused by octrizole (Figure E-1). The activities induced by octrizole in specific targets had similar potency to the activities in the counter screens (cell viability). The only activity induced by bumetrizole in limited endpoints was from a counter screen with low potency (POD > 30 µM). The POD and Emax of the activities of drometrizole and octrizole are plotted in Figure E-1. The underlying activity data in Figure E-1 are provided in Table E-1 and Table E-2, including the experimental protocol information deposited in PubChem (https://pubchem.ncbi.nlm.nih.gov/).
Regarding the types of activities induced by drometrizole (Figure E-1; Table E-1), activities that were below 10 µM were mostly related to xenobiotic homeostasis, particularly activation of the pregnane X receptor (PXR) signaling pathway, the aryl hydrocarbon receptor (AhR) signaling pathway, the constitutive androstane receptor (CAR) signaling pathway, and the inhibition of CYP 1A2, 2C19, and 2C9. Other activities induced by drometrizole that were below 10 µM were related to inhibition of histone deacetylase (HDAC; epigenetic modification), activation of the estrogen-related receptor (ERR) signaling pathway with and without the presence of the PPARγ coactivator (PGC; energy homeostasis), activation of the retinoic acid receptor (RAR) signaling pathway (retinoid homeostasis), activation of the estrogen receptor alpha (ERα) signaling pathway (sex hormone homeostasis), and activation of the nuclear factor erythroid 2-related factor 2 (NRF2)-antioxidant response element (ARE) signaling pathway in keratinocytes (skin sensitization). Activation of PXR and AhR by drometrizole was also supported by other orthogonal ToxCast assays, including Attagene133 (available at https://comptox.epa.gov/dashboard/chemical/invitrodb/DTXSID1027479). Activation of ER (weak agonist) by drometrizole was supported by the literature (available at https://comptox.epa.gov/dashboard/chemical/bioactivity-toxcast-models/DTXSID1027479).
133. U.S. Environmental Protection Agency (USEPA). CompTox Chemicals Dashboard: 2-(2H-benzotriazol-2-yl)-4-methylphenol: 2440-22-4 | DTXSID1027479: Bioactivity - TOXCAST summary. Washington, DC: U.S. Environmental Protection Agency; 2023. [Accessed: November 16, 2023]. https://comptox.epa.gov/dashboard/chemical/invitrodb/DTXSID1027479
Regarding the types of activities induced by octrizole (Figure E-1; Table E-2), the only activity below 10 µM was related to xenobiotic homeostasis, specifically the inhibition of CYP2C9; all other activities were >10 µM.
Figure E-1. Drometrizole and Octrizole Activity in Tox21 Quantitative High-throughput Screening Assays
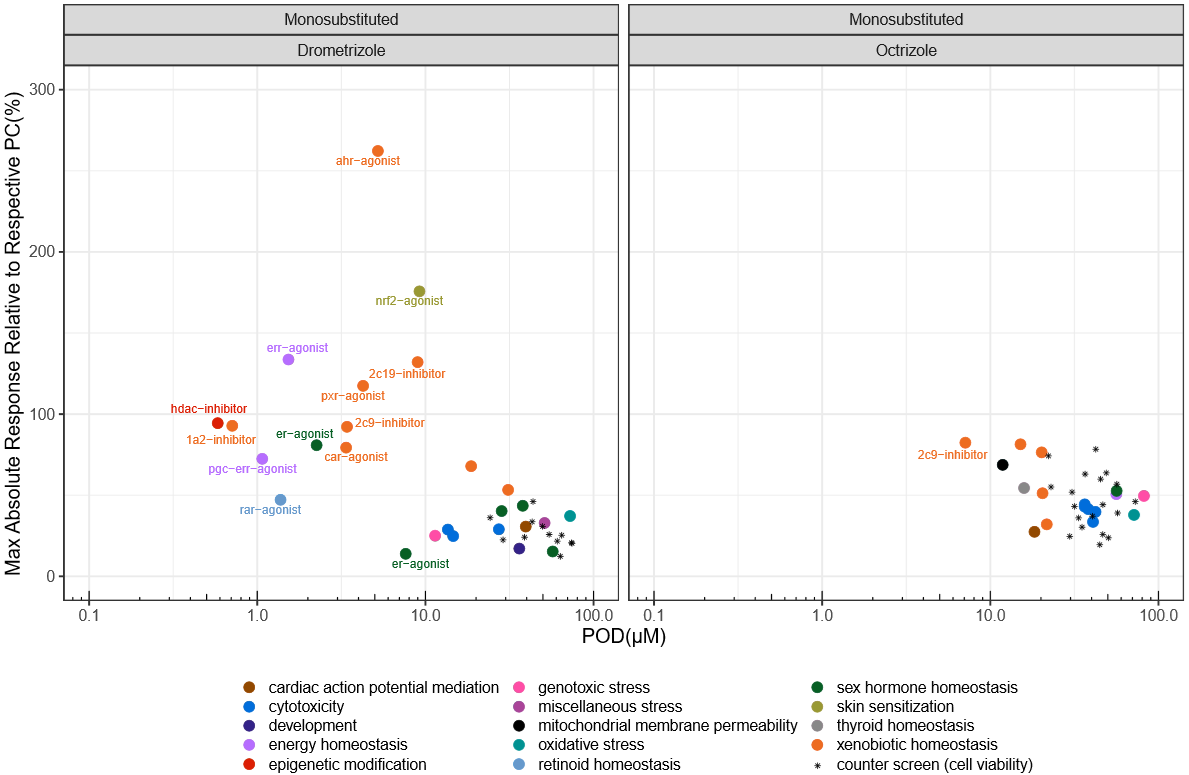
The absolute maximum response (Emax) values (y-axis) were plotted to facilitate cross-endpoint comparisons. The asterisks represent activities from counter screens, which were included to provide point-of-departure (POD) of cytotoxicity for each compound; overlapping endpoints and asterisks suggest lack of specificity for the endpoint effect. The target name is shown as a text label for noncounter screen endpoints when the POD < 10 µM; noncounter screen endpoints with POD ≥ 10 µM are not labeled with text. Different colors represent different target groups, which are shown in the figure legend. The underlying data and endpoint definitions are available in Table E-1 and Table E-2.
Drometrizole = 2-(2H-benzotriazol-2-yl)-4-methylphenol; Octrizole = 2-(2H-benzotriazol-2-yl)-4-(1,1,3,3-tetramethylbutyl)phenol; PC = positive control; POD = point-of-departure.
Table E-1. Summary of Drometrizole Activity Data in Tox21 Quantitative High-throughput Screening Assays
| Endpoint | Endpoint Definition | Target | Target Group | Lowest Tested Concentration (µM) | Highest Tested Concentration (µM) | POD (µM) | Emax (%) | # of Activity Calls of Substances | # of Activity Calls without Artifact Flags | PubChem AID |
|---|---|---|---|---|---|---|---|---|---|---|
| tox21-hdac-p1_hdac-inhibitor_1 | qHTS assay in HCT-116 cells to identify inhibitors of class I/II histone deacetylase (HDAC) enzymes | hdac-inhibitor | epigenetic modification | 6E−04 | 92.17 | 0.58 | −94.35 | 3 | 3 | 1259364; 1259388 (summary) |
| tox21-p450-1a2-p1_1a2-inhibitor_1 | Luciferase reporter qHTS assay for small molecule antagonists of Cytochrome P450 Family 1 Subfamily A Member 2 (CYP1A2) | 1a2-inhibitor | xenobiotic homeostasis | 1E−03 | 114.95 | 0.71 | −92.94 | 3 | 3 | 1671199 |
| tox21-pgc-err-p1_pgc-err-agonist_1 | qHTS assay in PGC/ERR HEK 293T cells to identify small molecule agonists of the Estrogen-Related Receptor (ERR) signaling pathway with the pleiotropic PPARγ coactivator (PGC) | pgc-err-agonist | energy homeostasis | 6E−04 | 92.17 | 1.07 | 72.39 | 3 | 3 | 1224842; 1259402 (summary) |
| tox21-rar-agonist-p1_rar-agonist_1 | Luciferase reporter qHTS assay in C3RL4 cells to identify small molecule agonists of the retinoic acid receptor (RAR) signaling pathway | rar-agonist | retinoid homeostasis | 6E−04 | 92.17 | 1.37 | 47.25 | 3 | 3 | 1159553 |
| tox21-err-p1_err-agonist_1 | qHTS assay in ERR HEK 293T cells to identify small molecule agonists of the ERR signaling pathway | err-agonist | energy homeostasis | 6E−04 | 92.17 | 1.54 | 133.66 | 3 | 3 | 1224849; 1259404 (summary) |
| tox21-er-luc-bg1-4e2-agonist-p2_er-agonist_1 | Luciferase reporter qHTS assay in BG1 cell line for small molecule agonists of the estrogen receptor alpha (ERα) signaling pathway | er-agonist | sex hormone homeostasis | 6E−04 | 92.17 | 2.26 | 80.94 | 3 | 3 | 743079 |
| tox21-car-agonist-p1_car-agonist_1 | qHTS assay in a double-stable (hCAR and CYP2B6-2.2kb) transfected cell line derived from HepG2 cells to identify small molecule agonists of the constitutive androstane receptor (CAR) signaling pathway | car-agonist | xenobiotic homeostasis | 6E−04 | 92.17 | 3.37 | 79.53 | 3 | 3 | 1224839; 1224892 (summary) |
| tox21-p450-2c9-p1_2c9-inhibitor_1 | Luciferase reporter qHTS assay for small molecule antagonists of CYP2C9 | 2c9-inhibitor | xenobiotic homeostasis | 7E−04 | 114.95 | 3.43 | −92.30 | 3 | 3 | 1671198 |
| tox21-pxr-p1_pxr-agonist_1 | Luciferase reporter qHTS assay in PXR-Luc HepG2 cells to identify small molecule agonists of the human pregnane X receptor (PXR) | pxr-agonist | xenobiotic homeostasis | 6E−04 | 92.17 | 4.25 | 117.52 | 3 | 3 | 1346982; 1347033 (summary) |
| tox21-ahr-p1_ahr-agonist_1 | Luciferase reporter qHTS assay for small molecule agonists of the aryl hydrocarbon receptor (AhR) signaling pathway | ahr-agonist | xenobiotic homeostasis | 6E−04 | 92.17 | 5.21 | 262.26 | 3 | 3 | 743085; 743122 (summary) |
| tox21-er-luc-bg1-4e2-agonist-p4_er-agonist_1 | Luciferase reporter qHTS assay in VM7Luc4E2 cells to identify small molecule agonists of the ERα signaling pathway in the presence of an ER antagonist | er-agonist | sex hormone homeostasis | 6E−04 | 92.17 | 7.64 | 13.88 | 3 | 3 | 1259383; 1259391 (summary) |
| tox21-p450-2c19-p1_2c19-inhibitor_1 | Luciferase reporter qHTS assay for small molecule antagonists of CYP2C19 | 2c19-inhibitor | xenobiotic homeostasis | 7E−04 | 114.95 | 9.02 | −131.96 | 3 | 3 | 1671197 |
| tox21-ks-are-p1_nrf2-agonist_1 | qHTS assay to identify small molecule agonists of the nuclear factor erythroid 2-related factor 2/antioxidant response element (NRF2/ARE) pathway in human keratinocytes | nrf2-agonist | skin sensitization | 6E−04 | 92.17 | 9.22 | 175.70 | 3 | 3 | 1919969; 1919970 (summary) |
| tox21-elg1-luc-agonist-p1_atad5-inducer_1 | Luciferase reporter qHTS assay in HEK293T cells to identify small molecules that induce genotoxicity through expression of Enhanced Level of Genome Instability Gene1 (ELG1; human ATAD5) | atad5-inducer | genotoxic stress | 6E−04 | 92.17 | 11.43 | 24.84 | 3 | 3 | 651632; 720516 (summary) |
| tox21-rt-viability-hek293-p1_viability@glo_1 | qHTS RealTime-Glo MT Cell Viability Assay in HEK293 cells is a luciferase-based measure of cell viability based on luminescence over time; timepoints assayed were 0, 8, 16, 24, 32, and 40 hours | viability@glo | cytotoxicity | 5E−04 | 76.63 | 13.61 | −28.80 | 3 | 3 | NA |
| tox21-rt-viability-hek293-p1_viability@glo_16h_1 | qHTS RealTime-Glo MT Cell Viability Assay in HEK293 cells is a luciferase-based measure of cell viability based on luminescence at 16 hours | viability@glo_16h | cytotoxicity | 5E−04 | 76.63 | 14.54 | −24.96 | 3 | 3 | 1224872 |
| tox21-p450-2d6-p1_2d6-inhibitor_1 | Luciferase reporter qHTS assay for small molecule antagonists of CYP2D6 | 2d6-inhibitor | xenobiotic homeostasis | 7E−04 | 114.95 | 18.70 | −67.81 | 3 | 3 | 1671196 |
| tox21-mitotox-p1_viability_1 | qHTS CellTiter-Glo Cell Viability Assay in HepG2 cells is a measure of cell viability based on luminescence | viability | counter screen (cell viability) | 6E−04 | 92.17 | 24.25 | −36.10 | 3 | 3 | 720634 |
| tox21-rt-viability-hek293-p1_viability@glo_8h_1 | qHTS RealTime-Glo MT Cell Viability Assay in HEK293 cells is a luciferase-based measure of cell viability based on luminescence at 8 hours | viability@glo_8h | cytotoxicity | 5E−04 | 76.63 | 27.37 | −28.80 | 3 | 3 | 1224887 |
| tox21-ar-mda-kb2-luc-antagonist-p2_ar-antagonist_1 | Luciferase reporter qHTS assay for small molecule antagonists of the androgen receptor (AR) in the presence of the AR agonist R1881 using the MDA cell line | ar-antagonist | sex hormone homeostasis | 6E−04 | 92.17 | 28.45 | −40.14 | 3 | 3 | 1259243; 1259247 (summary) |
| tox21-hdac-p1_viability_1 | qHTS CellTiter-Glo Cell Viability Assay in HCT-116 cells is a measure of cell viability based on luminescence | viability | counter screen (cell viability) | 6E−04 | 92.17 | 28.95 | −22.46 | 3 | 3 | 1259365; 1259388 (summary) |
| tox21-p450-3a4-p1_3a4-inhibitor_1 | Luciferase reporter qHTS assay for small molecule antagonists of CYP3A4 | 3a4-inhibitor | xenobiotic homeostasis | 7E−04 | 114.95 | 30.95 | −53.39 | 3 | 3 | 1671201 |
| tox21-shh-3t3-gli3-agonist-p1_shh-agonist_1 | Luciferase reporter qHTS assay in 3T3 Gli1-Luc HepG2 cells to identify small molecule agonists of the sonic hedgehog (Shh) signaling pathway | shh-agonist | development | 1E−03 | 92.17 | 36.06 | 17.13 | 3 | 3 | 1259368; 1259390 (summary) |
| tox21-pr-bla-antagonist-p1_pr-antagonist_1 | β-lactamase reporter qHTS assay in PR-UAS-bla HEK293T cells to identify small molecule antagonists of the progesterone receptor (PR) signaling pathway | pr-antagonist | sex hormone homeostasis | 6E−04 | 92.17 | 37.84 | −43.67 | 3 | 2 | 1346795; 1347031 (summary) |
| tox21-sbe-bla-agonist-p1_viability_1 | qHTS CellTiter-Glo Cell Viability Assay in SBE-bla HEK 293T cells is a measure of cell viability based on luminescence | viability | counter screen (cell viability) | 5E−04 | 76.63 | 38.87 | −24.10 | 3 | 3 | 1346829 |
| tox21-herg-u2os-p1_herg-blocker_1 | qHTS assay in hERG-U2OS cells to identify small molecule antagonists of the human Ether-a-go-go-Related Gene (hERG) | herg-blocker | cardiac action potential mediation | 1E−03 | 76.63 | 39.55 | −30.71 | 3 | 3 | 1671200 |
| tox21-dt40-p1_viability@653_1 | qHTS assay for identifying genotoxic compounds that show differential cytotoxicity against isogenic chicken DT40 cell lines (wild-type); CellTiter-Glo was used to measure cell viability based on luminescence | viability@653 | cell viability | 6E−04 | 92.17 | 43.11 | −33.62 | 3 | 3 | 743012 |
| tox21-dt40-p1_viability@100_1 | qHTS assay for identifying genotoxic compounds that show differential cytotoxicity against isogenic chicken DT40 cell lines (Rad54/Ku70 double knockout mutant); CellTiter-Glo was used to measure cell viability based on luminescence | viability@100 | cell viability | 6E−04 | 92.17 | 43.64 | −46.10 | 3 | 3 | 743015 |
| tox21-cre-agonist-p1_viability_1 | qHTS CellTiter-Glo Cell Viability Assay in HEK293T cells is a measure of cell viability based on luminescence | viability | counter screen (cell viability) | 6E−04 | 92.17 | 49.76 | −30.78 | 3 | 3 | NA |
| tox21-ap1-agonist-p1_ap1-agonist_1 | β-lactamase reporter qHTS assay in AP-1-bla ME-180 cells for identifying small molecule agonists of the activator protein-1 (AP-1) signaling pathway | ap1-agonist | miscellaneous stress | 1E−03 | 76.63 | 51.11 | 32.86 | 3 | 3 | 1159526; 1159528 (summary) |
| tox21-h2ax-cho-p2_viability_1 | qHTS CellTiter-Glo Cell Viability Assay in CHO-K1 cells is a measure of cell viability based on luminescence | viability | counter screen (cell viability) | 1E−03 | 153.85 | 54.40 | −25.80 | 3 | 3 | 1224847 |
| tox21-ar-mda-kb2-luc-agonist-p1_ar-agonist_1 | Luciferase reporter qHTS assay in MDA-kb2 cells to identify small molecule agonists of the AR signaling pathway | ar-agonist | sex hormone homeostasis | 6E−04 | 92.17 | 57.12 | 15.30 | 3 | 3 | 743040 |
| tox21-ar-bla-antagonist-p1_viability_1 | qHTS CellTiter-Glo Cell Viability Assay in AR-bla HEK293 cells is a measure of cell viability based on luminescence | viability | counter screen (cell viability) | 1E−03 | 76.63 | 60.83 | −21.68 | 3 | 3 | 743033 |
| tox21-rar-viability-p2_viability_1 | qHTS CellTiter-Glo Cell Viability Assay in C3RL4 cells is a measure of cell viability based on luminescence | viability | counter screen (cell viability) | 6E−04 | 92.17 | 63.40 | −12.31 | 3 | 3 | 1159551 |
| tox21-sbe-bla-antagonist-p1_viability_1 | qHTS CellTiter-Glo Cell Viability Assay in SBE-bla HEK 293T cells is a measure of cell viability based on luminescence | viability | counter screen (cell viability) | 1E−03 | 76.63 | 64.61 | −25.31 | 3 | 3 | 1346824 |
| tox21-are-bla-p1_nrf2-agonist_1 | β-lactamase reporter qHTS assay to identify small molecule agonists of the NRF2/ARE pathway | nrf2-agonist | oxidative stress | 1E−03 | 92.17 | 72.33 | 37.34 | 3 | 3 | 743202; 743219 (summary) |
| tox21-cre-antagonist-p1_viability_1 | qHTS CellTiter-Glo Cell Viability Assay in HEK293T cells is a measure of cell viability based on luminescence | viability | counter screen (cell viability) | 1E−03 | 92.17 | 73.82 | −20.66 | 3 | 3 | NA |
| tox21-shh-3t3-gli3-agonist-p1_viability_1 | qHTS CellTiter-Fluor assay in 3T3 Gli1-Luc cells is a measure of cell viability based on fluorescence | viability | counter screen (cell viability) | 1E−03 | 92.17 | 74.42 | −20.33 | 3 | 3 | 1259366 |
Table E-2. Summary of Octrizole Activity Data in Tox21 Quantitative High-throughput Screening Assays
| Endpoint | Endpoint Definition | Target | Target Group | Lowest Tested Concentration (µM) | Highest Tested Concentration (µM) | POD (µM) | Emax (%) | # of Activity Calls of Substances | # of Activity Calls without Artifact Flags | PubChem AID |
|---|---|---|---|---|---|---|---|---|---|---|
| tox21-p450-2c9-p1_2c9-inhibitor_1 | Luciferase reporter qHTS assay for small molecule antagonists of Cytochrome P450 Family 2 Subfamily C Member 9 (CYP2C9) | 2c9-inhibitor | xenobiotic homeostasis | 0.00147 | 116.28 | 7.09 | −82.33 | 2 | 2 | 1671198 |
| tox21-mitotox-p1_mmp-inhibitor_1 | qHTS assay in HepG2 cells for small molecule disruptors of the mitochondrial membrane potential (MMP) | mmp-inhibitor | mitochondrial membrane permeability | 0.00119 | 93.24 | 11.84 | −68.72 | 3 | 2 | 720635; 720637 (summary) |
| tox21-p450-2c19-p1_2c19-inhibitor_1 | Luciferase reporter qHTS assay for small molecule antagonists of CYP2C19 | 2c19-inhibitor | xenobiotic homeostasis | 0.00147 | 116.28 | 15.10 | −81.40 | 2 | 2 | 1671197 |
| tox21-tshr-agonist-p1_tshr-agonist_1 | qHTS assay in HEK293 cells to identify small molecule agonists of the thyroid stimulating hormone receptor (TSHR) signaling pathway | tshr-agonist | thyroid homeostasis | 0.00118 | 93.24 | 15.86 | 54.48 | 2 | 2 | 1224843; 1224895 (summary) |
| tox21-herg-u2os-p1_herg-blocker_1 | qHTS assay in hERG-U2OS cells to identify small molecule antagonists of the human Ether-a-go-go-Related Gene (hERG) | herg-blocker | cardiac action potential mediation | 0.00098 | 77.52 | 18.33 | −27.54 | 2 | 2 | 1671200 |
| tox21-pxr-p1_pxr-agonist_1 | qHTS assay in PXR-Luc HepG2 cells to identify small molecule agonists of the human pregnane X receptor (PXR) | pxr-agonist | xenobiotic homeostasis | 0.00118 | 93.24 | 20.23 | 76.37 | 2 | 2 | 1346982; 1347033 (summary) |
| tox21-p450-1a2-p1_1a2-inhibitor_1 | Luciferase reporter qHTS assay for small molecule antagonists of CYP1A2 | 1a2-inhibitor | xenobiotic homeostasis | 0.00147 | 116.28 | 20.39 | −51.34 | 2 | 2 | 1671199 |
| tox21-car-agonist-p1_car-agonist_1 | qHTS assay in a double-stable (hCAR and CYP2B6-2.2kb) transfected cell line derived from HepG2 cells to identify small molecule agonists of the constitutive androstane receptor (CAR) signaling pathway | car-agonist | xenobiotic homeostasis | 0.00118 | 93.24 | 21.65 | 32.20 | 2 | 2 | 1224839; 1224892 (summary) |
| tox21-gh3-tre-antagonist-p1_viability_1 | qHTS CellTiter-Fluor assay in GH3.TRE-Luc cells is a measure of cell viability based on fluorescence | viability | counter screen (cell viability) | 0.00059 | 93.24 | 22.16 | −74.22 | 3 | 3 | 743064 |
| tox21-rxr-bla-agonist-p1_viability_1 | qHTS CellTiter-Glo Cell Viability Assay in RXR-α HEK 293T cells is a measure of cell viability based on luminescence | viability | counter screen (cell viability) | 0.00098 | 77.52 | 22.95 | −55.06 | 2 | 2 | 1159529 |
| tox21-p53-bla-p5_viability_1 | qHTS CellTiter-Glo Cell Viability Assay in p53 RE-bla HCT-116 cells is a measure of cell viability based on luminescence | viability | counter screen (cell viability) | 0.00059 | 93.24 | 29.68 | −24.62 | 3 | 3 | NA |
| tox21-ppard-bla-agonist-p1_viability_1 | qHTS CellTiter-Glo Cell Viability Assay in PPARd-bla HEK293H cells is a measure of cell viability based on luminescence | viability | counter screen (cell viability) | 0.00098 | 77.52 | 30.62 | −51.89 | 2 | 2 | 743211 |
| tox21-p53-bla-p1_viability_1 | qHTS CellTiter-Glo Cell Viability Assay in p53 RE-bla HCT-116 cells is a measure of cell viability based on luminescence | viability | counter screen (cell viability) | 0.00059 | 93.24 | 31.64 | −43.12 | 3 | 3 | 651633 |
| tox21-p53-bla-p3_viability_1 | qHTS CellTiter-Glo Cell Viability Assay is a measure of cell viability based on luminescence | viability | counter screen (cell viability) | 0.00059 | 93.24 | 33.50 | −36.00 | 3 | 3 | NA |
| tox21-p53-bla-p2_viability_1 | qHTS CellTiter-Glo Cell Viability Assay is a measure of cell viability based on luminescence | viability | counter screen (cell viability) | 0.00118 | 93.24 | 35.12 | −30.26 | 3 | 3 | NA |
| tox21-rt-viability-hek293-p1_viability@glo_16h_1 | qHTS RealTime-Glo MT Cell Viability Assay in HEK293 cells is a luciferase-based measure of cell viability based on luminescence at 16 hours | viability@glo_16h | cytotoxicity | 0.00098 | 77.52 | 36.43 | −43.04 | 2 | 2 | 1224872 |
| tox21-rt-viability-hek293-p1_viability@glo_1 | qHTS RealTime-Glo MT Cell Viability Assay in HEK293 cells is a luciferase-based measure of cell viability based on luminescence over time; timepoints assayed were 0, 8, 16, 24, 32, and 40 hours | viability@glo | cytotoxicity | 0.00098 | 77.52 | 36.43 | −44.38 | 2 | 2 | NA |
| tox21-ks-are-p1_viability_1 | qHTS Cell Viability Assay in human keratinocytes is a measure of cell viability based on fluorescence | viability | counter screen (cell viability) | 0.00118 | 93.24 | 36.61 | −63.03 | 2 | 2 | 1919968 |
| tox21-rt-viability-hek293-p1_viability@glo_24h_1 | qHTS RealTime-Glo MT Cell Viability Assay in HEK293 cells is a luciferase-based measure of cell viability based on luminescence at 24 hours | viability@glo_24h | cytotoxicity | 0.00098 | 77.52 | 38.24 | −41.49 | 2 | 2 | 1224886 |
| tox21-gr-hela-bla-antagonist-p1_viability_1 | qHTS CellTiter-Glo Cell Viability Assay in GR-bla HeLa cells is a measure of cell viability based on luminescence | viability | counter screen (cell viability) | 0.00049 | 77.52 | 40.49 | −37.06 | 3 | 3 | 720693 |
| tox21-rt-viability-hek293-p1_viability@glo_8h_1 | qHTS RealTime-Glo MT Cell Viability Assay in HEK293 cells is a luciferase-based measure of cell viability based on luminescence at 8 hours | viability@glo_8h | cytotoxicity | 0.00098 | 77.52 | 40.77 | −33.58 | 2 | 2 | 1224887 |
| tox21-rt-viability-hek293-p1_viability@glo_32h_1 | qHTS RealTime-Glo MT Cell Viability Assay in HEK293 cells is a luciferase-based measure of cell viability based on luminescence at 32 hours | viability@glo_32h | cytotoxicity | 0.00098 | 77.52 | 42.21 | −39.65 | 2 | 2 | 1224868 |
| tox21-fxr-bla-agonist-p2_viability_1 | qHTS CellTiter-Glo Cell Viability Assay in FXR-bla HEK 293T cells is a measure of cell viability based on luminescence | viability | counter screen (cell viability) | 0.00098 | 77.52 | 42.38 | −78.33 | 2 | 2 | 743218 |
| tox21-mitotox-p1_viability_1 | qHTS CellTiter-Glo Cell Viability Assay in HepG2 cells is a measure of cell viability based on luminescence | viability | counter screen (cell viability) | 0.00059 | 93.24 | 44.75 | −19.45 | 3 | 3 | 720634 |
| tox21-pparg-bla-antagonist-p1_viability_1 | qHTS CellTiter-Glo Cell Viability Assay in PPARg-bla HEK293H cells is a measure of cell viability based on luminescence | viability | counter screen (cell viability) | 0.00098 | 77.52 | 45.27 | −59.92 | 2 | 2 | 743194 |
| tox21-er-bla-antagonist-p1_viability_1 | qHTS CellTiter-Glo Cell Viability Assay in ERα-bla cells is a measure of cell viability based on luminescence | viability | counter screen (cell viability) | 0.00049 | 77.52 | 46.67 | −25.82 | 3 | 3 | 743074 |
| tox21-sbe-bla-agonist-p1_viability_1 | qHTS CellTiter-Glo Cell Viability Assay in SBE-bla HEK 293T cells is a measure of cell viability based on luminescence | viability | counter screen (cell viability) | 0.00098 | 77.52 | 46.70 | −44.14 | 2 | 2 | 1346829 |
| tox21-pr-bla-agonist-p1_viability_1 | qHTS CellTiter-Glo Cell Viability Assay PR-UAS-bla HEK293T cells is a measure of cell viability based on luminescence | viability | counter screen (cell viability) | 0.00118 | 93.24 | 48.94 | −63.75 | 2 | 2 | 1346799 |
| tox21-cre-agonist-p1_viability_1 | qHTS CellTiter-Glo Cell Viability Assay in HEK293T cells is a measure of cell viability based on luminescence | viability | counter screen (cell viability) | 0.00118 | 93.24 | 50.36 | −23.71 | 2 | 2 | NA |
| tox21-err-p1_err-antagonist_1 | qHTS assay in ERR cells to identify small molecule antagonists of the Estrogen-Related Receptor (ERR) signaling pathway | err-antagonist | energy homeostasis | 0.00118 | 93.24 | 56.27 | −50.69 | 2 | 2 | 1259403 |
| tox21-er-luc-bg1-4e2-antagonist-p1_er-antagonist_1 | Luciferase reporter qHTS assay in BG1 cell line for small molecule antagonists of the estrogen receptor alpha (ERα) signaling pathway | er-antagonist | sex hormone homeostasis | 0.00118 | 93.24 | 56.30 | −52.74 | 3 | 3 | 743091 |
| tox21-pr-bla-antagonist-p1_viability_1 | qHTS CellTiter-Glo Cell Viability Assay in PR-UAS-bla HEK 293T cells is a measure of cell viability based on luminescence | viability | counter screen (cell viability) | 0.00118 | 93.24 | 56.53 | −56.77 | 2 | 2 | 1346798 |
| tox21-erb-bla-antagonist-p1_viability_1 | qHTS CellTiter-Glo Cell Viability Assay in ERB-beta-UAS-bla HEK 293T cells is a measure of cell viability based on luminescence | viability | counter screen (cell viability) | 0.00118 | 93.24 | 57.13 | −39.02 | 2 | 2 | 1259382 |
| tox21-are-bla-p1_nrf2-agonist_1 | β-lactamase reporter qHTS assay to identify small molecule agonists of the nuclear factor erythroid 2-related factor 2/antioxidant response element (NRF2/ARE) pathway | nrf2-agonist | oxidative stress | 0.00118 | 93.24 | 71.50 | 37.84 | 2 | 2 | 743202; 743219 (summary) |
| tox21-h2ax-cho-p2_viability_1 | qHTS CellTiter-Glo Cell Viability Assay in CHO-K1 cells is a measure of cell viability based on luminescence | viability | counter screen (cell viability) | 0.00197 | 155.63 | 72.79 | −46.04 | 2 | 2 | 1224847; 1224896 (summary) |
| tox21-h2ax-cho-p2_gh2ax-inducer_1 | qHTS assay to identify small molecule agonists of histone variant H2A histone family member X (H2AX) in CHO-K1 cells | gh2ax-inducer | genotoxic stress | 0.00197 | 155.63 | 82.02 | 49.72 | 2 | 2 | 1224845; 1224896 (summary) |
E.3.2. Activity of Drometrizole Compared with Reference Chemicals
The effects of drometrizole on HDAC inhibition, PGC-ERR or ERR activation, RAR activation, CAR activation, and AhR activation were compared with known reference chemicals.134 These six activities were examined because drometrizole demonstrated high potency (i.e., POD < 10 µM), the effect of drometrizole ranked within the top 20% of active chemicals, and reference chemicals were available for comparison. The reference chemicals selected included those with the highest number of available supporting reports and were also active in the related Tox21 assays. The effects of the reference chemicals were compared to that of drometrizole, in relation to all the other active chemicals in the related Tox21 screens using the wAUC activity metric. The effect of drometrizole was ranked within the top 6.41% of active chemicals for HDAC inhibition, 7.28% for CAR activation, 7.65% for RAR activation, and 8.32% for AhR activation (Figure E-2, Figure E-3). The effect of drometrizole was ranked within the top 13.72% and 18.34% for activation of the ERR signaling pathway with and without the presence of the PPARγ coactivator (i.e., PGC-ERR and ERR activation, respectively; Figure E-4).
134. Judson RS, Thomas RS, Baker N, Simha A, Howey XM, Marable C, Kleinstreuer NC, Houck KA. Workflow for defining reference chemicals for assessing performance of in vitro assays. ALTEX. 2019; 36(2):261-276. DOI: 10.14573/altex.1809281 PubMed: 30570668
Except for RAR activation, the effect of drometrizole was either stronger or comparable to that of the reference chemicals. For example, the effects of methoxychlor and bisphenol A are within the top 0.2% and 5%, respectively, for CAR activation versus drometrizole at 7.28%.
E.3.3. Activity of Octrizole Compared with Active Chemicals
While CYP2C9 inhibition was highly potent for octrizole (POD = 7.09 µM), the effect of octrizole on CYP2C9 inhibition did not rank within the top 20% of active chemicals, and there were no reference chemicals for comparison.
E.4. Summary
In summary, the in vitro data suggest that the monosubstituted phenolic benzotriazole drometrizole induced activity related to activation of the ERR and the ERα signaling pathways for energy and sex hormone homeostasis, respectively, and that drometrizole is a strong inhibitor of HDAC. In addition, when a reference chemical comparison was conducted, drometrizole was shown to be in the top 20% of active chemicals for HDAC, CAR, RAR, AhR, and the ERR signaling pathway with and without the presence of the PPARγ coactivator. For all activities except RAR, the effect of drometrizole was either stronger or comparable to that of the reference chemicals; for RAR, drometrizole activation was weaker than the reference chemicals (i.e., all-trans-retinoic acid, tazarotene, and AM580).
Figure E-2. Comparison of Drometrizole Potency to Assay Reference Chemicals for HDAC Inhibition and CAR Activation in Tox21
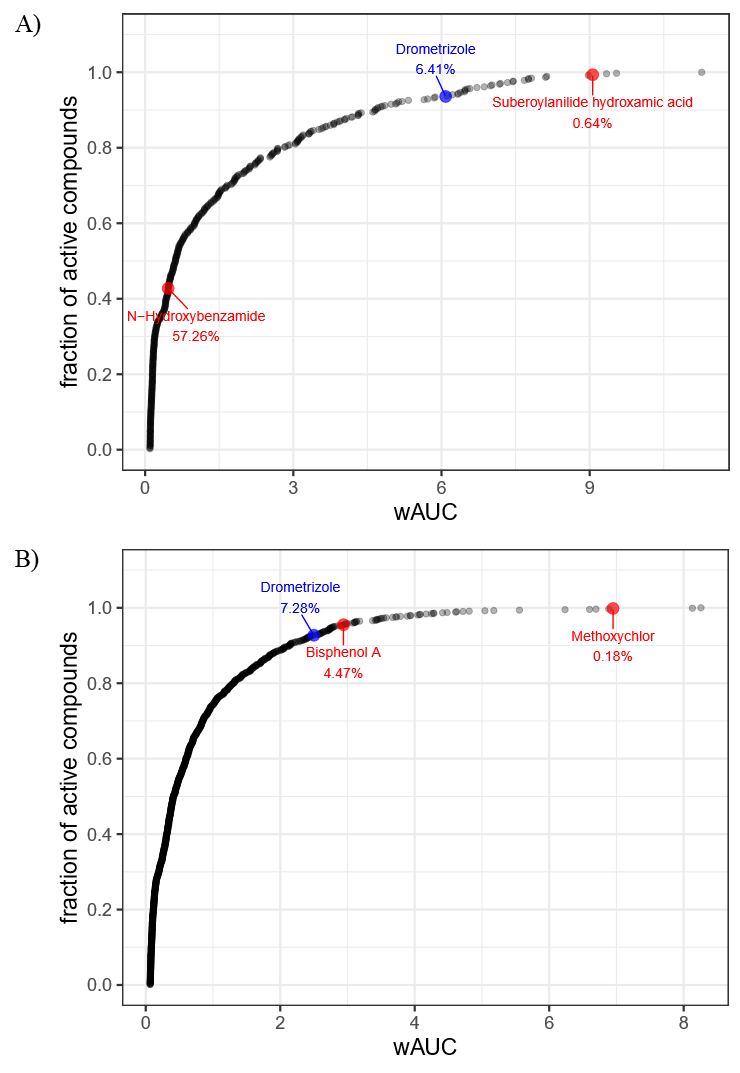
A) Histone deacetylase (HDAC) inhibition and B) constitutive androstane receptor (CAR) activation in Tox21 assays (gray dots) are plotted based on weighted area under the curve (wAUC) values. Each individual gray dot represents all active chemicals in the related Tox21 screens, organized by wAUC values. Reference chemicals are labeled in red text. The percentage next to the chemical represents the ranking of the activity (using wAUC) in relation to all of the active chemicals. The number of active chemicals for HDAC inhibition and CAR activation was 468 of 7,871 tested chemicals (quality control [QC] passed) and 1,140 of 7,871 tested chemicals (QC passed), respectively. Drometrizole activity (blue dot) versus n-hydroxybenzamide and suberoylanilide hydroxamic acid activity (HDAC reference chemicals) (red dots) is highlighted in panel A. Drometrizole activity (blue dot) versus bisphenol A and methoxychlor activity (CAR reference chemicals) (red dots) is highlighted in panel B.
Drometrizole = 2-(2H-benzotriazol-2-yl)-4-methylphenol.
Figure E-3. Comparison of Drometrizole Potency to Assay Reference Chemicals for RAR Activation and AhR Activation in Tox21
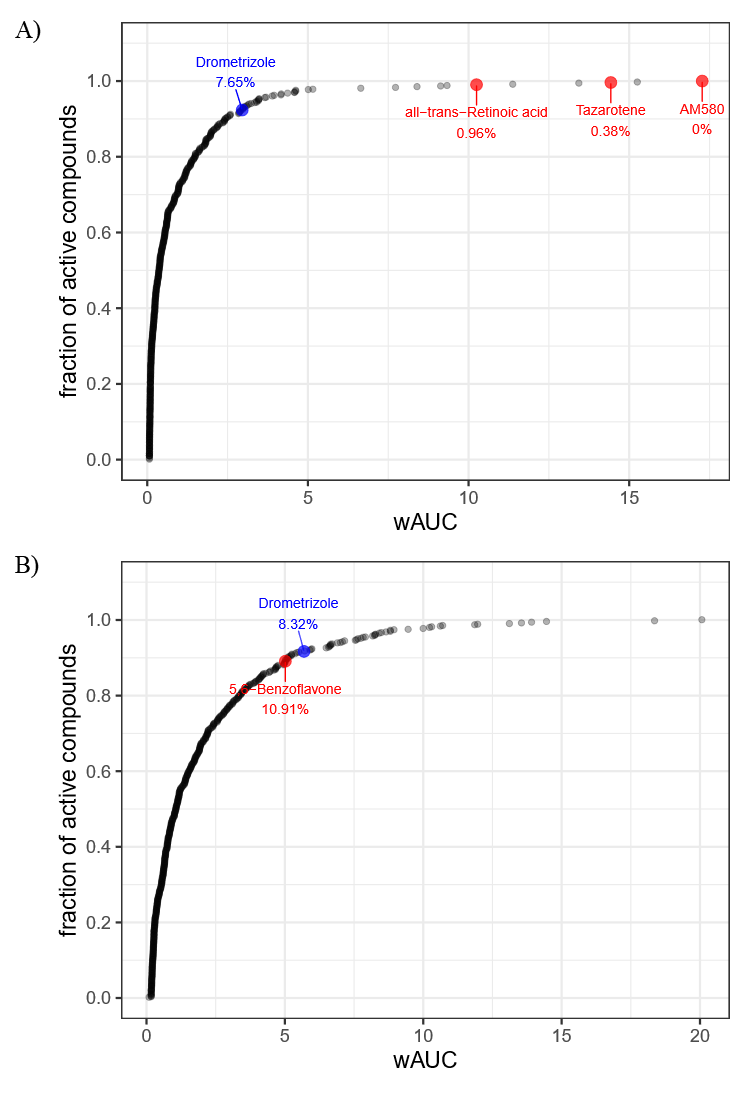
A) Retinoic acid receptor (RAR) activation and B) aryl hydrocarbon receptor (AhR) activation in Tox21 assays (gray dots) are plotted based on weighted area under the curve (wAUC) values. Each individual gray dot represents all active chemicals in the related Tox21 screens, organized by wAUC values. Reference chemicals are labeled in red text. The percentage next to the chemical represents the ranking of the activity (using wAUC) in relation to all of the active chemicals. The number of active chemicals for RAR activation and AhR activation was 523 of 7,521 tested chemicals (quality control [QC] passed) and 541 of 8,305 tested chemicals (QC passed), respectively. Drometrizole activity (blue dot) versus all-trans-retinoic acid, tazarotene, and AM580 activity (RAR reference chemicals) (red dots) is highlighted in panel A. Drometrizole activity (blue dot) versus 5,6-benzoflavone activity (AhR reference chemical) (red dots) is highlighted in panel B.
Drometrizole = 2-(2H-benzotriazol-2-yl)-4-methylphenol.
Figure E-4. Comparison of Drometrizole Potency to Assay Reference Chemicals for ERR Activation and PGC-ERR Activation in Tox21
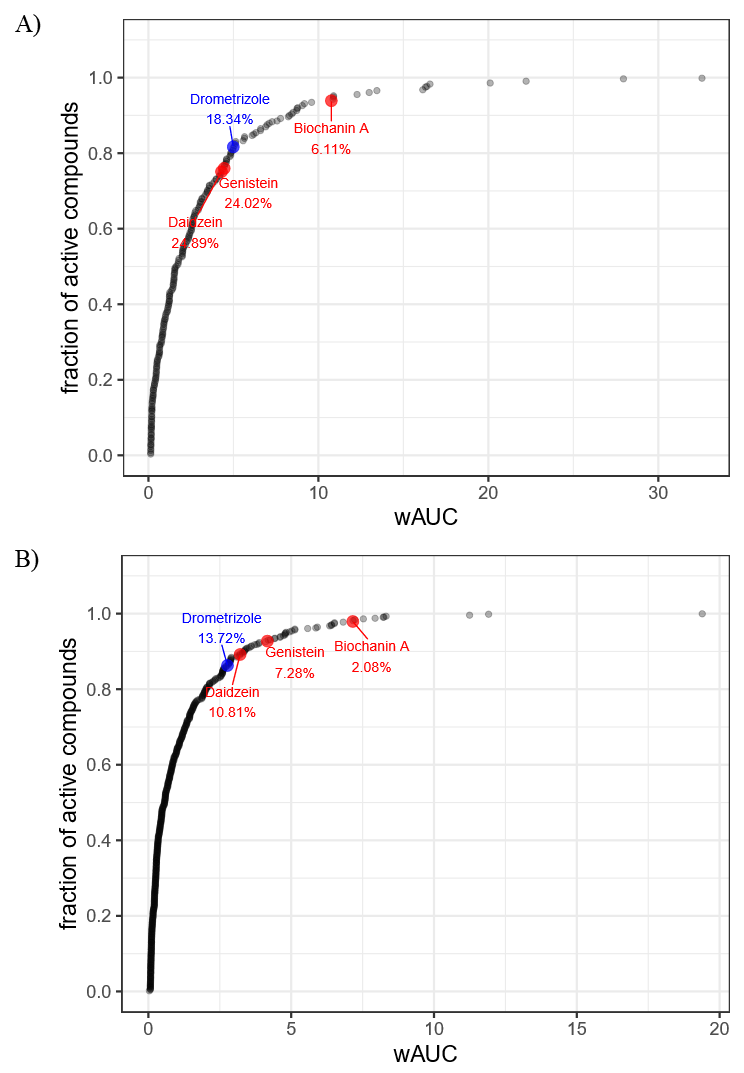
A) Estrogen-related receptor (ERR) activation and B) ERR activation with the presence of PPARγ coactivator (PGC-ERR) in Tox21 assays (gray dots) are plotted based on weighted area under the curve (wAUC) values. Each individual gray dot represents all active chemicals in the related Tox21 screens, organized by wAUC values. Reference chemicals are labeled in red text. The percentage next to the chemical represents the ranking of the activity (using wAUC) in relation to all of the active chemicals. The number of active chemicals for ERR activation and PGC-ERR activation was 229 of 7,871 tested chemicals (quality control [QC] passed) and 481 of 7,871 tested chemicals (QC passed), respectively. Drometrizole activity (blue dot) versus daidzein, genistein, and biochanin A activity (ERR and PGC-ERR reference chemicals) (red dots) is highlighted in both subpanels.
Drometrizole = 2-(2H-benzotriazol-2-yl)-4-methylphenol.
Appendix F. Supplemental Data
Tables with supplemental data can be found here: https://doi.org/10.22427/NTP-DATA-TOX-108.
About This Report
Foreword
The National Toxicology Program (NTP), established in 1978, is an interagency program within the Public Health Service of the U.S. Department of Health and Human Services. Its activities are executed through a partnership of the National Institute for Occupational Safety and Health (NIOSH, part of the Centers for Disease Control and Prevention), the Food and Drug Administration (FDA, primarily at the National Center for Toxicological Research), and the National Institute of Environmental Health Sciences (NIEHS, part of the National Institutes of Health), where the program is administratively located. NTP offers a unique venue for the testing, research, and analysis of agents of concern to identify toxic and biological effects, provide information that strengthens the science base, and inform decisions by health regulatory and research agencies to safeguard public health. NTP also works to develop and apply new and improved methods and approaches that advance toxicology and better assess health effects from environmental exposures.
The Toxicity Report series began in 1991. The studies described in the NTP Toxicity Report series are designed and conducted to characterize and evaluate the toxicological potential of selected substances in laboratory animals (usually two species, rats and mice). Substances (e.g., chemicals, physical agents, and mixtures) selected for NTP toxicity studies are chosen primarily on the basis of human exposure, level of commercial production, and chemical structure. The interpretive conclusions presented in the Toxicity Reports are derived solely from the results of these NTP studies and should not be misconstrued to represent an official policy of the individual agencies that participate in the NTP partnership (NIEHS, NIOSH, or FDA). Extrapolation of these results to other species, including characterization of hazards and risks to humans, requires analyses beyond the intent of these reports. Selection for study per se is not an indicator of a substance’s toxic potential.
NTP studies are conducted in compliance with its laboratory health and safety guidelines and FDA Good Laboratory Practice Regulations and meets or exceeds all applicable federal, state, and local health and safety regulations. Animal care and use are in accordance with the Public Health Service Policy on Humane Care and Use of Laboratory Animals. Studies are subjected to retrospective quality assurance audits before they are presented for public review. Draft reports undergo external peer review before they are finalized and published.
NTP Toxicity Reports are available free of charge on the NTP website and cataloged in PubMed, a free resource developed and maintained by the National Library of Medicine (part of the National Institutes of Health). Data for these studies are included in NTP’s Chemical Effects in Biological Systems database.
For questions about the reports and studies, please email NTP or call 984-287-3211.
Collaborators and Contributors
Collaborators
Division of Translational Toxicology, National Institute of Environmental Health Sciences, Research Triangle Park, North Carolina, USA
Rebecca J. Arechavala, Ph.D., Co-Lead Toxicologist (currently at U.S. Food and Drug Administration)9,10
Rachel A. Dee, Ph.D., Co-Lead Toxicologist (currently at Corteva Agriscience)9,10
Chad R. Blystone, Ph.D.1,9,10
Michelle C. Cora, D.V.M.1,2,10
Michelle J. Hooth, Ph.D.1,10
Jui-Hua Hsieh, Ph.D.2,9,10
Georgia K. Roberts, Ph.D.5,10
Kelly A. Shipkowski, Ph.D.5,10
Keith R. Shockley, Ph.D.2,5,10
Stephanie L. Smith-Roe, Ph.D.5,10
Greg S. Travlos, D.V.M. (Retired)9,10
Suramya Waidyanatha, Ph.D.5,10
Experimental Pathology Laboratories, Inc., Research Triangle Park, North Carolina, USA
Contract HHSN273201500014C
Karen Y. Cimon, D.V.M., M.S., Lead Pathologist3,9,10
Social & Scientific Systems, a DLH Holdings Corp Company, Research Triangle Park, North Carolina, USA
Contracts GS-00F-173CA/75N96022F00055 and HHSN273201600011C
Guanhua Xie, Ph.D.2,10
ICF, Reston, Virginia, USA
Contracts 75N96025C00003 and GS00Q14OADU417 (Order No. HHSN273201600015U)
Jeanne Luh, Ph.D.9,10
Contributors
Division of Translational Toxicology, National Institute of Environmental Health Sciences, Research Triangle Park, North Carolina, USA
Danica Andrews, B.S.5
Scott S. Auerbach, Ph.D.1
Milene L. Brownlow, Ph.D. (currently at NIH Center for Scientific Review)12
Mark F. Cesta, D.V.M., Ph.D.3,5
Helen C. Cunny, Ph.D.1,5
Jennifer M. Fostel, Ph.D.5
Ronald A. Herbert, Ph.D.5
Angela P. King-Herbert, D.V.M.9
Y. Frances Liu, Ph.D.2,5
Scott A. Masten, Ph.D.1
Esra Mutlu, Ph.D. (currently at U.S. Environmental Protection Agency)5
Jason P. Stanko, Ph.D.5
Matthew D. Stout, Ph.D.5
Nigel J. Walker, Ph.D.10
Mary S. Wolfe, Ph.D. (Retired)12
National Center for Toxicological Research, U.S. Food and Drug Administration, Jefferson, Arkansas, USA
Paul C. Howard, Ph.D. (Retired)1
Battelle, Columbus, Ohio, USA
Contract HHSN273201400015C
Milton R. Hejtmancik, Ph.D., Principal Investigator5,6
Barney R. Sparrow, Ph.D., Principal Investigator5,6
Sam J. Harbo, D.V.M.3
Vijaykumar Kale, Ph.D.3
Anthony J. Skowronek, D.V.M., Ph.D.3
Contract HHSN273201400027C
Brian L. Burback, Ph.D., Principal Investigator5.6
Kevin A. Carrico, B.A.3
Timothy A. Cristy, B.A.3
Elizabeth A. O’Dea, B.S.3
Jessica Pierfelice, B.S.3
Billie Stiffler, Ph.D.3
Instem, Staffordshire, United Kingdom
Contract HHSN273201300004C
Mark Handley, Computing H.N.C., Program Manager2,5,6
Pam Reese, B.S.2
Martin Tyszka, M.S.2
Integrated Laboratory Systems, LLC, an Inotiv Company, Research Triangle Park, North Carolina, USA
Contract HHSN273201500013C
Georgette D. Hill, D.V.M., Ph.D.3
Kristen R. Hobbie, D.V.M., Ph.D.3
Contract HHSN273201300009C
Leslie Recio, Ph.D., Principal Investigator5,6
Cheryl A. Hobbs, Ph.D.3
Pathology Working Group on Two-week Studies (December 1, 2022), National Institute of Environmental Health Sciences, Research Triangle Park, North Carolina, USA
Mark F. Cesta, D.V.M., Ph.D., National Institute of Environmental Health Sciences3
Arun R. Pandiri, B.V.Sc. & A.H., Ph.D., National Institute of Environmental Health Sciences3
Contract HHSN273201500014C
Karen Y. Cimon, D.V.M., M.S.3, Experimental Pathology Laboratories, Inc.3
Rich A. Miller, D.V.M., Ph.D., Consultant3
John C. Seely, D.V.M., Experimental Pathology Laboratories, Inc.3
Contract HHSN273201500013C
Kristen R. Hobbie, D.V.M., Ph.D., Integrated Laboratory Systems, LLC, an Inotiv Company3
Cynthia J. Willson, D.V.M., Ph.D., Integrated Laboratory Systems, LLC, an Inotiv Company3
Experimental Pathology Laboratories, Inc., Research Triangle Park, North Carolina, USA
Contract HHSN273201800006C
Emily Singletary, B.S., Manager3,5,6
Michael J. Carden3
Leslie C. Couch, B.S.3
Lorri N. Ezedin, B.S.3
Jami L. Heller, B.S.3
Contract HHSN273201500014C
Amy E. Brix, D.V.M., Ph.D.1
ASRC Federal Data Solutions, Beltsville, Maryland, USA
Contracts 75N96023A00001 and HHSN316201200054W
Julie Berke, B.S.2
Phyllis Brown, B.S.2
Erik Diffin, B.S.2
Karen S. Gilbert, B.S.2
Marcus A. Jackson, B.S.2
Cristina Myers, M.S.2
Tony Silver, B.S.2
CSS Incorporated, Research Triangle Park, North Carolina, USA
Contract HHSN273201500006C
Steven Brecher, Ph.D., Principal Investigator5,6,11
Holly Dimig, B.S.11
Sudha Iyer, B.S.11
Varghese S. Tharakan, D.V.M.11
Social & Scientific Systems, a DLH Holdings Corp Company, Research Triangle Park, North Carolina, USA
Contracts GS-00F-173CA/75N96022F00055 and HHSN273201600011C
Katherine N. Allen, Ph.D., Principal Investigator5,6
Laura J. Betz, M.S.2
Gary Larson, Ph.D.2
Shawn F. Harris, M.S 2
ICF, Reston, Virginia, USA
Contracts 75N96025C00003 and GS00Q14OADU417 (Order No. HHSN273201600015U)
David Burch, M.E.M., Principal Investigator5,6
Katherine S. Duke, Ph.D.10
Julia S. Finver, B.S.12
Sagi A. Gillera, Ph.D.10
Samantha M. Hall, Ph.D.10
Cary E. Haver, M.P.H.5
Leah Hennelly, B.S.12
Kristen L. McKinley, M.E.M.10
Kevin T. O’Donovan, B.A.10
Jennifer I. Powers, M.A.P.10
Lisa M. Prince, Ph.D.10
Courtney D. Rosenthal, M.S.10
Swati Sriram, M.P.H.10
J. Wren Tracy, M.H.S.10
Nkoli Ukpabi, M.S.10
Janielle S. Vidal, Ph.D.10
Jessica A. Wignall, M.S.P.H.5,6
Collaborator and Contributor Roles and Definitionsa
| No. | Role | Definition |
|---|---|---|
| 1 | Conceptualization | Ideas; formulation or evolution of overarching research goals and aims |
| 2 | Data curation, formal analysis, and software | Management activities to annotate (produce metadata), scrub, and maintain research data (including software code, when it is necessary for interpreting the data) for initial use and later reuse or Application of statistical, mathematical, computational, or other formal techniques to analyze or synthesize study data or Programming and software development; design of computer programs; implementation of computer code and supporting algorithms; testing of existing code components |
| 3 | Investigation | Conduct of the research/investigation process, specifically the performance of experiments or the collection of data/evidence |
| 4 | Methodology | Development or design of methodology; creation of models |
| 5 | Project administration | Management and coordination responsibility for research planning and execution |
| 6 | Resources for study conduct | Provision of study materials, reagents, patients, laboratory samples, animals, instrumentation, computing resources, or other analysis tools |
| 7 | Validation | Verification, whether as a part of the activity or separately, of the overall replication/reproducibility of results/experiments and other research outputs |
| 8 | Visualization | Preparation, creation, and/or presentation of the published work, specifically visualization/data presentation |
| 9 | Writing: original | Preparation, creation, and/or presentation of the published work, specifically the writing of the initial draft (including substantive translation) |
| 10 | Writing: review and editing | Preparation, creation, and/or presentation of the published work by those from the original research group, specifically provision of substantive critical review, commentary, or revision—including pre- or post-publication stages |
| 11 | Quality assessment | Conduct of independent assessments of accuracy, consistency, and completeness of various aspects of research products and their components, including data; identification of areas in the conduct and documentation of studies that merit correction or improvement of the description of methodologies |
| 12 | Peer review and production | Coordination and management of external peer review and publication, including identification of experts, conflict-of-interest screening, correspondence with reviewers, preparation of review documents, and publication activities |
Peer Review
The National Toxicology Program (NTP) conducted a peer review of the draft NTP Technical Report on the Toxicity Studies of Select Phenolic Benzotriazoles Administered by Gavage to Male Sprague Dawley (Hsd:Sprague Dawley SD) Rats by letter in February 2025 by the experts listed below. Reviewer selection and document review followed established NTP practices. The reviewers were charged to:
Peer review the draft NTP Technical Report on the Toxicity Studies of Select Phenolic Benzotriazoles Administered by Gavage to Male Sprague Dawley (Hsd:Sprague Dawley SD) Rats.
Comment on NTP’s interpretations of the data.
NTP carefully considered reviewer comments in finalizing this report.
Peer Reviewers
Nadia Moore, Ph.D., DABT
Technical Fellow – Toxicology
J.S. Held, LLC
Redmond, Washington, USA
Clifford Steer, M.D.
Professor, Departments of Medicine and Genetics, Cell Biology, and Development
Director, Molecular Gastroenterology Program
University of Minnesota
Minneapolis, Minnesota, USA
Publication Details
Publisher: National Toxicology Program
Publishing Location: Research Triangle Park, NC
ISSN: 2378-8992
DOI: https://doi.org/10.22427/NTP-TOX-108
Report Series: NTP Toxicity Report Series
Report Series Number: 108
Official citation: National Toxicology Program (NTP). 2026. NTP technical report on the toxicity studies of select phenolic benzotriazoles administered by gavage to male Sprague Dawley (Hsd:Sprague Dawley SD) rats. Research Triangle Park, NC: National Toxicology Program. Toxicity Report 108.
Acknowledgments
This work was supported by the Intramural Research Program (ES103376, ES103377, ES103379, and ES103380) at the National Institute of Environmental Health Sciences, National Institutes of Health and performed for the National Toxicology Program, Public Health Service, U.S. Department of Health and Human Services under contracts 75N96025C00003, 75N96023A00001, GS-00F-173CA/75N96022F00055, HHSN273201800006C, HHSN273201600011C, GS00Q14OADU417 (Order No. HHSN273201600015U), HHSN273201500006C, HHSN273201500014C, HHSN273201500013C, HHSN273201400015C, HHSN273201400027C, HHSN273201300009C, HHSN273201300004C, and HHSN316201200054W.