Note on Accessibility: Persons using mobile devices may find some tables are not fully accessible. Note that you can view tables on a larger screen or in the PDF version of the report/monograph. If you need additional assistance, email us or use our contact form and identify the tables for which access is required. We will assist you in accessing the content. NIH has helpful information on accessibility.
Technical Report 604
NTP Technical Report on the Toxicology and Carcinogenesis Study of Triclosan (CASRN 3380-34-5) Administered Dermally to B6C3F1/N Mice

Abstract
Two-year Study in Mice
Triclosan is a broad-spectrum antimicrobial agent to which humans are widely exposed. Very limited data are available regarding the dermal toxicity and the carcinogenic potential of triclosan. In this study, groups of 48 male and 48 female B6C3F1/N mice were untreated or were dermally administered 0 (vehicle), 1.25, 2.7, 5.8, or 12.5 mg triclosan/kg body weight/day (mg/kg/day) in 95% ethanol, 7 days per week for 2 years. Vehicle control animals received 95% ethanol only; untreated, naive control mice were not dosed. There were no significant differences in survival among the groups. The highest dose of triclosan decreased the body weights of mice in both sexes, but the decrease was ≤8%.
Minimal to mild epidermal hyperplasia (males and females), suppurative inflammation (males only), and ulceration (males only) were observed at the site of application in the dosed groups, with the highest incidence occurring in the 12.5 mg/kg/day groups. In male and female mice, no skin neoplasms were identified at the site of application. In male mice, the two highest dosed groups (5.8 and 12.5 mg/kg/day) had significantly increased incidences of hepatocellular carcinoma, and the incidences occurred with a positive trend relative to the vehicle control group. A positive trend in the incidence of hepatocellular adenoma or carcinoma (combined) was observed in male mice, with significantly increased incidences in the ≥2.7 mg/kg/day group. Female mice had a positive trend in the incidence of pancreatic islet adenoma.
Conclusions
Under the conditions of this 2-year dermal study, there was some evidence of carcinogenic activity of triclosan in male B6C3F1/N mice based on the increased incidences of hepatocellular adenoma or carcinoma (combined). There was equivocal evidence of carcinogenic activity of triclosan in female B6C3F1/N mice based on higher occurrences of pancreatic islet adenomas.
Dermal administration of triclosan resulted in increased incidences of nonneoplastic epidermal lesions at the site of application in male and female mice.
Synonyms: 2,4,4-trichloro-2-hydroxydiphenyl ether, 2,4,4′-trichloro-2′-hydroxydiphenyl ether, trichloro-2′-hydroxydiphenyl ether
Trade names: Irgasan, CH 3565, Irgasan CH 3565, Irgasan DP300, Ster-Zac, Tinosan AM110 Antimicrobial, Invasan DP 300R, Invasan DP 300 TEX, Irgaguard® B 1000, VIV-20, Irgacare MP, Lexol 300, Cloxifenolum, Aquasept, Gamophen, Vinyzene DP 7000, Vinyzene SB-30, Sanitized Brand, Microbanish R, Vikol THP, Ultra-Fresh, Microban Additive “B,” AerisGuard, and Sapoderm
Summary of the Two-year Carcinogenesis Study of Triclosan
| Male B6C3F1/N Mice | Female B6C3F1/N Mice | |
|---|---|---|
| Dermal dose in ethanol | [Untreated control group], 0, 1.25, 2.7, 5.8, or 12.5 mg/kg/day | [Untreated control group], 0, 1.25, 2.7, 5.8, or 12.5 mg/kg/day |
| Survival rates | [31/48], 35/48, 30/48, 34/48, 28/48, 31/48 | [33/48], 35/48, 29/48, 31/48, 37/48, 35/48 |
| Body weights | Dosed groups within 10% of the vehicle control group | Dosed groups within 10% of the vehicle control group |
| Nonneoplastic effects | Skin, site of application: epidermis, hyperplasia ([2/48], 1/48, 3/48, 20/48, 17/48, 43/48); epidermis, inflammation, suppurative ([2/48], 0/48, 3/48, 2/48, 4/48, 9/48); epidermis, ulcer ([2/48], 0/48, 2/48, 1/48, 2/48, 5/48) | Skin, site of application: epidermis, hyperplasia ([1/48], 0/48, 5/48, 7/48, 10/48, 39/48) |
| Neoplastic effects | Liver: hepatocellular adenoma ([26/48], 25/48, 30/48, 34/48, 31/48, 26/48); hepatocellular carcinoma ([27/48], 15/48, 17/48, 20/48, 25/48, 27/48); hepatocellular adenoma or carcinoma (combined) ([41/48], 31/48, 35/48, 40/48, 42/48, 40/48) | None |
| Equivocal findings | None | Pancreas: islets, adenoma ([0/48], 1/48, 0/48, 0/48, 0/48, 3/48) |
| Level of evidence of carcinogenic activity | Some evidence | Equivocal evidence |
Introduction
Chemical and Physical Properties
Triclosan (5-chloro-2-(2,4-dichlorophenoxy)phenol) (Figure 1) is a colorless to off-white crystalline powder with a slightly aromatic odor. It has a melting point of 55°C–57°C. Triclosan is slightly soluble in water (10 mg/L), moderately soluble in base (23.5 g/L in 0.1 N NaOH), and highly soluble (>1,000 g/L) in ethanol, acetone, propylene glycol, TWEEN® 20, benzene, and methyl Cellosolve®.1-3
Production, Use, and Human Exposure
Triclosan is synthesized by reacting 2,4,4'-trichloro-2'-methoxydiphenyl ether with aluminum chloride (AlCl3). In the United States, the annual production of triclosan rose from 0.005–0.2 × 10⁶ kg in 1990 to >0.5–5 × 10⁶ kg in 1998, the last year for which data are available.2 Triclosan is formulated as an antimicrobial active component in consumer care products, such as soaps, deodorants, toothpastes, and mouthwashes; household cleaners; and textiles, such as sportswear, bed clothes, shoes, and carpets. Triclosan preparations are also used to control the spread of methicillin-resistant Staphylococcus aureus in clinical settings and surgical scrubs, preoperative skin preparations, and sutures to prevent bacterial colonization of surgical wounds. Triclosan has been found in drinking water, surface water, wastewater, and environmental sediments, as well as in human breast milk, plasma, and urine.2-4
Biological and Toxicological Properties
Absorption, Distribution, Metabolism, and Excretion
After oral exposure, triclosan is primarily absorbed through the mucosal membranes of the oral cavity and gastrointestinal tract. Dermal contact results in absorption through the skin.2 A dermal toxicokinetic study was conducted in male and female B6C3F1/N mice.5 When using 95% ethanol as the vehicle, mice fitted with Elizabethan collars (to prevent oral ingestion) absorbed approximately 85% of the total dose administered. In mice that did not have Elizabethan collars, an additional 16%–23% was absorbed. At a dose of 10 mg triclosan/kg body weight (mg/kg), the absorption of triclosan was 6% greater in female mice compared to male mice. Likewise, the area under the curve (AUC0-∞) and maximum observed concentration (Cmax) of triclosan in the plasma and liver were greater in females than in males.5 After absorption, triclosan is readily metabolized to glucuronide and sulfate conjugates as well as 2,4-dichlorophenol, hydroxytriclosan, and 4-chlorocatechol.5,6 Triclosan is excreted in the feces and urine. Rats and mice show predominantly biliary excretion into the feces, whereas guinea pigs excrete the majority of the dose via the kidney. In humans, urinary excretion is the major route of elimination.2,3
Carcinogenicity
The carcinogenicity of triclosan has been investigated in male and female CD-1 mice administered 0, 10, 30, 100, or 200 mg/kg/day in the diet for 18 months. Doses ≥30 mg/kg/day resulted in a significant increase in hepatocellular neoplasms in both males and females. Doses ≤10 mg/kg/day did not induce a tumorigenic response. The incidences of hepatocellular adenoma and adenoma or carcinoma (combined) showed a clear dose-response, with the incidences being higher in males than in females.3 A dermal triclosan carcinogenic study was conducted in which 0.5% and 1% triclosan in acetone (approximately equivalent to 20 and 40 mg/kg/application, respectively) was applied to the shaved intrascapular region of Swiss mice three times per week for 18 months.7 Specific details of the study were not provided; however, the authors reported that the findings in the triclosan-exposed mice were similar to those in the control mice and that triclosan was not found to be carcinogenic.
Study Rationale
There is potential for humans to be exposed to triclosan throughout their lifetime due to its extensive use in consumer care products and in clinical settings. Because there is very limited information regarding the dermal toxicity and carcinogenicity of triclosan, the U.S. Food and Drug Administration requested a dermal carcinogenicity study to conduct a safety assessment of triclosan-containing products.
Mice were used in this 2-year dermal carcinogenicity study because a previous oral carcinogenicity study in mice indicated that triclosan induced hepatocellular neoplasms.3 Furthermore, mice are the preferred species for dermal carcinogenicity studies under the U.S. Environmental Protection Agency’s Health Effects Test Guidelines “OPPTS 870.4300 Combined Chronic Toxicity/Carcinogenicity,”8 and, historically, NTP dermal carcinogenicity assessments have been conducted in mice.
Materials and Methods
Procurement and Characterization
Triclosan
Triclosan was obtained from Alfa Aesar (Ward Hill, MA) in a single lot (5001A29X). Identity, purity, and stability analyses were conducted by the study laboratory at the U.S. Food and Drug Administration’s National Center for Toxicological Research (NCTR, Jefferson, AR). Reports on analyses performed in support of the triclosan studies are on file at the National Institute of Environmental Health Sciences.
The identity of the test lot was evaluated using 1H nuclear magnetic resonance (NMR) spectroscopy. The 1H NMR spectrum was consistent with the structure of triclosan and identical to that of the reference standard (lot 1412854V, Sigma Aldrich, St. Louis, MO) (Appendix A). No resonances due to contaminants were present in the spectrum except those produced by water and solvent. The identity of lot 5001A29X was further confirmed using mass spectrometry (MS) after separation by high-performance liquid chromatography (HPLC) with diode array detection (PDA) (Table A-1). The MS spectrum was consistent with the structure of triclosan, which confirmed that the test lot corresponded to triclosan.
Purity evaluation was conducted by HPLC/PDA using a 1.0 mg/mL sample of the test lot dissolved in methanol (Table A-1). No impurities were identified. The overall purity of lot 5001A29X was estimated to be 99.9% by comparing the peak area with the reference standard, which was consistent with the 99.0% purity indicated by the manufacturer. The 1H NMR analysis of the test article was consistent with this purity determination. Repeated purity evaluation conducted at the end of the study confirmed a purity of 99.9%.
The test article was received in amber jars and stored at room temperature.
Ethanol
The 95% ethanol dose vehicle was obtained from Decon Laboratories (King of Prussia, PA) in a single lot (2801G). The identity of ethanol was confirmed using 1H NMR spectroscopy. The NMR spectrum was consistent with the structure of ethanol, and there was no evidence of contamination by other proton-containing compounds (Appendix A).
Purity evaluation of lot 2801G was conducted by the study laboratory using HPLC/PDA (Table A-1). The chromatograms did not show any ultraviolet chromophore-containing components above background, confirming a purity consistent with the 95% purity specified by the vendor. Batches of the ethanol dose vehicle were evaluated for the presence of triclosan before and after the study, and no triclosan was detected.
The ethanol dose vehicle was received in amber glass containers and stored at room temperature.
Preparation and Analysis of Dose Formulations
Dose formulations of triclosan (lot 5001A29X) in 95% ethanol were prepared by Priority One Services (Alexandria, VA) following protocols outlined in Appendix A. Dose formulations were prepared at 1.25, 2.7, 5.8, and 12.5 mg/L (25 preparations; September 2013–August 2015) and were refrigerated, protected from light, and used within approximately 1 month of mixing.
Stability studies of the dose formulations stored at room (25°C) or refrigerated (2°C–8°C) temperatures were conducted using HPLC/PDA (Table A-1). The lowest (1.25 mg/mL) and highest (12.5 mg/mL) dose formulations were evaluated after 8 weeks at refrigerated temperatures or 4 weeks at room temperature. Stability for up to 56 days under refrigerated temperatures was confirmed. Additionally, the dose formulations were found to be homogeneous.
Analyses of preadministration dose formulations were conducted by the study laboratory using HPLC/PDA (Table A-1). All dose formulations were within 10% of the target concentrations.
Analysis of Triclosan in Experimental Background Materials
The animal feed (NTP-2000 Irradiated Rodent Diet) and drinking water (Millipore-filtered drinking water) were analyzed for the presence of background triclosan using ultra-performance liquid chromatography (UPLC) with MS (Table A-1). Animal feed samples were ground to a powder and extracted with acetonitrile. The acetonitrile supernatant was assayed by UPLC-MS and compared with feed samples spiked at 1 ppm triclosan. Although a prominent triclosan peak was observed in the spiked samples, the peak was not detectable in the unspiked samples, indicating that any possible background levels of triclosan in the feed were not present at or above 1 ppm. Additionally, peak areas observed for triclosan in the three drinking water samples were negligible in comparison with water samples spiked at 1 ppm triclosan, indicating that the drinking water triclosan levels were not present at or above 1 ppm.
Animal Source
Male and female B6C3F1/N mice were obtained from the National Toxicology Program (NTP) colony maintained by Taconic Biosciences, Inc. (Germantown, NY).
Animal Welfare
Animal care and use are in accordance with the Public Health Service Policy on Humane Care and Use of Animals. All animal studies were conducted in an animal facility accredited by AAALAC International. Studies were approved by the NCTR (Jefferson, AR) Animal Care and Use Committee and conducted in accordance with all relevant National Institutes of Health and NTP animal care and use policies and applicable federal, state, and local regulations and guidelines.
Two-year Study
Dose Selection Rationale
To formulate a scientific basis for the dose selection for the 2-year dermal carcinogenicity bioassay, a dermal subchronic study was conducted.4 Body weight changes and increases in the incidences of epidermal hyperplasia and parakeratosis at the site of application in the 27 mg triclosan/kg body weight/day (mg/kg/day) groups informed the selection of 12.5 mg/kg/day triclosan in ethanol as the high dose for male and female B6C3F1/N mice. The lowest dose selected was 10-fold lower than the highest dose, and the intermediate doses were equally spaced between the highest and lowest doses, based on a 10(1/3) dose spacing. Specifically, male and female B6C3F1/N mice were dermally administered 0, 1.25, 2.7, 5.8, or 12.5 mg/kg/day triclosan in 95% ethanol, 7 days per week for 2 years.
Study Design for Mice
Male and female B6C3F1/N mice were 3 weeks old upon receipt and were quarantined for 3 weeks before study start. At 5 weeks of age, mice were randomly assigned to one of six dose groups (n = 48 mice/sex/dose group). Randomization was stratified by body weight that produced similar group mean body weights using SAS software, Version 9.2 (Cary, NC). Starting at 6 weeks of age, mice were left untreated or dermally administered 0 (vehicle control group), 1.25, 2.7, 5.8, or 12.5 mg/kg/day triclosan for 2 years.
Approximately 24 hours before the first dermal administration of triclosan, the fur of each mouse was closely clipped on the dorsal surface from the shoulder region to the lumbar region using a Wahl Pocket Pro compact trimmer (Shelton, CT) with a size 40 blade. The clippers were battery operated and disposable; the blades were not changed. New clippers were used weekly (at the beginning of a clipping session) or as needed should the blade appear too dull during clipping. There were no instances when the clippers became hot. The mice groups were clipped in the following order: vehicle control, low dose, middle dose, and high dose. The untreated control animals were clipped after all other activities (i.e., weighing, clipping, and dosing animals; clinical observations; and cage changes) were completed for the vehicle control and dosed animals. Gloves were changed and the workstation was cleaned with disinfectant detergent and wiped with a 70% ethanol solution before clipping the untreated control mice. A separate set of clippers was used for the untreated control animals. The clipped area was rinsed with water, dried, and examined for nicks or breaks in the skin. The rinsing procedure was performed every time the animal was clipped. The site of application was re-clipped approximately once per week or as needed during the study. For animals with sores at the application site, care was taken to avoid clipping the fur in the areas containing sores to prevent further irritation to the area. Each animal in all six dose groups was clipped in this manner for the duration of the study. Any animal with abrasions or lesions in the clipped area was evaluated for possible exclusion from the study. No procedures were implemented to prevent incidental ingestion due to normal grooming behavior; however, animals were housed individually, and dorsal application was utilized to limit oral exposure. Elizabethan collars were not used due to the potential stress they would cause to the mice during the 2-year study.
All doses were administered in ethanol, at a dose volume of 1.0 mL/kg body weight; vehicle control animals received ethanol only and the untreated control group did not receive any dermal application of vehicle or test article. The animals were dosed in the following order: vehicle control, low dose, middle dose, and high dose (i.e., 0, 1.25, 2.7, 5.8, and 12.5 mg/kg/day). Dosing was conducted with a Hamilton Microlab 500 series pump, equipped with a Concord push-button hand pipettor/probe dispenser. The animals were placed on a grid, held by the base of their tails for dosing, and returned to their cages approximately 1 minute after the completion of dosing. The surface of the grid was cleaned if a dose was spilled as well as at the end of all dosing for the day. Gloves were changed between dose groups or more often if necessary. Dosing was completed for each mouse within 3 hours of the dosing time on the previous day. Untreated control animals were only handled while changing cages, clipping fur, weighing the animals, and performing clinical observations. The activities for untreated control animals were performed last, and gloves were changed before these animals were handled.
Twenty-eight male and 28 female mice were randomly selected for parasite evaluation and gross observation of disease. The health of the mice was monitored during the study as described in Appendix C. Additional animals were evaluated for disease screening prior to quarantine release; however, data are not included here. All test results from quarantine and sentinel evaluations were negative.
Mice were housed individually. Feed and water were available ad libitum. Cages were changed twice weekly and rotated every 2 weeks. Racks were changed and rotated every 2 weeks. Further details of animal maintenance are given in Table 1. Information on feed composition and contaminants is given in Appendix B.
Clinical Examinations and Pathology
In the 2-year study in mice, animals were observed twice daily for signs of morbidity and moribundity and were weighed before dermal administration of triclosan on day 1, weekly thereafter, and at study termination. Clinical observations were recorded weekly. Abnormal observations, including skin lesions, were recorded daily. Digital images of the site of application were taken monthly until the occurrence of a skin neoplasm, at which time digital images were taken weekly.
Complete necropsies and microscopic examinations were performed on all mice. At necropsy, all organs and tissues were examined for grossly visible lesions, and all major tissues were fixed and preserved in 10% neutral buffered formalin except for eyes and testes, which were first fixed in modified Davidson’s solution. Tissues were processed and trimmed, embedded in infiltrating media (Formula R®), sectioned at a thickness of approximately 5 μm, and stained with hematoxylin and eosin (H&E) for microscopic examination. For all paired organs (e.g., adrenal gland, kidney, ovary), samples from each organ were examined. Tissues examined microscopically are listed in Table 1.
Microscopic evaluations were completed by the study laboratory pathologist, and the pathology data were entered into the Toxicology Data Management System. The report, slides, paraffin blocks, residual wet tissues, and pathology data were sent to the NTP Archives for inventory, slide/block match, wet tissue audit, and storage. The slides, individual animal data records, and pathology tables were evaluated by a quality assessment (QA) pathologist at a pathology laboratory independent of the study laboratory. The individual animal records and tables were compared for accuracy, the slide and tissue counts were verified, and the histotechnique was evaluated. A QA pathologist evaluated slides from all neoplasms and all potential target organs, which included the skin (site of application) and liver.
The QA report and the reviewed slides were submitted to the Pathology Working Group (PWG) coordinator, who reviewed the selected tissues and addressed any inconsistencies in the diagnoses made by the laboratory and QA pathologists. Representative histopathology slides containing examples of lesions related to chemical administration, examples of disagreements in diagnoses between the laboratory and QA pathologists, or lesions of general interest were presented by the coordinator to the PWG for review. The PWG consisted of the QA pathologist and other pathologists experienced in rodent toxicologic pathology. This group examined the tissues without any knowledge of dose groups. When the PWG consensus diagnosis differed from that of the laboratory pathologist, the diagnosis was changed. Final diagnoses for reviewed lesions represent a consensus between the laboratory pathologist, reviewing pathologist(s), and the PWG. Details of these review procedures have been described, in part, by Maronpot and Boorman9 and Boorman et al.10 For subsequent analyses of the pathology data, the decision of whether to evaluate the diagnosed lesions for each tissue type separately or combined was based generally on the guidelines of Brix et al.11
Benchmark Dose Analysis
Benchmark doses (BMD) and the lower 95% confidence limits (BMDL) were calculated using U.S. Environmental Protection Agency Benchmark Dose Software (version 2.4.0.70; https://www.epa.gov/bmds). The calculations were conducted using gamma, logistic, log-logistic, log-probit, multistage, probit, and Weibull models to fit the incidences of neoplasms and nonneoplastic lesions and the doses of triclosan administered dermally. The BMD10 and BMDL10 were defined as the dose that caused a 10% excess risk of the specified adverse effect over that observed in the vehicle control group and as the 95% lower bound on the BMD corresponding to a 10% extra risk, respectively.
Statistical Methods
Survival Analyses
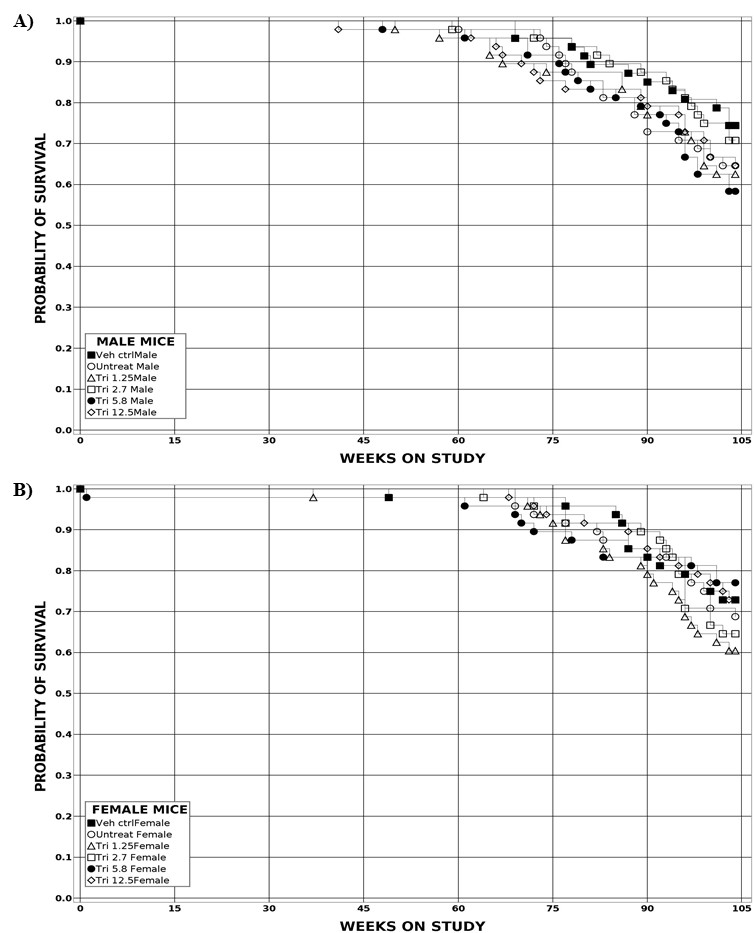
The probability of survival was estimated by the product-limit procedure of Kaplan and Meier12 and is presented graphically. Animals surviving to the end of the observation period are treated as censored observations, as are animals dying from unnatural causes within the observation period. Animals dying from natural causes are included in analyses and are treated as uncensored observations. For the 2-year mouse study, dose-related trends are identified with Tarone’s life-table test,13 and pairwise dose-related effects are assessed using Cox’s method.14 All reported p values for the survival analyses are two-sided.
Calculation of Incidence
The incidences of neoplasms or nonneoplastic lesions are presented as the numbers of animals bearing such lesions at a specific anatomic site. For calculation of incidence rates, the denominator for most neoplasms and all nonneoplastic lesions is the number of animals for which the site was examined microscopically. When macroscopic examination was required to detect neoplasms in certain tissues (e.g., mesentery, pleura, peripheral nerve, skeletal muscle, tongue, tooth, and Zymbal’s gland) before microscopic evaluation, however, the denominator consists of the number of animals that had a gross abnormality. When neoplasms had multiple potential sites of occurrence (e.g., leukemia or lymphoma), the denominator consists of the number of animals on which a necropsy was performed. Additional study data also give the survival-adjusted neoplasm rate for each group and each site-specific neoplasm. This survival-adjusted rate (based on the Poly-3 method described below) accounts for differential mortality by assigning a reduced risk of neoplasm, proportional to the third power of the fraction of time on study, only to site-specific, lesion-free animals that do not reach terminal euthanasia.
Analysis of Neoplasm and Nonneoplastic Lesion Incidence
Statistical analyses of neoplasm and nonneoplastic lesion incidence considered two features of the data. Some animals did not survive the entire 2 years of the study, so survival differences between groups had to be considered.
The Poly-k test15-17 was used to assess neoplasm and nonneoplastic lesion prevalence. This test is a survival-adjusted quantal-response procedure that modifies the Cochran-Armitage linear trend test to account for survival differences. More specifically, this method modifies the denominator in the quantal estimate of lesion incidence to approximate more closely the total number of animal years at risk. For analysis of a given site, each animal is assigned a risk weight. This value is 1 if the animal had a lesion at that site or if it survived until terminal euthanasia; if the animal died before terminal euthanasia and did not have a lesion at that site, its risk weight is the fraction of the entire study time that it survived, raised to the kth power.
This method yields a lesion prevalence rate that depends only on the choice of a shape parameter for a Weibull hazard function describing cumulative lesion incidence over time.15 Unless otherwise specified, a value of k = 3 was used in the analysis of site-specific lesions. This value was recommended by Bailer and Portier15 after an evaluation of neoplasm onset time distributions for a variety of site-specific neoplasms in control Fischer 344 rats and B6C3F1 mice.18 Bailer and Portier15 showed that the Poly-3 test gave valid results if the true value of k was anywhere in the range from 1 to 5. A further advantage of the Poly-3 method is that it does not require lesion lethality assumptions. Variation introduced by the use of risk weights, which reflect differential mortality, was accommodated by adjusting the variance of the Poly-3 statistic as recommended by Bieler and Williams.19 Poly-3 tests used the continuity correction described by Nam.20
Tests of significance included pairwise comparisons of each dosed group with the vehicle control group, a pairwise comparison of the vehicle control group with the untreated control group, and a test for an overall dose-related trend. Continuity-corrected Poly-3 tests were used in the analysis of lesion incidence and reported p values are one-sided. The significance of a lower incidence or negative trend in lesions is approximated as 1−p with the letter N added (e.g., p = 0.99 is presented as p = 0.01N).
Analysis of Continuous Variables
Each animal was weighed weekly starting at approximately PND 48; however, animals were not weighed at precisely the same time point relative to birth. Therefore, prior to analysis, locally estimated scatterplot smoothing (LOESS) was performed on the body weight data to rasterize to a set of common time points and reduce their number. The statistical model for the analysis of body weight was a repeated-measures, mixed-effects analysis of variance (ANOVA) model.21 A heterogeneous autoregressive covariance structure was used to account for body weight correlation across times within an animal and for the increasing variability in body weight as the body weights get larger. Comparisons to the vehicle control group were corrected using the Dunnett-Hsu method.22 To address considerable variability in body weights in the second year of the study and to consider any bias introduced during this time, an ANOVA was run on the full 2-year data record and also on a reduced 1-year data record (PND 50–386), during which minimal animal loss and body weight variations were observed.
Historical Control Data
The concurrent vehicle control group is the most valid comparison to the dosed groups and is the only control group analyzed statistically in NTP bioassays. Historical control data are often helpful in interpreting potential dose-related effects, however, particularly for uncommon or rare neoplasm types. For meaningful comparisons, the conditions for studies in the historical control data must be generally similar. Significant factors affecting the background incidence of neoplasms at a variety of sites are diet, sex, strain/stock, and route of exposure. The NTP historical control database contains all 2-year studies for each species, sex, and strain/stock with histopathology findings in control animals completed within the most recent 5-year period23-25 for comparison across multiple technical reports. In general, the historical control data for a given study includes studies using the same route of administration, and the overall incidence of neoplasms in controls for all routes of administration are included for comparison.
Quality Assurance Methods
The 2-year study was conducted in compliance with U.S. Food and Drug Administration Good Laboratory Practice Regulations.26 In addition, a draft of this NTP Technical Report was audited by an independent QA contractor against the study protocol and report. The audit findings were reviewed and assessed by Division of Translational Toxicology and National Center for Toxicological Research staff, and all comments were resolved or otherwise addressed during the preparation of this Technical Report.
Results
Data Availability
All study data were evaluated. Data relevant for evaluating toxicological findings are presented here. All study data are available in the National Toxicology Program (NTP) Chemical Effects in Biological Systems (CEBS) database: https://doi.org/10.22427/NTP-DATA-TR-604.27
Mice
Two-year Study
Estimates of survival probabilities for mice are shown in Table 2 and in the Kaplan-Meier survival curves (Figure 2). The survival of all dosed groups of male and female mice was similar to that of the vehicle control group.
At the site of application, minimal to mild skin lesions, including cuts, scratches, dark pigmentation, dry skin, flaking, sore, and tissue mass, were observed (Appendix E). Scratches were considered to be dose-related in both sexes. Dry skin and flaking either did not occur or occurred at a low incidence except in the 12.5 mg/kg/day male and female groups. Dark pigmentation was considered to be related to vehicle administration, and all other lesions were not considered to be related to vehicle or triclosan administration. These lesions were not considered sufficiently severe to require early termination of any of the mice in the study.
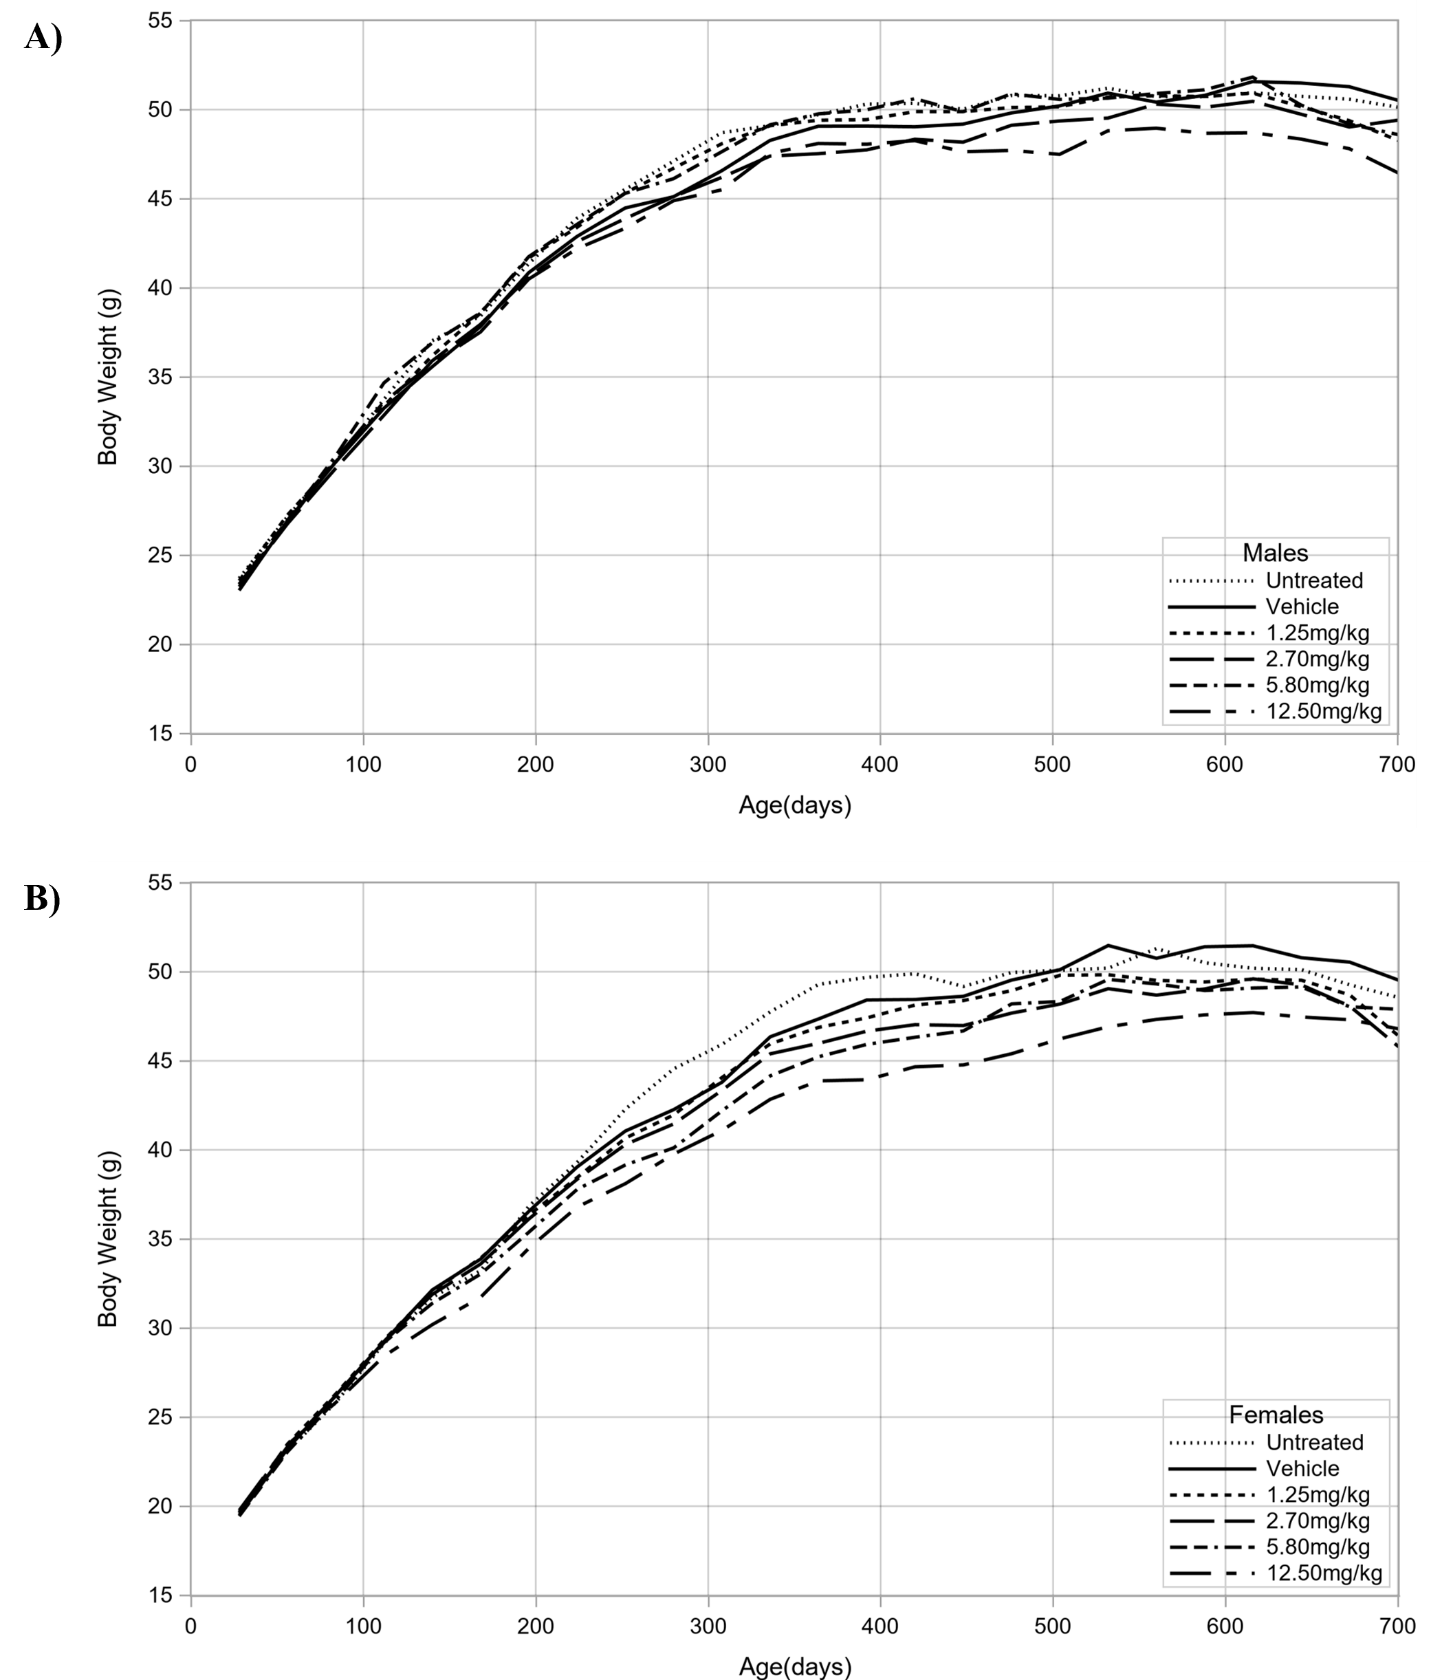
In male mice, dermal administration of triclosan over the full 2 years of the study caused a negative trend in body weights, with the decrease being significant in the 12.5 mg/kg/day group relative to the vehicle control group (Table 3; Figure 3). Compared to the vehicle control group, the decreases in the body weights of male mice dosed with 12.5 mg/kg/day never exceeded 7%. In female mice, dermal administration of triclosan over the full 2 years of the study caused a negative trend in body weights, with the decrease being significant in the 12.5 mg/kg/day group relative to the vehicle control group (Table 4; Figure 3). Compared to the vehicle control group, the decreases in the body weights of female mice dosed with 12.5 mg/kg/day never exceeded 8%.
Histopathology
This section describes the statistically significant or biologically noteworthy changes in the incidence of neoplasms and/or nonneoplastic lesions of the liver, pancreas, and skin. The appropriate statistical comparison is to the vehicle control animals, which were subjected to the same daily stress of handling and dosing as the triclosan-dosed groups. Data from the untreated control animals are also reported.
Liver: In male mice, triclosan administration resulted in positive trends in the incidences of hepatocellular carcinoma and hepatocellular adenoma or carcinoma (combined), with the increase being significant in the ≥5.8 and ≥2.7 mg/kg/day groups, respectively, compared to the vehicle control group (Table 5). The incidence of hepatocellular carcinomas in the untreated control males was higher than that in the vehicle control males (Table 5). In female mice, there were no significant increases in the incidences of hepatocellular adenoma, hepatocellular carcinoma, or hepatocellular adenoma or carcinoma (combined). The multiplicity of hepatocellular neoplasms is presented in Table 5. No exposure-related nonneoplastic lesions were observed in the liver.
Pancreas: Female mice dosed with triclosan had a positive trend in the incidence of pancreatic islet adenoma; however, the increased incidence did not reach statistical significance in pairwise comparisons in dosed groups compared to the vehicle control group (Table 6). Neither pancreatic islet hyperplasia nor adenoma was observed in untreated female mice. Pancreatic islet carcinoma was observed in one female in both the untreated and vehicle control groups.
Pancreatic islet hyperplasia was characterized by an increase in the size of islets and islet cell numbers featuring a multifocal to diffuse distribution. The outline of hyperplastic islets was sometimes irregular with no compression of the surrounding acinar tissue. Islet cells were frequently hypertrophic but uniform. In contrast, islet cell adenomas were larger and well-circumscribed with compression of the peripheral tissue. Cellular growth patterns within the neoplasm ranged from sheets to nests or ribbons and pale staining.
Skin: Dose-related minimal to mild skin lesions were observed at the site of application in male and female mice. Male mice dosed with triclosan had a positive trend in the incidences of hyperplasia, suppurative inflammation, and ulceration of the epidermis at the site of application (Table 7). The incidence of epidermal hyperplasia became significant at 2.7 mg/kg/day and was present in approximately 90% of male mice at 12.5 mg/kg/day. The incidences of epidermal suppurative inflammation and ulceration were significantly increased at 12.5 mg/kg/day. Female mice dosed with triclosan had a positive trend in the incidence of hyperplasia of the epidermis at the site of application (Table 7). The incidence of epidermal hyperplasia became significant at 1.25 mg/kg/day and was present in approximately 80% of female mice at 12.5 mg/kg/day.
Epidermal hyperplasia was characterized by a thickening of the squamous epithelium due to increased layers of nucleated cells in the epidermis, with one or two cell layers considered as normal, three or four layers as minimal hyperplasia, five or six layers as mild hyperplasia, seven or eight layers as moderate hyperplasia, and more than eight layers as marked hyperplasia. Epidermal suppurative inflammation exhibited a predominant neutrophilic infiltrate. Epidermal ulceration was defined as complete loss of the epidermis with an overlying serocellular crust.
Other tissues: Male mice had positive trends in the incidences of histocyte infiltration of the lung and lymphoid tissue hyperplasia of the small intestine (Appendix E). Significantly increased incidences of lymphoid hyperplasia of the mandibular lymph node and lymphocyte infiltration of the urinary bladder were observed at 5.8 mg/kg/day. Suppurative inflammation of the preputial gland was also observed at 1.25 mg/kg/day. There were no differences in nonneoplastic lesions between the vehicle control group and the untreated control group. Female mice also had positive trends in the incidences of angiectasis and pars distalis hyperplasia of the pituitary gland, with the incidence of angiectasis becoming significant at 12.5 mg/kg/day. Pancreatic ductal dilatation also had a positive trend. Significantly increased incidences of lymphocytic infiltration of the Harderian gland and duct dilatation of the clitoral gland were observed at 12.5 mg/kg/day and 1.25 mg/kg/day, respectively. Except for lymphocytic infiltration of the Harderian gland, there were no differences in nonneoplastic lesions between the vehicle control group and the untreated control group (Appendix E).
Benchmark Dose Analysis
Benchmark dose (BMD) modeling was conducted on neoplasms (hepatocellular carcinoma in male mice and pancreatic islet adenoma in female mice) and nonneoplastic lesions (hyperplasia, suppurative inflammation, and ulceration of the epidermis in male mice and hyperplasia of the epidermis in female mice) (Table 8). Additional nonneoplastic lesions used for BMD modeling are presented in Appendix D. The 95% lower bound on the BMD corresponding to a 10% extra risk (BMDL10) for hepatocellular carcinoma in male mice ranged from 1.1 to 2.4 mg/kg/day, whereas the BMDL10 for pancreatic islet adenoma in female mice ranged from 11.7 to 12.3 mg/kg/day. In both male and female mice, the most sensitive nonneoplastic endpoint was epidermal hyperplasia. In male mice, the BMD calculations failed when using the entire epidermal hyperplasia data set. When the calculations were repeated without the 2.7 mg/kg/day group, the BMDL10 ranged from 1.6 to 2.8 mg/kg/day; when the 5.8 mg/kg/day group was eliminated, the comparable values were 0.88–0.93 mg/kg/day. In female mice, the BMDL10 for epidermal hyperplasia ranged from 1.5 to 3.0 mg/kg/day. Higher values were obtained for epidermal suppurative inflammation (3.1–7.6 mg/kg/day) and epidermal ulceration (6.6–9.7 mg/kg/day) in male mice.
Discussion
In the current 2-year mouse study, the survival of all dosed groups was similar to that of the vehicle control groups. There were significant decreases in body weight in the 12.5 mg triclosan/kg body weight/day (mg/kg/day) group for both sexes; nonetheless, the decrease was modest and did not exceed 8%. Minimal to mild gross lesions of the skin (dry flaking skin, scratches, thickened skin, and dark pigmentation) were observed in all dosed groups. The severity of these lesions was not sufficient to cause the removal of any animal from the study. There were no neoplasms observed at the site of triclosan application.
The dermal administration of triclosan resulted in increased incidences of hepatocellular neoplasms when compared to the vehicle control group, which is the most appropriate comparison. A positive trend in the incidence of hepatocellular carcinoma was noted in male mice, with the increase becoming significant at ≥5.8 mg/kg/day. The incidence of hepatocellular carcinoma in the vehicle control group was within the historical control range (10%–42%, average 25.16% for all routes of exposure), and the incidence in the 5.8 and 12.5 mg/kg/day groups was outside the historical control range. There was also a significant increase in the incidence of hepatocellular adenoma at 2.7 mg/kg/day. The incidence of hepatocellular adenoma or carcinoma (combined) was significantly increased in the ≥2.7 mg/kg/day groups, with a positive trend. Together these data indicate carcinogenic activity from the exposure to triclosan. The unusually high incidences of hepatocellular carcinoma and hepatocellular adenoma or carcinoma (combined) in the untreated control group (56% and 85%, respectively), compared to the vehicle control group (31% and 65%, respectively), and a lack of exposure-related nonneoplastic lesions in the liver, reduced confidence in the strength of the evidence. The incidence of hepatocellular carcinoma in the vehicle control males was within the historical control range, and the cause of the high incidence in the untreated control group, which was outside the historical control range, is unknown. Taken together, the significantly increased incidence of hepatocellular adenoma or carcinoma (combined) in male mice, relative to the vehicle control group, was some evidence of carcinogenic activity. This response did not occur in female mice.
The hepatocellular carcinoma incidence in untreated control male mice in the current study exceeded the NTP 5-year historical control incidence for all routes of exposure but is within the historical control range for dermal studies of Taconic B6C3F1 mice fed the NTP-2000 diet conducted between 1996 and 2010. The reason for the unusually high hepatocellular carcinoma incidence in the untreated control males in the current study is not known. However, the untreated control animals were not subjected to the same handling and dosing as the other groups, and this result does not negate the fact that there was a dose-related hepatocellular response in male mice administered triclosan compared to the vehicle control group.
Hepatocellular neoplasms have been reported in male and female CD-1 mice administered triclosan at dietary concentrations equivalent to doses of ≥30 mg/kg/day (summarized in Rodricks et al.3). Benchmark dose (BMD) modeling of hepatocellular carcinoma in the male B6C3F1/N mice indicated that the benchmark dose lower confidence limit (BMDL10) ranged from 1.1 to 2.4 mg/kg/day, which was similar to that of epidermal hyperplasia.
The mechanism for the hepatic neoplasm induction in the current study is not known; however, evidence has been presented for a mode of action involving peroxisome proliferator-activated receptor alpha (PPARα) and/or the constitutive androstane receptor (CAR).3,28,29 Other studies have shown that triclosan activates mouse, but not human, PPARα30 and that triclosan induces hepatocyte proliferation in wild type C57BL/6 mice but not in mice transfected with human PPARα.31
Triclosan has been shown to accelerate the development of hepatocellular carcinoma in male C57BL/6 Car+/− and C57BL/6 Car−/− mice initiated with N,N-diethylnitrosamine.32 This response was attributed to triclosan enhancing liver fibrosis and proliferation. Ethanol is metabolized to acetaldehyde, which reacts with DNA to result in a Schiff base that can be reduced to N2-ethyldeoxyguanosine.33,34 The possibility exists that exposure to ethanol may result in tumor initiation through the formation of N2-ethyldeoxyguanosine, a DNA adduct that is known to miscode,35 and the coadministration of triclosan could serve as a tumor promoter. Although the incidence of hepatic neoplasms was lower in the vehicle control group than in the untreated control group in the current study, that lower incidence is of unknown origin. In addition to hepatocellular carcinoma in male B6C3F1/N mice, triclosan induced a positive trend in pancreatic islet adenoma in female B6C3F1/N mice. Pancreatic islet adenoma is a rare neoplasm in female B6C3F1/N mice. In NTP 2-year studies conducted using Taconic B6C3F1/N mice and the NTP-2000 diet, control female mice have a mean incidence of 0.38% (range: 0%–2%) for all routes of exposure. Although there was a positive trend in the incidence of pancreatic islet adenoma, the occurrence of pancreatic islet adenomas and carcinomas in the control groups, along with the lack of exposure-related preneoplastic lesions, lowered confidence in the strength of the evidence. This was considered to be equivocal evidence of carcinogenic activity.
Neoplasms were not detected at the site of triclosan application in either sex. Histopathological examination of the site of triclosan application indicated the presence of epidermal hyperplasia in both sexes and epidermal suppurative inflammation and ulceration in male mice. Male mice had a significant increase in the incidences of epidermal hyperplasia at doses ≥2.7 mg/kg/day; in female mice, the increase became significant at 1.25 mg/kg/day. The increases in the incidences of epidermal suppurative inflammation and ulceration became significant at 12.5 mg/kg/day in male mice. BMD modeling of the skin lesions indicated that the BMDL10 was 0.88–2.8 mg/kg/day for epidermal hyperplasia in male mice and 1.5–3.0 mg/kg/day in female mice. These BMDL10 values are lower than those obtained in a previous 13-week dermal study.4 They are also lower than the BMDL10 of 47 mg/kg/day, determined from kidney toxicity in hamsters, which was used to calculate margins of safety for triclosan.3 Likewise, they are also lower than the 12 mg/kg/day no-observed-adverse-effect level (NOAEL), determined from hepatotoxicity and decreased spleen weights of female rats, which was used by the Scientific Committee on Consumer Products36 and Lee et al.37 in their calculations of margins of safety for exposure to triclosan, or a NOAEL of 75 mg/kg/day determined from lifetime studies in hamsters, which was used to calculate the margin of safety following dermal administration of triclosan.38
Male B6C3F1 mice receiving a single dermal administration of 10 mg/kg triclosan had a maximum plasma concentration (Cmax) of 26 μM, and mice receiving 100 mg/kg triclosan had a Cmax of 188 μM.5 These data suggest that mice receiving 1 mg/kg triclosan, a value similar to the BMDL10 values for epidermal hyperplasia, would have a Cmax of approximately 2 μM. Humans exposed to a single oral dose of 4 mg triclosan had plasma concentrations of approximately 1 μM.39 Likewise, oral exposure to 0.7 mg triclosan resulted in plasma concentrations of approximately 0.3 μM40; thus, dermal exposure equivalent to the BMDL10 values for epidermal hyperplasia in mice is expected to result in plasma concentrations that could occur in people who use mouthwash products containing triclosan.
References
1. Jones RD, Jampani HB, Newman JL, Lee AS. Triclosan: A review of effectiveness and safety in health care settings. Am J Infect Control. 2000; 28(2):184-196. DOI: 10.1067/mic.2000.102378 PubMed: 10760227
2. Fang JL, Stingley RL, Beland FA, Harrouk W, Lumpkins DL, Howard P. Occurrence, efficacy, metabolism, and toxicity of triclosan. J Environ Sci Health C Environ Carcinog Ecotoxicol Rev. 2010; 28(3):147-171. DOI: 10.1080/10590501.2010.504978 PubMed: 20859822
3. Rodricks JV, Swenberg JA, Borzelleca JF, Maronpot RR, Shipp AM. Triclosan: A critical review of the experimental data and development of margins of safety for consumer products. Crit Rev Toxicol. 2010; 40(5):422-484. DOI: 10.3109/10408441003667514 PubMed: 20377306
4. Fang JL, Vanlandingham MM, Juliar BE, Olson GR, Patton RE, Beland FA. Dose–response assessment of the dermal toxicity of triclosan in B6C3F1 mice. Toxicol Res (Camb). 2015; 4(4):867-877. DOI: 10.1039/C4TX00152D
5. Fang JL, Vanlandingham M, da Costa GG, Beland FA. Absorption and metabolism of triclosan after application to the skin of B6C3F1 mice. Environ Toxicol. 2016; 31(5):609-623. DOI: 10.1002/tox.22074 PubMed: 25410937
6. Tulp MTM, Sundström G, Martron LBJM, Hutzinger O. Metabolism of chlorodiphenyl ethers and Irgasan DP 300. Xenobiotica. 1979; 9(2):65-77. DOI: 10.3109/00498257909038708 PubMed: 433312
7. Lyman FL, Furia T. Toxicology of 2, 4, 4′-trichloro-2′-hydroxy-diphenyl ether. IMS Ind Med Surg. 1969; 38(2):64-71. PubMed: 5250173
8. U.S. Environmental Protection Agency (USEPA). Health effects test guidelines: OPPTS 870.4300: Combined chronic toxicity/carcinogenicity. Washington, DC: U.S Environmental Protection Agency, Prevention, Pesticides and Toxic Substances; 1998. EPA Report No. EPA 712-C-98-212. https://nepis.epa.gov/Exe/ZyPURL.cgi?Dockey=P100ID4F.txt
9. Maronpot RR, Boorman GA. Interpretation of rodent hepatocellular proliferative alterations and hepatocellular tumors in chemical safety assessment. Toxicol Pathol. 1982; 10(2):71-78. DOI: 10.1177/019262338201000210 PubMed: 28094716
10. Boorman GA, Haseman JK, Waters MD, Hardisty JF, Sills RC. Quality review procedures necessary for rodent pathology databases and toxicogenomic studies: The National Toxicology Program experience. Toxicol Pathol. 2002; 30(1):88-92. DOI: 10.1080/01926230252824752 PubMed: 11890481
11. Brix AE, Hardisty JF, McConnell EE. Combining neoplasms for evaluation of rodent carcinogenesis studies. In: Hsu CH, Stedeford T, editors. Cancer Risk Assessment: Chemical Carcinogenesis, Hazard Evaluation, and Risk Quantification. Hoboken, NJ: Wiley; 2010. p. 699-715. DOI: 10.1002/9780470622728.ch28
12. Kaplan EL, Meier P. Nonparametric estimation from incomplete observations. J Am Stat Assoc. 1958; 53(282):457-481. DOI: 10.1080/01621459.1958.10501452
13. Tarone RE. Tests for trend in life table analysis. Biometrika. 1975; 62(3):679-690. DOI: 10.1093/biomet/62.3.679
14. Cox DR. Regression models and life-tables. J R Stat Soc Series B Stat Methodol. 1972; 34(2):187-202. DOI: 10.1111/j.2517-6161.1972.tb00899.x
15. Bailer AJ, Portier CJ. Effects of treatment-induced mortality and tumor-induced mortality on tests for carcinogenicity in small samples. Biometrics. 1988; 44(2):417-431. DOI: 10.2307/2531856 PubMed: 3390507
16. Piegorsch WW, Bailer AJ. Statistics for environmental biology and toxicology: Section 6.3.2. London, UK: Chapman and Hall; 1997.
17. Portier CJ, Bailer AJ. Testing for increased carcinogenicity using a survival-adjusted quantal response test. Fundam Appl Toxicol. 1989; 12(4):731-737. DOI: 10.1016/0272-0590(89)90004-3 PubMed: 2744275
18. Portier CJ, Hedges JC, Hoel DG. Age-specific models of mortality and tumor onset for historical control animals in the National Toxicology Program’s carcinogenicity experiments. Cancer Res. 1986; 46(9):4372-4378. PubMed: 3731095
19. Bieler GS, Williams RL. Ratio estimates, the delta method, and quantal response tests for increased carcinogenicity. Biometrics. 1993; 49(3):793-801. DOI: 10.2307/2532200 PubMed: 8241374
20. Nam JM. A simple approximation for calculating sample sizes for detecting linear trend in proportions. Biometrics. 1987; 43(3):701-705. DOI: 10.2307/2532006 PubMed: 3663825
21. Littell RC, Milliken GA, Stroup WW, Wolfinger RD, Schabenberger O. SAS for mixed models. 2nd ed. Cary, NC: SAS Institute; 2006.
22. Hsu JC. The factor analytic approach to simultaneous inference in the general linear mode. J Comput Graph Stat. 1992; 1(2):151-168. DOI: 10.1080/10618600.1992.10477011
23. Haseman JK. Value of historical controls in the interpretation of rodent tumor data. Drug Inf J. 1992; 26(2):191-200. DOI: 10.1177/009286159202600210
24. Haseman JK. Data analysis: Statistical analysis and use of historical control data. Regul Toxicol Pharmacol. 1995; 21(1):52-59. DOI: 10.1006/rtph.1995.1009 PubMed: 7784636
25. Haseman JK, Rao GN. Effects of corn oil, time-related changes, and inter-laboratory variability on tumor occurrence in control Fischer 344 (F344/N) rats. Toxicol Pathol. 1992; 20(1):52-60. DOI: 10.1177/019262339202000107 PubMed: 1411131
26. U.S. Food and Drug Administration (FDA). 21 CFR Part 58. https://www.accessdata.fda.gov/scripts/cdrh/cfdocs/cfcfr/CFRSearch.cfm?CFRPart=58
27. National Toxicology Program (NTP). TR-604: Pathology tables, survival and growth curves from NTP long-term studies. 2024; DOI: 10.22427/NTP-DATA-TR-604
28. Paul KB, Thompson JT, Simmons SO, Vanden Heuvel JP, Crofton KM. Evidence for triclosan-induced activation of human and rodent xenobiotic nuclear receptors. Toxicol In Vitro. 2013; 27(7):2049-2060. DOI: 10.1016/j.tiv.2013.07.008 PubMed: 23899473
29. Wang Z, Li X, Klaunig JE. Investigation of the mechanism of triclosan induced mouse liver tumors. Regul Toxicol Pharmacol. 2017; 86:137-147. DOI: 10.1016/j.yrtph.2017.03.001 PubMed: 28267557
30. Wu Y, Wu Q, Beland FA, Ge P, Manjanatha MG, Fang JL. Differential effects of triclosan on the activation of mouse and human peroxisome proliferator-activated receptor alpha. Toxicol Lett. 2014; 231(1):17-28. DOI: 10.1016/j.toxlet.2014.09.001 PubMed: 25193434
31. Tang Y, Vanlandingham MM, Wu Y, Beland FA, Olson GR, Fang JL. Role of peroxisome proliferator-activated receptor alpha (PPARα) and PPARα-mediated species differences in triclosan-induced liver toxicity. Arch Toxicol. 2018; 92(11):3391-3402. DOI: 10.1007/s00204-018-2308-7 PubMed: 30238133
32. Yueh MF, Taniguchi K, Chen S, Evans RM, Hammock BD, Karin M, Tukey RH. The commonly used antimicrobial additive triclosan is a liver tumor promoter. Proc Natl Acad Sci U S A. 2014; 111(48):17200-17205. DOI: 10.1073/pnas.1419119111 PubMed: 25404284
33. Fang JL, Vaca CE. Detection of DNA adducts of acetaldehyde in peripheral white blood cells of alcohol abusers. Carcinogenesis. 1997; 18(4):627-632. DOI: 10.1093/carcin/18.4.627 PubMed: 9111191
34. Balbo S, Hashibe M, Gundy S, Brennan P, Canova C, Simonato L, Merletti F, Richiardi L, Agudo A, Castellsagué X, et al. N2-ethyldeoxyguanosine as a potential biomarker for assessing effects of alcohol consumption on DNA. Cancer Epidemiol Biomarkers Prev. 2008; 17(11):3026-3032. DOI: 10.1158/1055-9965.EPI-08-0117 PubMed: 18990745
35. Terashima I, Matsuda T, Fang TW, Suzuki N, Kobayashi J, Kohda K, Shibutani S. Miscoding potential of the N2-ethyl-2′-deoxyguanosine DNA adduct by the exonuclease-free Klenow fragment of Escherichia coli DNA polymerase I. Biochemistry. 2001; 40(13):4106-4114. DOI: 10.1021/bi002719p PubMed: 11300791
36. Scientific Committee on Consumer Products (SCCP). Opinion on triclosan: Colipa n° P32. Brussels, Belgium: European Commission, Health and Consumer Protection, Directorate-General; 2009. SCCP/1192/08. https://ec.europa.eu/health/ph_risk/committees/04_sccp/docs/sccp_o_166.pdf
37. Lee JD, Lee JY, Kwack SJ, Shin CY, Jang HJ, Kim HY, Kim MK, Seo DW, Lee BM, Kim KB. Risk assessment of triclosan, a cosmetic preservative. Toxicol Res. 2019; 35(2):137-154. DOI: 10.5487/TR.2019.35.2.137 PubMed: 31015896
38. Queckenberg C, Meins J, Wachall B, Doroshyenko O, Tomalik-Scharte D, Bastian B, Abdel-Tawab M, Fuhr U. Absorption, pharmacokinetics, and safety of triclosan after dermal administration. Antimicrob Agents Chemother. 2010; 54(1):570-572. DOI: 10.1128/AAC.00615-09 PubMed: 19822703
39. Sandborgh-Englund G, Adolfsson-Erici M, Odham G, Ekstrand J. Pharmacokinetics of triclosan following oral ingestion in humans. J Toxicol Environ Health A. 2006; 69(20):1861-1873. DOI: 10.1080/15287390600631706 PubMed: 16952905
40. Lin YJ. Buccal absorption of triclosan following topical mouthrinse application. Am J Dent. 2000; 13(4):215-217. PubMed: 11763935
Conclusions
Under the conditions of this 2-year dermal study, there was some evidence of carcinogenic activity of triclosan in male B6C3F1/N mice based on the increased incidences of hepatocellular adenoma or carcinoma (combined). There was equivocal evidence of carcinogenic activity of triclosan in female B6C3F1/N mice based on higher occurrences of pancreatic islet adenomas.
Dermal administration of triclosan resulted in increased incidences of nonneoplastic epidermal lesions at the site of application in male and female mice.
Appendices
Appendix A. Chemical Characterization and Dose Formulation Studies
A.1.
Procurement and Characterization
A.1.1.
Triclosan
Triclosan was obtained from Alfa Aesar (Ward Hill, MA) in a single lot (5001A29X). Identity, purity, and stability analyses were conducted by the study laboratory at the U.S. Food and Drug Administration’s National Center for Toxicological Research (NCTR, Jefferson, AR). Reports on analyses performed in support of the triclosan studies are on file at the National Institute of Environmental Health Sciences.
The identity of the test lot was evaluated using 1H nuclear magnetic resonance (NMR) spectroscopy. The 1H NMR spectrum was consistent with the structure of triclosan and identical to that of the reference standard (lot 1412854V, Sigma Aldrich, St. Louis, MO) (Figure A-1). No resonances due to contaminants were present in the spectrum except those produced by water and solvent. The identity of lot 5001A29X was further confirmed using mass spectrometry (MS) after separation by high-performance liquid chromatography (HPLC) with diode array detection (PDA) (Table A-1, System A). The MS spectrum was consistent with the structure of triclosan, which confirmed that the test lot corresponded to triclosan.
Purity evaluation was conducted by HPLC/PDA (Table A-1, System B) using a 1.0 mg/mL sample of the test lot dissolved in methanol. No impurities were identified using HPLC/PDA. The overall purity of lot 5001A29X was estimated to be 99.9% by comparing the peak area with the reference standard, which was consistent with the 99.0% purity indicated by the manufacturer. The 1H NMR analysis of the test article was consistent with this purity determination. Additionally, the test lot matched the reference standard’s HPLC retention time and ultraviolet (UV) spectrum. Repeated purity evaluation conducted at the end of the study confirmed a purity of 99.9%.
The test article was received in amber jars and stored at room temperature.
A.1.2.
Ethanol
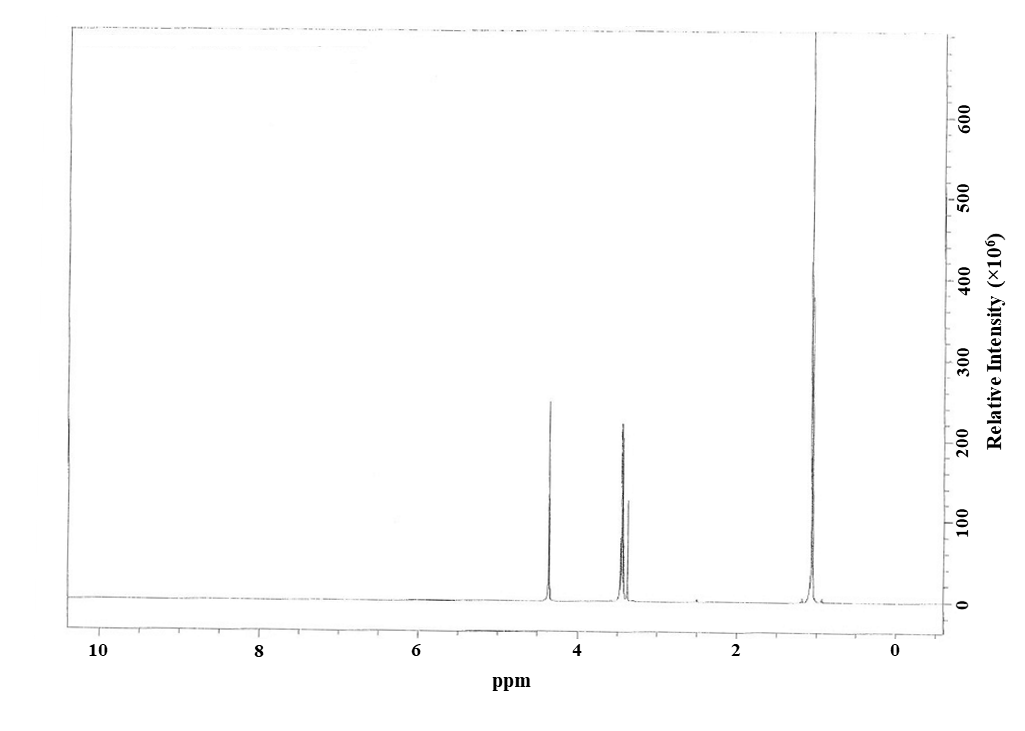
The 95% ethanol dose vehicle was obtained from Decon Laboratories (King of Prussia, PA) in a single lot (2801G). The identity of ethanol was confirmed using 1H NMR spectroscopy. The NMR spectrum was consistent with the structure of ethanol, and there was no evidence of contamination by other proton-containing compounds (Figure A-2).
Purity evaluation of lot 2801G was conducted by the study laboratory using HPLC/PDA (Table A-1, System B). The chromatograms did not show any UV chromophore-containing components above background, confirming a purity consistent with the 95% purity specified by the vendor. Batches of the ethanol dose vehicle were evaluated for the presence of triclosan before and after the study, and no triclosan was detected.
The ethanol dose vehicle was received in amber glass containers and stored at room temperature.
A.2.
Preparation and Analysis of Dose Formulations
Dose formulations of triclosan (lot 5001A29X) in 95% ethanol were prepared by Priority One Services (Alexandria, VA) following the protocols outlined in Table A-2. Dose formulations were prepared at 1.25, 2.7, 5.8, and 12.5 mg/L (25 preparations; September 2013–August 2015) and were refrigerated, protected from light, and used within approximately 1 month of mixing.
Stability studies of the dose formulations stored at room (25°C) or refrigerated (2°C–8°C) temperatures were conducted using HPLC/PDA (Table A-1, System B). The lowest (1.25 mg/mL) and highest (12.5 mg/mL) dose formulations were evaluated after 8 weeks at refrigerated temperatures or 4 weeks at room temperature. Stability for up to 56 days under refrigerated temperatures was confirmed. The dose formulations were also found to be homogeneous, as the percent coefficient of variation (%CV) values of three replicate samples per dose preparation were all ≤10%, with one exception: the 2.7 mg/mL formulation prepared on January 13, 2014, had a %CV value of 10.6%.
Analyses of preadministration dose formulations were conducted by the study laboratory using HPLC/PDA (Table A-1, System B). All dose formulations were within 10% of the target concentrations, with one exception: the 12.5 mg/mL formulation prepared on February 19, 2014, had a concentration of only 1.31 mg/mL. However, this dose was remixed on February 21, 2014, and the new solution was within 10% of the target concentration (Table A-3).
A.3.
Analysis of Triclosan in Experimental Background Materials
The animal feed (NTP-2000 Irradiated Rodent Diet) and drinking water (Millipore-filtered drinking water) were analyzed for the presence of background triclosan using ultra-performance liquid chromatography (UPLC) with MS (Table A-1, System C). Animal feed samples were ground to a powder and extracted with acetonitrile. The acetonitrile supernatant was assayed by UPLC-MS and compared with feed samples spiked at 1 ppm triclosan. Although a prominent triclosan peak was observed in the spiked samples, the peak was not detectable in the unspiked samples, indicating that any possible background levels of triclosan in the feed were not present at or above 1 ppm. Additionally, peak areas observed for triclosan in the three drinking water samples were negligible in comparison with water samples spiked at 1 ppm triclosan, indicating that the drinking water triclosan levels were not present at or above 1 ppm.
Table A-1. Liquid Chromatography Systems Used in the Two-year Dermal Study of Triclosan
| Chromatography | Detection System | Column | Mobile Phase |
|---|---|---|---|
| System A | |||
| High-performance liquid chromatography | Diode array detector (200–400 nm) and tandem mass spectrometry (ESI) | Waters Acquity BEH C18 (2.1 × 50 mm, 1.7 μm particle size) | A: Acetonitrile B: Water Gradient program: A:B 20:80 to 90:10 in 4 min 500 μL/min flow rate |
| System B | |||
| High-performance liquid chromatography | Diode array detector (190–400 nm) | Waters Novapak-C18 (3.9 mm × 150 mm, 4 μm particle size) | A: 5 mM phosphate buffer:methanol, pH 2.5 (95:5) B: 5 mM phosphate buffer:methanol, pH 2.5 (5:95) Gradient program: A:B 100:0 hold for 3 min; 0:100 for 9.5 min at gradient curve 6; 0:100 for 0.75 min at gradient curve 11; 100:0 for 26.75 min at gradient curve 11. |
| System C | |||
| Ultra-performance liquid chromatography | Mass spectrometry (ESI) | Waters Acquity BEH C18 (1.2 mm × 50 mm, 1.7 μm particle size) | A: Water B: Acetonitrile Gradient program: A:B 80:20 hold for 4 min; 10:90 for 0.1 min at gradient curve 6; 80:20 for 1.9 min at gradient curve 6. |
Table A-2. Preparation and Storage of Dose Formulations Administered to Mice in the Two-year Dermal Study of Triclosan
| Preparation |
|---|
| Formulations were prepared by weighing the required amount of triclosan powder into a glass beaker and pouring ~70% of the required ethanol volume into the beaker. Formulations were stirred with a stir bar for ~5 minutes and transferred to a volumetric flask. The remaining ethanol was added with a syringe or pipette, and the flask was inverted several times to mix. The formulations were transferred into the required number of amber glass, screw-top bottles for dosing. Additional mixing occurred as needed during storage. |
| Chemical lot number |
| 5001A29X (Alfa Aesar, Ward Hill, MA) |
| Vehicle lot number |
| 2801G (Decon Laboratories, King of Prussia, PA) |
| Maximum storage time |
| 56 days |
| Storage conditions |
| Amber glass bottles at 2°C–8°C |
| Study laboratory |
| National Center for Toxicological Research (Jefferson, AR) |
Table A-3. Results of Analyses of Dose Formulations Administered to Mice in the Two-year Dermal Study of Triclosan
| Date Prepared | Date Analyzed | Target Concentration (mg/mL) | Determined Concentration (mg/mL)a | Difference from Target (%) |
|---|---|---|---|---|
| September 5, 2013 | September 10, 2013 | 0 | BLOQ | NA |
| 1.25 | 1.29 ± 0.09 | 3.2 | ||
| 2.7 | 2.93 ± 0.22 | 8.5 | ||
| 5.8 | 6.03 ± 0.17 | 4.0 | ||
| 12.5 | 12.1 ± 0.18 | −3.2 | ||
| September 23, 2013 | September 25, 2013 | 0 | BLOQ | NA |
| 1.25 | 1.20 ± 0.05 | −4.0 | ||
| 2.7 | 2.68 ± 0.2 | −0.7 | ||
| 5.8 | 5.86 ± 0.2 | 1.0 | ||
| 12.5 | 13.1 ± 1.0 | 4.8 | ||
| September 30, 2013 | October 9, 2013 | 0 | BLOQ | NA |
| 1.25 | 1.24 ± 0.10 | −0.8 | ||
| 2.7 | 2.80 ± 0.01 | 3.7 | ||
| 5.8 | 5.70 ± 0.46 | −1.7 | ||
| 12.5 | 13.6 ± 0.4 | 8.8 | ||
| November 4, 2013 | November 6, 2013 | 0 | BLOQ | NA |
| 1.25 | 1.32 ± 0.01 | 5.6 | ||
| 2.7 | 2.85 ± 0.01 | 5.6 | ||
| 5.8 | 5.83 ± 0.07 | 0.5 | ||
| 12.5 | 11.9 ± 1.2 | −4.8 | ||
| December 10, 2013 | December 16, 2013 | 0 | BLOQ | NA |
| 1.25 | 1.16 ± 0.09 | −7.2 | ||
| 2.7 | 2.51 ± 0.25 | −7.0 | ||
| 5.8 | 5.68 ± 0.4 | −2.1 | ||
| 12.5 | 12.6 ± 0.16 | 0.8 | ||
| January 13, 2014 | January 15, 2014 | 0 | BLOQ | NA |
| 1.25 | 1.25 ± 0.11 | 0.0 | ||
| 2.7 | 2.96 ± 0.31 | 9.6 | ||
| 5.8 | 6.04 ± 0.48 | 4.1 | ||
| 12.5 | 13.0 ± 1.25 | 4.0 | ||
| February 19, 2014 | February 21, 2014 | 0 | BLOQ | NA |
| 1.25 | 1.37 ± 0.06 | 9.6 | ||
| 2.7 | 2.72 ± 0.21 | 0.7 | ||
| 5.8 | 5.99 ± 0.22 | 3.3 | ||
| 12.5b | 12.0 ± 0.35 | −4.0 | ||
| March 18, 2014 | March 20, 2014 | 0 | BLOQ | NA |
| 1.25 | 1.37 ± 0.05 | 9.6 | ||
| 2.7 | 2.74 ± 0.19 | 1.5 | ||
| 5.8 | 5.75 ± 0.31 | −0.9 | ||
| 12.5 | 13.1 ± 0.54 | 4.8 | ||
| April 21, 2014 | April 22, 2014 | 0 | BLOQ | NA |
| 1.25 | 1.25 ± 0.09 | 0.0 | ||
| 2.7 | 2.72 ± 0.01 | 0.7 | ||
| 5.8 | 5.69 ± 0.11 | −1.9 | ||
| 12.5 | 12.9 ± 0.2 | 3.2 | ||
| May 21, 2014 | May 23, 2014 | 0 | BLOQ | NA |
| 1.25 | 1.29 ± 0.01 | 3.2 | ||
| 2.7 | 2.75 ± 0.02 | 1.9 | ||
| 5.8 | 5.95 ± 0.05 | 2.6 | ||
| 12.5 | 12.8 ± 0.10 | 2.4 | ||
| June 18, 2014 | June 19, 2014 | 0 | BLOQ | NA |
| 1.25 | 1.26 ± 0.05 | 0.8 | ||
| 2.7 | 2.77 ± 0.01 | 2.6 | ||
| 5.8 | 5.9 ± 0.02 | 1.7 | ||
| 12.5 | 12.6 ± 0.07 | 0.8 | ||
| July 15, 2014 | July 16, 2014 | 0 | BLOQ | NA |
| 1.25 | 1.25 ± 0.01 | 0.0 | ||
| 2.7 | 2.69 ± 0.03 | −0.4 | ||
| 5.8 | 5.76 ± 0.04 | −0.7 | ||
| 12.5 | 12.3 ± 0.33 | −1.6 | ||
| August 19, 2014 | August 21, 2014 | 0 | BLOQ | NA |
| 1.25 | 1.23 ± 0.02 | −1.6 | ||
| 2.7 | 2.61 ± 0.03 | −3.3 | ||
| 5.8 | 5.49 ± 0.07 | −5.3 | ||
| 12.5 | 12.0 ± 0.57 | −4.0 | ||
| September 22, 2014 | September 25, 2014 | 0 | BLOQ | NA |
| 1.25 | 1.31 ± 0.06 | 4.8 | ||
| 2.7 | 2.78 ± 0.1 | 3.0 | ||
| 5.8 | 5.91 ± 0.57 | 1.9 | ||
| 12.5 | 13.4 ± 0.13 | 7.2 | ||
| October 21, 2014 | October 24, 2014 | 0 | BLOQ | NA |
| 1.25 | 1.36 ± 0.00 | 8.8 | ||
| 2.7 | 2.75 ± 0.19 | 1.9 | ||
| 5.8 | 6.18 ± 0.01 | 6.6 | ||
| 12.5 | 13.3 ± 0.36 | 6.4 | ||
| November 17, 2014 | November 20, 2014 | 0 | BLOQ | NA |
| 1.25 | 1.26 ± 0.02 | 0.8 | ||
| 2.7 | 2.65 ± 0.02 | −1.9 | ||
| 5.8 | 5.45 ± 0.12 | −6.0 | ||
| 12.5 | 12.0 ± 0.12 | −4.0 | ||
| December 15, 2014 | December 19, 2014 | 0 | BLOQ | NA |
| 1.25 | 1.24 ± 0.04 | −0.8 | ||
| 2.7 | 2.56 ± 0.07 | −5.2 | ||
| 5.8 | 5.64 ± 0.21 | −2.8 | ||
| 12.5 | 11.6 ± 0.34 | −7.2 | ||
| January 13, 2015 | January 16, 2015 | 0 | BLOQ | NA |
| 1.25 | 1.22 ± 0.04 | −2.4 | ||
| 2.7 | 2.64 ± 0.04 | −2.2 | ||
| 5.8 | 6.18 ± 0.05 | 6.6 | ||
| 12.5 | 12.6 ± 0.9 | 0.8 | ||
| February 18, 2015 | February 27, 2015 | 0 | BLOQ | NA |
| 1.25 | 1.24 ± 0.09 | −0.8 | ||
| 2.7 | 2.64 ± 0.12 | −2.2 | ||
| 5.8 | 5.71 ± 0.17 | −1.6 | ||
| 12.5 | 12.4 ± 0.4 | −0.8 | ||
| March 16, 2015 | March 20, 2015 | 0 | BLOQ | NA |
| 1.25 | 1.33 ± 0.04 | 6.4 | ||
| 2.7 | 2.63 ± 0.2 | −2.6 | ||
| 5.8 | 6.07 ± 0.38 | 4.7 | ||
| 12.5 | 12.8 ± 0.6 | 2.4 | ||
| April 14, 2015 | April 16, 2015 | 0 | BLOQ | NA |
| 1.25 | 1.33 ± 0.1 | 6.4 | ||
| 2.7 | 2.79 ± 0.1 | 3.3 | ||
| 5.8 | 5.86 ± 0.27 | 1.0 | ||
| 12.5 | 13.2 ± 0.1 | 5.6 | ||
| May 18, 2015 | May 20, 2015 | 0 | BLOQ | NA |
| 1.25 | 1.24 ± 0.01 | −0.8 | ||
| 2.7 | 2.7 ± 0.04 | 0.0 | ||
| 5.8 | 5.84 ± 0.06 | 0.7 | ||
| 12.5 | 12.5 ± 0.05 | 0.0 | ||
| June 15, 2015 | June 17, 2015 | 0 | BLOQ | NA |
| 1.25 | 1.27 ± 0.02 | 1.6 | ||
| 2.7 | 2.7 ± 0.07 | 0.0 | ||
| 5.8 | 5.71 ± 0.04 | −1.6 | ||
| 12.5 | 12.1 ± 0.4 | −3.2 | ||
| July 20, 2015 | July 24, 2015 | 0 | BLOQ | NA |
| 1.25 | 1.20 ± 0.01 | −4.0 | ||
| 2.7 | 2.54 ± 0.02 | −5.9 | ||
| 5.8 | 5.58 ± 0.04 | −3.8 | ||
| 12.5 | 12.0 ± 0.3 | −4.0 | ||
| August 24, 2015 | August 27, 2015 | 0 | BLOQ | NA |
| 1.25 | 1.19 ± 0.01 | −4.8 | ||
| 2.7 | 2.61 ± 0.04 | −3.3 | ||
| 5.8 | 5.62 ± 0.08 | −3.1 | ||
| 12.5 | 12.3 ± 0.2 | −1.6 |
Figure A-1. 1H Nuclear Magnetic Resonance Spectrum of Triclosan
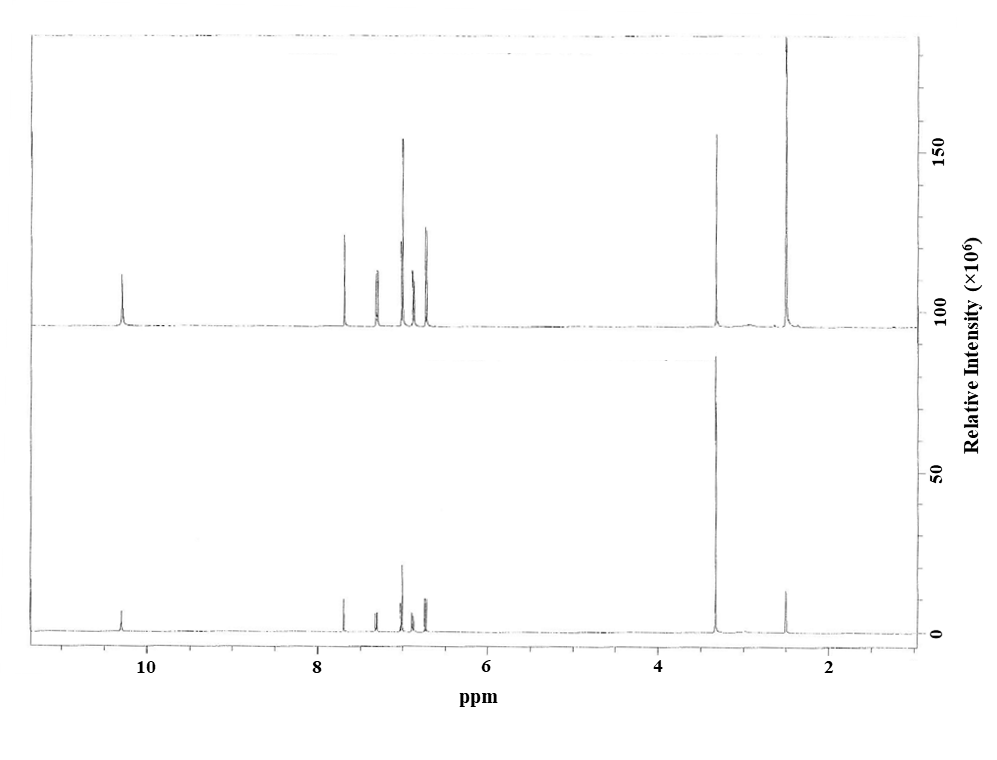
Figure A-2. 1H Nuclear Magnetic Resonance Spectrum of Ethanol
Appendix B. Ingredients, Nutrient Composition, and Contaminant Levels in NTP-2000 Mouse Ration
B.1.
NTP-2000 Feed
Table B-1. Ingredients of NTP-2000 Mouse Ration
| Ingredients | Percent by Weight |
|---|---|
| Ground hard winter wheat | 23.00 |
| Ground #2 yellow shelled corn | 22.44 |
| Wheat middlings | 15.00 |
| Oat hulls | 8.50 |
| Alfalfa meal (dehydrated, 17% protein) | 7.50 |
| Purified cellulose | 5.50 |
| Soy protein concentrate | 4.00 |
| Fish meal (60% protein) | 4.00 |
| Corn oil (without preservatives) | 3.00 |
| Soy oil (without preservatives) | 3.00 |
| Dried brewer’s yeast | 1.00 |
| Calcium carbonate (USP) | 0.90 |
| Vitamin premixa | 0.50 |
| Mineral premixb | 0.50 |
| Calcium phosphate, dibasic (USP) | 0.40 |
| Sodium chloride | 0.30 |
| Choline chloride (70% choline) | 0.26 |
| Methionine | 0.20 |
Table B-2. Vitamins and Minerals in NTP-2000 Mouse Ration
| Amounta | Source | |
|---|---|---|
| Vitamins | ||
| Vitamin A | 4,000 IU | Stabilized vitamin A palmitate or acetate |
| Vitamin D | 1,000 IU | D-activated animal sterol |
| Vitamin K | 1.0 mg | Menadione sodium bisulfite complex |
| α-Tocopheryl acetate | 100 IU | – |
| Niacin | 23 mg | – |
| Folic acid | 1.1 mg | – |
| d-Pantothenic acid | 10 mg | d-Calcium pantothenate |
| Riboflavin | 3.3 mg | – |
| Thiamine | 4 mg | Thiamine mononitrate |
| B12 | 52 µg | – |
| Pyridoxine | 6.3 mg | Pyridoxine hydrochloride |
| Biotin | 0.2 mg | d-Biotin |
| Minerals | ||
| Magnesium | 514 mg | Magnesium oxide |
| Iron | 35 mg | Iron sulfate |
| Zinc | 12 mg | Zinc oxide |
| Manganese | 10 mg | Manganese oxide |
| Copper | 2.0 mg | Copper sulfate |
| Iodine | 0.2 mg | Calcium iodate |
| Chromium | 0.2 mg | Chromium acetate |
Table B-3. Nutrient Composition of NTP-2000 Mouse Ration
| Nutrient | Mean ± Standard Deviation | Range | Number of Samples |
|---|---|---|---|
| Protein (% by weight) | 14.72 ± 0.4622 | 14.1–15.5 | 13 |
| Crude fat (% by weight) | 7.96 ± 0.9014 | 5.1–8.7 | 13 |
| Crude fiber (% by weight) | 9.22 ± 0.6446 | 7.7–10.1 | 13 |
| Ash (% by weight) | 5.33 ± 1.320 | 4.72–9.7 | 13 |
| Amino acids (% of total diet) | |||
| Arginine | 0.806 ± 0.074 | 0.67–0.97 | 30 |
| Cystine | 0.220 ± 0.0212 | 0.15–0.25 | 30 |
| Glycine | 0.702 ± 0.037 | 0.62–0.8 | 30 |
| Histidine | 0.341 ± 0.0692 | 0.27–0.68 | 30 |
| Isoleucine | 0.548 ± 0.0393 | 0.43–0.66 | 30 |
| Leucine | 1.096 ± 0.062 | 0.96–1.24 | 30 |
| Lysine | 0.699 ± 0.1027 | 0.31–0.86 | 30 |
| Methionine | 0.409 ± 0.041 | 0.26–0.49 | 30 |
| Phenylalanine | 0.623 ± 0.046 | 0.471–0.72 | 30 |
| Threonine | 0.513 ± 0.041 | 0.43–0.61 | 30 |
| Tryptophan | 0.156 ± 0.0262 | 0.11–0.2 | 30 |
| Tyrosine | 0.423 ± 0.649 | 0.28–0.54 | 30 |
| Valine | 0.666 ± 0.039 | 0.55–0.73 | 30 |
| Essential fatty acids (% of total diet) | |||
| Linoleic | 3.94 ± 0.233 | 3.49–4.55 | 30 |
| Linolenic | 0.31 ± 0.030 | 0.21–0.368 | 30 |
| Vitamins | |||
| Vitamin A (IU/kg) | 4,225 ± 83.87 | 3,040–6,210 | 13 |
| Vitamin D (IU/kg) | 1,000a | – | – |
| α-Tocopherol (ppm) | 2,376 ± 12,602 | 13.6–69,100 | 30 |
| Thiamine (ppm)b | 13.6 ± 20.31 | 6.6–81.0 | 13 |
| Riboflavin (ppm) | 8.17 ± 2.792 | 4.2–17.5 | 30 |
| Niacin (ppm) | 79.19 ± 8.50 | 66.4–98.2 | 30 |
| Pantothenic acid (ppm) | 26.33 ± 10.87 | 17.4–81 | 30 |
| Pyridoxine (ppm)b | 9.72 ± 2.018 | 6.44–14.3 | 30 |
| Folic acid (ppm) | 1.6 ± 0.44 | 1.15–3.27 | 30 |
| Biotin (ppm) | 0.33 ± 0.10 | 0.2–0.704 | 30 |
| Vitamin B12 (ppb) | 50.06 ± 34.34 | 18.3–174 | 30 |
| Choline (as chloride) (ppm) | 2,572 ± 634 | 1,160–3,790 | 30 |
| Minerals | |||
| Calcium (%) | 0.950 ± 0.0532 | 0.863–1.02 | 13 |
| Phosphorus (%) | 0.582 ± 0.032 | 0.525–0.639 | 13 |
| Potassium (%) | 0.680 ± 0.029 | 0.626–0.733 | 30 |
| Chloride (%) | 0.391 ± 0.044 | 0.3–0.517 | 30 |
| Sodium (%) | 0.194 ± 0.0274 | 0.153–0.283 | 30 |
| Magnesium (%) | 0.217 ± 0.053 | 0.185–0.49 | 30 |
| Iron (ppm) | 190.43 ± 36.106 | 135–311 | 30 |
| Manganese (ppm) | 50.02 ± 9.27 | 21.0–73.1 | 30 |
| Zinc (ppm) | 56.81 ± 25.25 | 42.5–184.0 | 30 |
| Copper (ppm) | 7.61 ± 2.46 | 3.21–16.3 | 30 |
| Iodine (ppm) | 0.514 ± 0.217 | 0.0–0.972 | 30 |
| Chromium (ppm) | 1.119 ± 1.16 | 0.33–3.97 | 30 |
| Cobalt (ppm) | 0.219 ± 0.150 | 0.0857–0.864 | 28 |
Table B-4. Contaminant Levels in NTP-2000 Mouse Ration
| Mean ± Standard Deviation | Range | Number of Samples | |
|---|---|---|---|
| Contaminants | |||
| Arsenic (ppm) | 0.2228 ± 0.018 | 0.196–0.262 | 13 |
| Cadmium (ppm) | 0.0507 ± 0.004 | 0.045–0.058 | 13 |
| Lead (ppm) | 0.1434 ± 0.1458 | 0.06–0.621 | 13 |
| Mercury (ppm) | 0.0104 ± 0.0014 | 0.01–0.015 | 13 |
| Selenium (ppm) | 0.1871 ± 0.0318 | 0.135–0.251 | 13 |
| Aflatoxins (ppb)a | 5 | – | 13 |
| Nitrate nitrogen (ppm)b | 15.692 ± 5.813 | 9.91–27.4 | 13 |
| Nitrite nitrogen (ppm)b | 0.395 ± 0.245 | 0.12–0.63 | 13 |
| BHA (ppm)c | 1.412 ± 1.064 | 1.0–4.76 | 13 |
| BHT (ppm)a,c | 1 | – | 13 |
| Aerobic plate count (CFU/g) | 10.08 ± 3.883 | 1.0–20.0 | 13 |
| Coliform (MPN/g)a | 3 | – | 13 |
| Escherichia coli (MPN/g) | 4.615 ± 3.070 | 3.0–10.0 | 13 |
| Salmonella (MPN/g) | Negative | – | 13 |
| Total nitrosamines (ppb)d | 9.964 ± 4.071 | 0.0–14.1 | 11 |
| N-Nitrosodimethylamine (ppb)d | 2.51 ± 2.365 | 0.0–7.9 | 11 |
| N-Nitrosopyrrolidine (ppb)d | 7.455 ± 3.02 | 0.0–11.9 | 11 |
| Pesticides (ppm) | |||
| α-BHCa | <0.01 | – | 13 |
| β-BHCa | <0.02 | – | 13 |
| γ-BHCa | <0.01 | – | 13 |
| δ-BHCa | <0.01 | – | 13 |
| Heptachlora | <0.01 | – | 13 |
| Aldrina | <0.01 | – | 13 |
| Heptachlor epoxidea | <0.01 | – | 13 |
| DDEa | <0.01 | – | 13 |
| DDDa | <0.01 | – | 13 |
| DDTa | <0.01 | – | 13 |
| HCBa | <0.01 | – | 13 |
| Mirexa | <0.01 | – | 13 |
| Methoxychlora | <0.05 | – | 13 |
| Dieldrina | <0.01 | – | 13 |
| Endrina | <0.01 | – | 13 |
| Telodrina | <0.01 | – | 13 |
| Chlordanea | <0.05 | – | 13 |
| Toxaphenea | <0.10 | – | 13 |
| Estimated PCBsa | <0.20 | – | 13 |
| Ronnela | <0.01 | – | 13 |
| Ethiona | <0.02 | – | 13 |
| Trithiona | <0.05 | – | 13 |
| Diazinona | <0.10 | – | 13 |
| Methyl chlorpyrifos | 0.139 ± 0.1076 | 0.02–0.686 | 13 |
| Methyl parathiona | <0.02 | – | 13 |
| Ethyl parathiona | <0.02 | – | 13 |
| Malathion | 0.107 ± 0.155 | 0.02–0.585 | 13 |
| Endosulfan Ia | <0.01 | – | 13 |
| Endosulfan IIa | <0.01 | – | 13 |
| Endosulfan sulfatea | <0.03 | – | 13 |
Appendix C. Sentinel Animal Program
C.1.
Methods
Rodents used in the National Toxicology Program are produced in optimally clean facilities to eliminate potential pathogens that might affect study results. The Sentinel Animal Program is part of the periodic monitoring of animal health that occurs during the toxicological evaluation of test compounds. Under this program, the disease state of the rodents is monitored via sera or feces from extra (sentinel) or exposed animals in the study rooms. The sentinel animals and the study animals are subject to identical environmental conditions. Furthermore, the sentinel animals come from the same production source and weanling groups as the animals used for the studies of test compounds.
For this toxicology and carcinogenesis study, blood samples were collected from each sentinel animal and allowed to clot, and the serum was separated. All samples were processed appropriately with serology by IDEXX BioResearch (formerly Rodent Animal Diagnostic Laboratory [RADIL], University of Missouri, Columbia, MO) for determination of the presence of pathogens. Evaluation for endo- and ectoparasites was performed at the U.S. Food and Drug Administration’s National Center for Toxicological Research.
The laboratory methods and agents for which testing was performed in the sentinel animals are tabulated in Table C-1 below; the times at which samples were collected during the study are also listed.
C.2.
Results
All test results were negative.
Table C-1. Methods and Results for Sentinel Animal Testing in Male and Female Mice
| Collection Time Points | Quarantine | 3 Months | 6 Months | 9 Months | 12 Months | 15 Months | 18 Months | 21 Months | Study Termination |
|---|---|---|---|---|---|---|---|---|---|
| Number examined (males/females) | 12/12 | 2/2 | 2/2 | 2/2 | 2/2 | 2/2 | 2/2 | 2/2 | 2/2 |
| Method/test | |||||||||
| Multiplex fluorescent immunoassay (MFI) | |||||||||
| Ectromelia | − | − | − | − | − | − | − | − | − |
| Epizootic diarrhea of infant mice (EDIM) | − | − | − | − | − | − | − | − | − |
| Lymphocytic choriomeningitis virus (LCM) | − | − | − | − | − | − | − | − | − |
| Mycoplasma pulmonis | − | − | − | − | − | − | − | − | − |
| Mouse hepatitis virus (MHV) | − | − | − | − | − | − | − | − | − |
| Parvo NS-1 | − | − | − | − | − | − | − | − | − |
| Polyoma | − | − | − | − | − | − | − | − | − |
| Mouse parvovirus (MPV) | − | − | − | − | − | − | − | − | − |
| Minute virus of mice (MMV) | − | − | − | − | − | − | − | − | − |
| Pneumonia virus of mice (PVM) | − | − | − | − | − | − | − | − | − |
| Reovirus type 3 (REO3) | − | − | − | − | − | − | − | − | − |
| Sendai | − | − | − | − | − | − | − | − | − |
| Theiler’s murine encephalomyelitis virus (TMEV) | − | − | − | − | − | − | − | − | − |
| In-house evaluation | |||||||||
| Endoparasite evaluation | − | − | − | − | − | − | − | − | − |
| Ectoparasite evaluation | − | − | − | − | − | − | − | − | − |
| Polymerase chain reaction (PCR) | |||||||||
| Helicobacter hepaticus | − | − | − | − | − | − | − | − | − |
| Routine culturing | |||||||||
| Bordetella bronchiseptica | − | − | − | − | − | − | − | − | − |
| Citrobacter freundii | − | − | − | − | − | − | − | − | − |
| Corynebacterium kutscheri | − | − | − | − | − | − | − | − | − |
| Erysipelothrix rhusiopathiae | − | − | − | − | − | − | − | − | − |
| Klebsiella oxytoca | − | − | − | − | − | − | − | − | − |
| Klebsiella pneumonia | − | − | − | − | − | − | − | − | − |
| Listeria monocytogenes | − | − | − | − | − | − | − | − | − |
| Pasteurella pneumotropica | − | − | − | − | − | − | − | − | − |
| Pasteurella multocida | − | − | − | − | − | − | − | − | − |
| Pseudomonas aeruginosa | − | − | − | − | − | − | − | − | − |
| Salmonella sp. | − | − | − | − | − | − | − | − | − |
| Streptococcus pneumoniae | − | − | − | − | − | − | − | − | − |
Appendix D. Benchmark Dose Analysis
D.1.
Methods
Benchmark doses (BMD) and the lower 95% confidence limits (BMDL) were calculated using U.S. Environmental Protection Agency Benchmark Dose Software (BMDS) version 2.4.0.70 (https://www.epa.gov/bmds). The calculations were conducted using gamma, logistic, log-logistic, log-probit, multistage, probit, and Weibull models to fit the incidences of neoplasms and nonneoplastic lesions and the doses of triclosan administered dermally. The BMD10 and BMDL10 were defined as the dose that caused a 10% excess risk of the specified adverse effect over that observed in the vehicle control group and as the 95% lower bound on the BMD corresponding to a 10% extra risk, respectively.
D.2.
Results
BMD modeling was conducted on neoplasms (hepatocellular carcinoma in male mice and pancreatic islet adenoma in female mice) and nonneoplastic lesions (hyperplasia, suppurative inflammation, and ulceration of the epidermis in male mice and hyperplasia of the epidermis, pancreatic ductal dilatation, and pituitary gland angiectasis and pars distalis hyperplasia in female mice) (Table D-1). The 95% lower bound on the BMD corresponding to a 10% extra risk (BMDL10) for hepatocellular carcinoma in male mice ranged from 1.1 to 2.4 mg triclosan/kg body weight/day (mg/kg/day), whereas the BMDL10 for pancreatic islet adenoma in female mice ranged from 11.7 to 12.3 mg/kg/day. In both male and female mice, the most sensitive nonneoplastic endpoint was epidermal hyperplasia. In male mice, the BMD calculations failed when using the entire epidermal hyperplasia data set. When the calculations were repeated without the 2.7 mg/kg/day group, the BMDL10 ranged from 1.6 to 2.8 mg/kg/day; when the 5.8 mg/kg/day group was eliminated, the comparable values were 0.88–0.93 mg/kg/day. In female mice, the BMDL10 for epidermal hyperplasia ranged from 1.5 to 3.0 mg/kg/day. Higher values were obtained for epidermal suppurative inflammation (3.1–7.6 mg/kg/day) and epidermal ulceration (6.6–9.7 mg/kg/day) in male mice and for pituitary gland angiectasis (5.1–8.3 mg/kg/day) and pars distalis hyperplasia (7.0–9.2 mg/kg/day) and pancreatic duct dilatation (11.2–11.6 mg/kg/day) in female mice.
Table D-1. Benchmark Dose Modeling Results for Select Neoplasms and Nonneoplastic Lesions in Male and Female Mice in the Two-year Dermal Study of Triclosan
| Model | AIC | Fitted Modela | GOF | BMD10 | BMDL10 |
|---|---|---|---|---|---|
| Male | |||||
| Epidermis, hyperplasia | |||||
| Gammab,c | 212.0 | 0.0009 | 0.0007 | 1.321 | 0.773 |
| Logisticb,c | 214.7 | 0.0003 | 0.0002 | 2.283 | 1.910 |
| Log-logisticb,c | 214.0 | 0.0003 | 0.0003 | 1.410 | 0.910 |
| Log-probitb,c | 213.3 | 0.0004 | 0.0004 | 1.464 | 0.991 |
| Multistageb,c | 211.1 | 0.0013 | 0.0011 | 1.198 | 0.807 |
| Probitb,c | 213.7 | 0.0005 | 0.0003 | 2.149 | 1.819 |
| Weibullb,c | 211.7 | 0.0010 | 0.0008 | 1.314 | 0.796 |
| Epidermis, hyperplasia (minus the 2.7 mg/kg/day group) | |||||
| Gamma | 133.1 | 0.489 | 0.485 | 2.987 | 1.808 |
| Logistic | 131.2 | 0.755 | 0.774 | 3.171 | 2.551 |
| Log-logistic | 133.6 | 0.316 | 0.324 | 3.851 | 2.572 |
| Log-probit | 133.7 | 0.297 | 0.308 | 3.968 | 2.771 |
| Multistage | 133.2 | 0.467 | 0.467 | 2.672 | 1.551 |
| Probit | 130.9 | 0.897 | 0.903 | 2.928 | 2.365 |
| Weibull | 133.1 | 0.489 | 0.485 | 2.987 | 1.808 |
| Epidermis, hyperplasia (minus the 5.8 mg/kg/day group) | |||||
| Gammac | 140.5 | 0.025 | 0.030 | 1.100 | 0.642 |
| Logisticb,c | 150.1 | 0.0002 | 0.0003 | 2.015 | 1.602 |
| Log-logistic | 138.2 | 0.098 | 0.109 | 1.262 | 0.884 |
| Log-probit | 137.9 | 0.116 | 0.125 | 1.303 | 0.932 |
| Multistagec | 142.0 | 0.011 | 0.016 | 0.849 | 0.561 |
| Probitb,c | 149.4 | 0.0004 | 0.0004 | 1.962 | 1.608 |
| Weibullc | 141.0 | 0.018 | 0.024 | 1.001 | 0.602 |
| Epidermis, inflammation, suppurative | |||||
| Gamma | 110.0 | 0.931 | 0.900 | 6.160 | 4.236 |
| Logistic | 113.9 | 0.429 | 0.639 | 9.383 | 7.568 |
| Log-logistic | 109.9 | 0.941 | 0.920 | 6.020 | 4.005 |
| Log-probit | 111.9 | 0.857 | 0.853 | 5.708 | 3.105 |
| Multistage | 110.0 | 0.931 | 0.900 | 6.160 | 4.236 |
| Probit | 113.7 | 0.469 | 0.665 | 8.994 | 7.101 |
| Weibull | 110.0 | 0.931 | 0.900 | 6.160 | 4.236 |
| Epidermis, ulcer | |||||
| Gamma | 81.2 | 0.540 | 0.508 | 12.884 | 6.865 |
| Logistic | 81.6 | 0.472 | 0.578 | 13.086 | 9.711 |
| Log-logistic | 81.2 | 0.544 | 0.503 | 12.845 | 6.697 |
| Log-probit | 80.5 | 0.696 | 0.699 | 17.731 | 6.553 |
| Multistage | 81.2 | 0.540 | 0.507 | 12.884 | 6.865 |
| Probit | 81.5 | 0.479 | 0.572 | 13.128 | 9.360 |
| Weibull | 81.2 | 0.540 | 0.507 | 12.884 | 6.865 |
| Hepatocellular carcinoma | |||||
| Gamma | 324.3 | 0.836 | 0.836 | 2.636 | 1.591 |
| Logistic | 324.8 | 0.729 | 0.729 | 3.429 | 2.353 |
| Log-logistic | 324.0 | 0.912 | 0.912 | 2.081 | 1.101 |
| Log-probitd | 325.8 | 0.866 | 0.866 | 1.417 | 0.017 |
| Multistage | 324.3 | 0.836 | 0.836 | 2.636 | 1.591 |
| Probit | 324.8 | 0.733 | 0.732 | 3.401 | 2.335 |
| Weibull | 324.3 | 0.836 | 0.836 | 2.636 | 1.591 |
| Female | |||||
| Epidermis, hyperplasia | |||||
| Gammac | 183.6 | 0.006 | 0.030 | 4.824 | 1.366 |
| Logistic | 178.2 | 0.078 | 0.166 | 3.594 | 2.998 |
| Log-logisticc | 183.5 | 0.007 | 0.032 | 4.954 | 2.647 |
| Log-probitb,c | 186.7 | 0.002 | 0.002 | 1.928 | 1.361 |
| Multistage | 178.4 | 0.074 | 0.071 | 2.114 | 1.461 |
| Probit | 178.2 | 0.080 | 0.148 | 3.285 | 2.758 |
| Weibullc | 182.4 | 0.011 | 0.034 | 3.823 | 1.468 |
| Pancreas, duct dilatation | |||||
| Gamma | 39.0 | 0.425 | 0.389 | 13.520 | 11.446 |
| Logistic | 39.2 | 0.393 | 0.381 | 14.781 | 11.628 |
| Log-logistic | 39.2 | 0.382 | 0.487 | 20.488 | 11.195 |
| Log-probit | 39.3 | 0.370 | 0.496 | 24.011 | 11.232 |
| Multistage | 39.1 | 0.395 | 0.488 | 18.402 | 11.254 |
| Probit | 39.2 | 0.387 | 0.387 | 15.396 | 11.480 |
| Weibull | 39.0 | 0.425 | 0.389 | 12.905 | 11.424 |
| Pancreas, islets, adenoma | |||||
| Gamma | 39.0 | 0.425 | 0.389 | 13.520 | 11.752 |
| Logistic | 40.4 | 0.235 | 0.178 | 15.720 | 11.813 |
| Log-logistic | 39.0 | 0.425 | 0.389 | 12.922 | 11.833 |
| Log-probit | 41.0 | 0.248 | 0.221 | 13.190 | 11.675 |
| Multistage | 40.3 | 0.248 | 0.309 | 19.173 | 12.272 |
| Probit | 40.6 | 0.215 | 0.177 | 16.973 | 11.847 |
| Weibull | 39.0 | 0.425 | 0.389 | 12.905 | 11.859 |
| Pituitary gland, angiectasis | |||||
| Gamma | 111.3 | 0.580 | 0.593 | 12.137 | 5.991 |
| Logistic | 109.2 | 0.798 | 0.800 | 11.297 | 8.313 |
| Log-logistic | 111.3 | 0.580 | 0.592 | 12.154 | 5.811 |
| Log-probit | 111.3 | 0.580 | 0.593 | 12.106 | 5.100 |
| Multistage | 111.3 | 0.578 | 0.587 | 11.232 | 5.988 |
| Probit | 109.3 | 0.791 | 0.795 | 11.211 | 7.945 |
| Weibull | 111.3 | 0.580 | 0.592 | 12.162 | 5.991 |
| Pituitary gland, pars distalis, hyperplasia | |||||
| Gamma | 143.9 | 0.357 | 0.421 | 11.924 | 9.142 |
| Logistic | 146.0 | 0.147 | 0.247 | 11.466 | 7.567 |
| Log-logistic | 143.9 | 0.358 | 0.422 | 12.263 | 9.139 |
| Log-probit | 145.9 | 0.199 | 0.245 | 12.106 | 9.068 |
| Multistage | 145.5 | 0.185 | 0.280 | 11.841 | 7.046 |
| Probit | 146.1 | 0.141 | 0.240 | 11.623 | 7.318 |
| Weibull | 143.9 | 0.358 | 0.422 | 12.277 | 9.169 |
Appendix E. Supplemental Data
Tables with supplemental data can be found here: https://doi.org/10.22427/NTP-DATA-TR-604.27
About This Report
Foreword
The National Toxicology Program (NTP), established in 1978, is an interagency program within the Public Health Service of the U.S. Department of Health and Human Services. Its activities are executed through a partnership of the National Institute for Occupational Safety and Health (part of the Centers for Disease Control and Prevention), the Food and Drug Administration (primarily at the National Center for Toxicological Research), and the National Institute of Environmental Health Sciences (part of the National Institutes of Health), where the program is administratively located. NTP offers a unique venue for the testing, research, and analysis of agents of concern to identify toxic and biological effects, provide information that strengthens the science base, and inform decisions by health regulatory and research agencies to safeguard public health. NTP also works to develop and apply new and improved methods and approaches that advance toxicology and better assess health effects from environmental exposures.
The Technical Report series began in 1976 with carcinogenesis studies conducted by the National Cancer Institute. In 1981, this bioassay program was transferred to NTP. The studies described in the NTP Technical Report series are designed and conducted to characterize and evaluate the toxicological potential, including carcinogenic activity, of selected substances in laboratory animals (usually two species, rats and mice). Substances (e.g., chemicals, physical agents, and mixtures) selected for NTP toxicity and carcinogenicity studies are chosen primarily on the basis of human exposure, level of commercial production, and chemical structure. The interpretive conclusions presented in NTP Technical Reports are derived solely from the results of these NTP studies, and extrapolation of the results to other species, including characterization of hazards and risks to humans, requires analyses beyond the intent of these reports. Selection for study per se is not an indicator of a substance’s carcinogenic potential.
NTP conducts its studies in compliance with its laboratory health and safety guidelines and the Food and Drug Administration Good Laboratory Practice Regulations and meets or exceeds all applicable federal, state, and local health and safety regulations. Animal care and use are in accordance with the Public Health Service Policy on Humane Care and Use of Laboratory Animals. Studies are subjected to retrospective quality assurance audits before they are presented for public review. Draft reports undergo external peer review before they are finalized and published.
NTP Technical Reports are available free of charge on the NTP website and cataloged in PubMed, a free resource developed and maintained by the National Library of Medicine (part of the National Institutes of Health). Data for these studies are included in NTP’s Chemical Effects in Biological Systems database.
For questions about the reports and studies, please email NTP or call 984-287-3211.
Collaborators
National Center for Toxicological Research, U.S. Food and Drug Administration, Jefferson, Arkansas, USA
Conducted study, evaluated and interpreted results and pathology findings, reported findings, and prepared the study report
J.L. Fang, Ph.D., Study Scientist
F.A. Beland, Ph.D., Co-investigator
G.R. Olson, D.V.M., Ph.D., Study Pathologist
M.M. Vanlandingham, A.S., Study Coordinator
Conducted prestart chemistry activities, dose formulations, and biological sample chemistry analyses
M.S. Bryant, Ph.D., Principal Investigator
M. Chidambaram, Ph.D.
P. Chitranshi, Ph.D.
G. Gamboa da Costa, Ph.D.
L. Loulotková, Ph.D.
A. Matson, B.S.
Conducted statistical analyses
R.P. Felton, M.S., Principal Investigator
B.E. Juliar, M.A., M.S.
P.M. Maisha, M.S.
B.T. Thorn, M.S.
Conducted quality assurance audits
J.M. Fowler, B.S.
Division of Translational Toxicology, National Institute of Environmental Health Sciences, Research Triangle Park, North Carolina, USA
Reviewed and evaluated the technical report and interpreted results and pathology findings
C.R. Blystone, Ph.D.
M.F. Cesta, D.V.M., Ph.D.
H.C. Cunny, Ph.D.
G.K. Roberts, Ph.D.
K.A. Shipkowski, Ph.D.
K.R. Shockley, Ph.D.
V.L. Sutherland, Ph.D.
S. Waidyanatha, Ph.D.
N.J. Walker, Ph.D.
Provided oversight for data management
J.M. Fostel, Ph.D.
Experimental Pathology Laboratories, Inc., Research Triangle Park, North Carolina, USA
Provided pathology review
K.Y. Cimon, D.V.M., M.S.
R.A. Miller, D.V.M., Ph.D.
E.M. Quist, D.V.M., Ph.D.
T.J. Steinbach, D.V.M.
Coordinated Pathology Working Group on 2-year mice (March 21, 2017)
T.J. Steinbach, D.V.M.
ICF, Reston, Virginia, USA
Conducted technical writing and data integration and ensured report quality
L.M. Prince, Ph.D.
Contributors
Division of Translational Toxicology, National Institute of Environmental Health Sciences, Research Triangle Park, North Carolina, USA
Provided oversight of external peer review
M.L. Brownlow, Ph.D.
M.S. Wolfe, Ph.D.
Kelly Government Solutions, Research Triangle Park, North Carolina, USA
Supported external peer review
E.A. Maull, Ph.D.
Pathology Working Group, National Institute of Environmental Health Sciences, Research Triangle Park, North Carolina, USA
Participated in Pathology Working Group on 2-year mice (March 21, 2017)
C. Brayton, D.V.M., Ph.D., Independent Consultant
K.J. Davis, D.V.M., National Center for Toxicological Research
S.A. Elmore, D.V.M., M.S., National Institute of Environmental Health Sciences
D.E. Malarkey, D.V.M., Ph.D., National Institute of Environmental Health Sciences
S.R. Mog, D.V.M., U.S. Food and Drug Administration
G.R. Olson, D.V.M., Ph.D., National Center for Toxicological Research
E.M. Quist, D.V.M., Ph.D., Experimental Pathology Laboratories, Inc.
Experimental Pathology Laboratories, Inc., Research Triangle Park, North Carolina, USA
Supervised pathology review
G.A. Willson, B.V.M.S., Principal Investigator
ASRC Federal, Research Triangle Park, North Carolina, USA
Prepared data for report
P. Brown, B.S.
H. Gong, M.S.
C. Martini, B.S.
C. Myers, M.S.
N. Sayers, B.S.
M. Shaw, B.S.
R. Whittlesey, M.S.
CSS Corporation, Research Triangle Park, North Carolina, USA
Prepared quality assessment audits
S. Brecher, Ph.D., Principal Investigator
S. Iyer, B.S.
V.S. Tharakan, D.V.M.
Social & Scientific Systems, a DLH Company, Research Triangle Park, North Carolina, USA
Provided statistical analyses
S.J. McBride, Ph.D., Principal Investigator
L.J. Betz, M.S.
S.F. Harris, M.S.
ICF, Reston, Virginia, USA
Provided contract oversight
D. Burch, M.E.M., Principal Investigator
J.A. Wignall, M.S.P.H.
Prepared and edited report
K.S. Duke, Ph.D.
H.J. Eglinton, B.S.
S.R Gunnels, M.A.
T. Hamilton, M.S.
C. Haver, M.P.H.
K. O’Donovan, B.A.
S.J. Snow, Ph.D.
Supported external peer review
L.M. Green, M.P.H.
A.P. Shirzadi, M.P.H.
Explanation of Levels of Evidence of Carcinogenic Activity
The National Toxicology Program (NTP) describes the results of individual experiments on a chemical agent and notes the strength of the evidence for conclusions regarding each study. Negative results, in which the study animals do not have a greater incidence of neoplasia than control animals, do not necessarily mean that a chemical is not a carcinogen, in as much as the experiments are conducted under a limited set of conditions. Positive results demonstrate that a chemical is carcinogenic for laboratory animals under the conditions of the study and indicate that exposure to the chemical has the potential for hazard to humans. Other organizations, such as the International Agency for Research on Cancer, assign a strength of evidence for conclusions based on an examination of all available evidence, including animal studies such as those conducted by NTP, epidemiologic studies, and estimates of exposure. Thus, the actual determination of risk to humans from chemicals found to be carcinogenic in laboratory animals requires a wider analysis that extends beyond the purview of these studies.
Five categories of evidence of carcinogenic activity are used in the Technical Report series to summarize the strength of evidence observed in each experiment: two categories for positive results (clear evidence and some evidence); one category for uncertain findings (equivocal evidence); one category for no observable effects (no evidence); and one category for experiments that cannot be evaluated because of major flaws (inadequate study). These categories of interpretative conclusions were first adopted in June 1983 and then revised in March 1986 for use in the Technical Report series to incorporate more specifically the concept of actual weight of evidence of carcinogenic activity. For each separate experiment (male rats, female rats, male mice, female mice), one of the following five categories is selected to describe the findings. These categories refer to the strength of the experimental evidence and not to potency or mechanism.
Clear evidence of carcinogenic activity is demonstrated by studies that are interpreted as showing a dose-related (i) increase of malignant neoplasms, (ii) increase of a combination of malignant and benign neoplasms, or (iii) marked increase of benign neoplasms if there is an indication from this or other studies of the ability of such tumors to progress to malignancy.
Some evidence of carcinogenic activity is demonstrated by studies that are interpreted as showing a chemical-related increased incidence of neoplasms (malignant, benign, or combined) in which the strength of the response is less than that required for clear evidence.
Equivocal evidence of carcinogenic activity is demonstrated by studies that are interpreted as showing a marginal increase of neoplasms that may be chemical related.
No evidence of carcinogenic activity is demonstrated by studies that are interpreted as showing no chemical-related increases in malignant or benign neoplasms.
Inadequate study of carcinogenic activity is demonstrated by studies that, because of major qualitative or quantitative limitations, cannot be interpreted as valid for showing either the presence or absence of carcinogenic activity.
For studies showing multiple chemical-related neoplastic effects that if considered individually would be assigned to different levels of evidence categories, the following convention has been adopted to convey completely the study results. In a study with clear evidence of carcinogenic activity at some tissue sites, other responses that alone might be deemed some evidence are indicated as “were also related” to chemical exposure. In studies with clear or some evidence of carcinogenic activity, other responses that alone might be termed equivocal evidence are indicated as “may have been” related to chemical exposure.
When a conclusion statement for a particular experiment is selected, consideration must be given to key factors that would extend the actual boundary of an individual category of evidence. Such consideration should allow for incorporation of scientific experience and current understanding of long-term carcinogenesis studies in laboratory animals, especially for those evaluations that may be on the borderline between two adjacent levels. These considerations should include:
adequacy of the experimental design and conduct;
occurrence of common versus uncommon neoplasia;
progression (or lack thereof) from benign to malignant neoplasia as well as from preneoplastic to neoplastic lesions;
some benign neoplasms have the capacity to regress but others (of the same morphologic type) progress. At present, it is impossible to identify the difference. Therefore, where progression is known to be a possibility, the most prudent course is to assume that benign neoplasms of those types have the potential to become malignant;
combining benign and malignant tumor incidence known or thought to represent stages of progression in the same organ or tissue;
latency in tumor induction;
multiplicity in site-specific neoplasia;
metastases;
supporting information from proliferative lesions (hyperplasia) in the same site of neoplasia or other experiments (same lesion in another sex or species);
presence or absence of dose relationships;
statistical significance of the observed tumor increase;
concurrent control tumor incidence as well as the historical control rate and variability for a specific neoplasm;
survival-adjusted analyses and false positive or false negative concerns;
structure-activity correlations; and
in some cases, genetic toxicology.
Peer Review
The National Toxicology Program (NTP) conducted a peer review of the draft NTP Technical Report on the Toxicology and Carcinogenesis Study of Triclosan (CASRN 3380-34-5) Administered Dermally to B6C3F1/N Mice by letter in November 2022 by the experts listed below. Reviewer selection and document review followed established NTP practices. The reviewers were charged to:
Peer review the draft NTP Technical Report on the Toxicology and Carcinogenesis Study of Triclosan (CASRN 3380-34-5) Administered Dermally to B6C3F1/N Mice.
Comment on NTP’s conclusions and interpretations of the data.
NTP carefully considered reviewer comments in finalizing this report.
Peer Reviewers
Lydia Andrews-Jones, D.V.M., Ph.D., DACVP
Director, Pathology
AbbVie, Irvine, California, USA
Emanuela Corsini, Ph.D.
Full Professor
Università degli Studi di Milano, Milan, Italy
James Klaunig, Ph.D.
Professor Emeritus
Indiana University, Bloomington, Indiana, USA
Publication Details
Publisher: National Toxicology Program
Publishing Location: Research Triangle Park, NC
ISSN: 2378-8925
DOI: https://doi.org/10.22427/NTP-TR-604
Report Series: NTP Technical Report Series
Report Series Number: 604
Official citation: National Toxicology Program (NTP). 2024. NTP technical report on the toxicology and carcinogenesis study of triclosan (CASRN 3380-34-5) administered dermally to B6C3F1/N mice. Research Triangle Park, NC: National Toxicology Program. Technical Report 604.
Acknowledgments
This study was conducted at the U.S. Food and Drug Administration’s (FDA’s) National Center for Toxicological Research under an Interagency Agreement between FDA and the National Institute of Environmental Health Sciences (NIEHS) (AES17011).This work was supported by the Intramural Research Program (ES103376, ES103377, ES103379, and ES103380) at NIEHS, National Institutes of Health and performed for the National Toxicology Program, Public Health Service, U.S. Department of Health and Human Services under contracts HHSN271201800012I, HHSN273201600020C, GS00Q14OADU417 (Order No. HHSN273201600015U), HHSN273201600011C, HHSN273201500014C, HHSN273201500006C, and HHSN316201200054W.