

Hematopoietic System
Bone Marrow - Hypocellularity
Narrative
Changes in bone marrow cellularity may involve all or individual cell lines. Changes in the erythroid or myeloid cell lines may shift the M:E ratio relative to controls. Normal M:E ratios of rats and mice are reported between 0.80 and 2.79, with an average of 1.5, and are dependent on strain and age, stressing the importance of comparing treated animals with concurrent controls. Histologic sections allow for a rough estimate of the M:E ratio to aid in the evaluation of cellularity, while cytologic preparations are needed for a more precise determination of the M:E ratio and evaluation of subtle changes in synchrony of maturation.
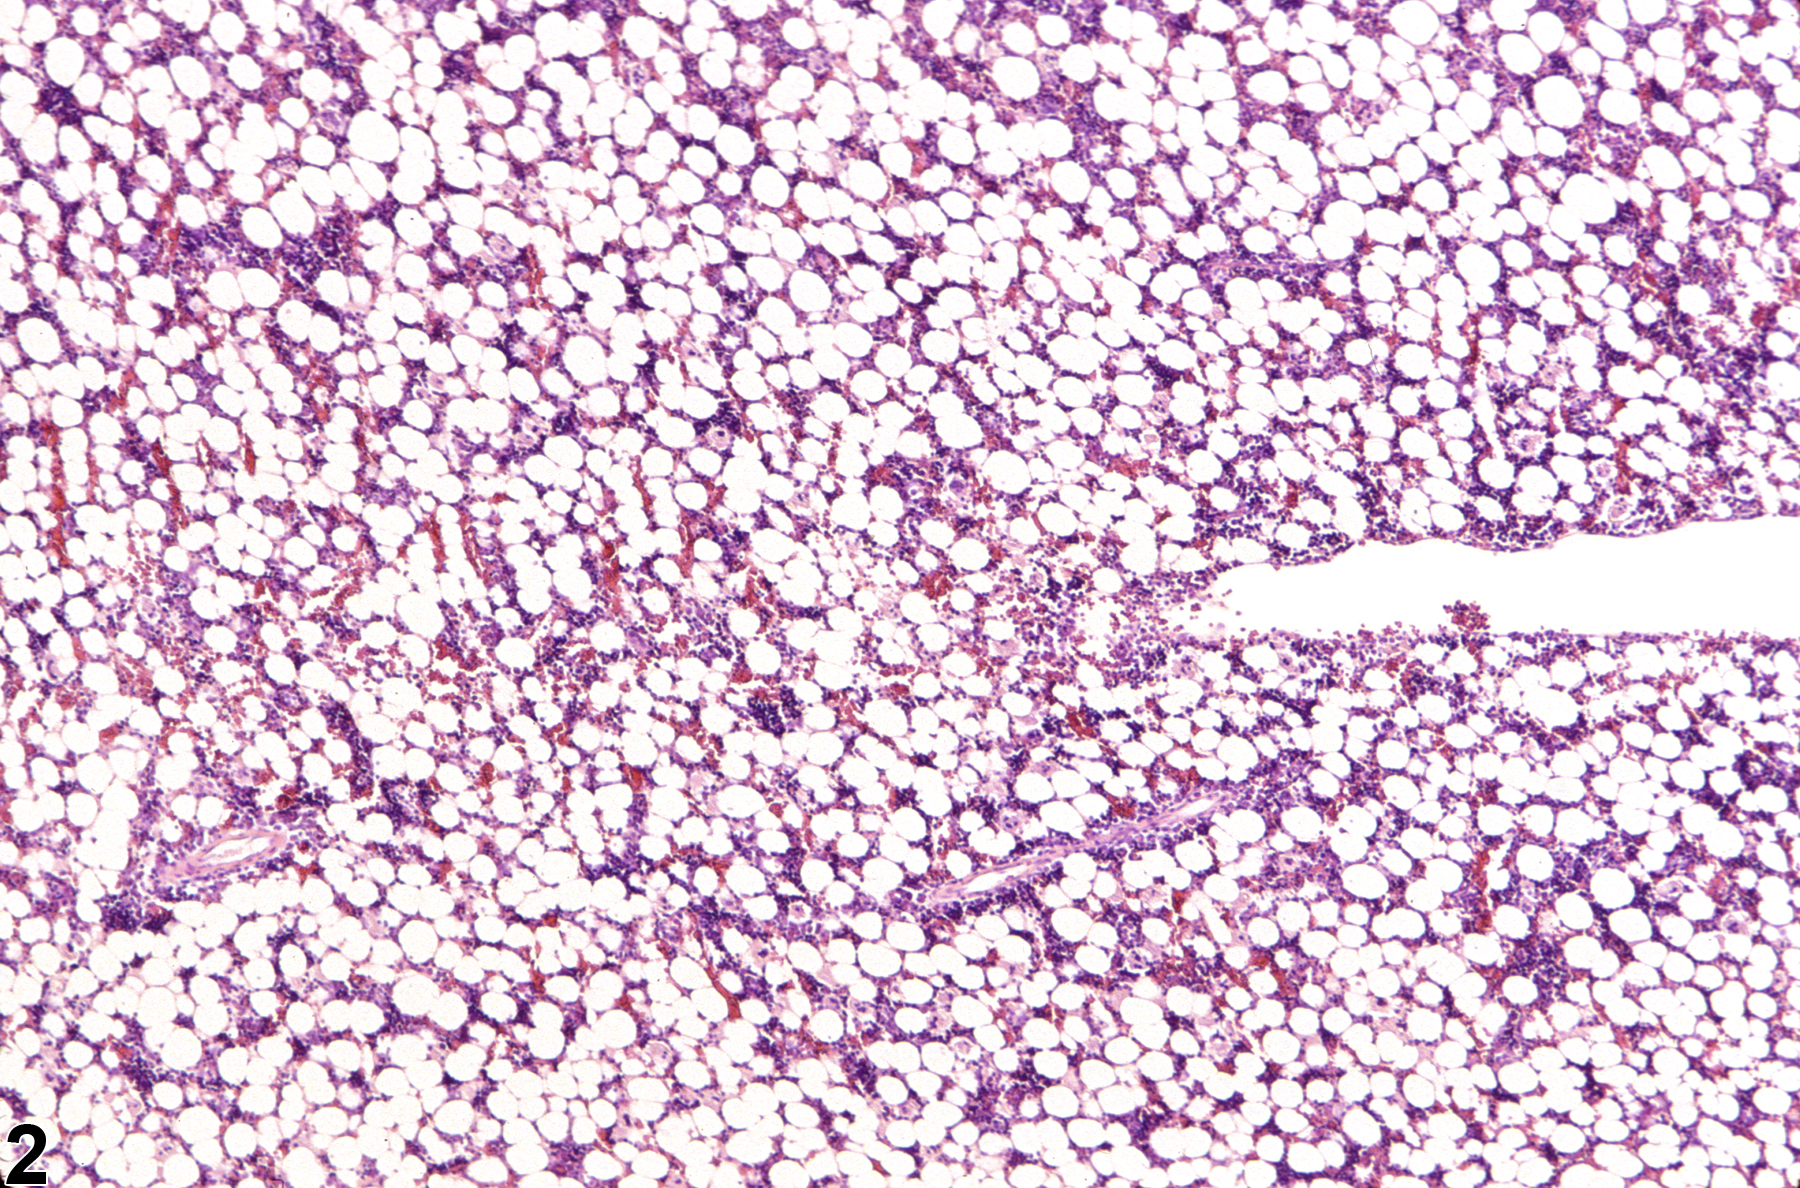
Hypocellularity of the bone marrow is recorded in treated animals when there is a decrease in hematopoietic cells relative to adipocytes compared with concurrent controls (Figure 2, Figure 4, Figure 5, and Figure 6). Hypocellularity may occur as a direct or indirect treatment-related effect, of which numerous examples exist but in general include xenobiotics that affect hemoglobin production, alter rates of hematopoiesis, disrupt porphyrin metabolism (e.g., lead), alter cytokine networks, or induce direct cellular injury (e.g., chemotherapeutics, certain antimicrobials), as well as such conditions as chronic inflammation or chronic renal failure (i.e., reduced renal erythropoietin production). In severe cases (e.g., aplasia), the marrow will appear devoid of hematopoietic cell lines and consist primarily of adipose tissue and vascular sinuses. Low numbers of scattered lymphocytes, macrophages, and plasma cells may also be observed, depending on the pathogenesis or mechanism of action of the xenobiotic or treatment (e.g., radiation).
Occasionally, relatively well-delineated focal areas of hypocellularity (previously known as “focal atrophy”) have been seen. These areas may contain variable numbers of adipocytes and/or a relative increase in reticular stromata. This finding has been described in young adult rats, with an apparent higher rate among females. These areas alone seemingly have no clinical significance. Focal areas of hypocellularity may be part of, or result in (if numerous areas exist), an overall decrease in bone marrow cellularity. Such observations should be included with, or diagnosed as, hypocellularity rather than recorded as a separate distinct finding of “focal” hypocellularity.
Diet restriction and severe inappetence are known to cause decreases in all hematopoietic cells with an apparent increase in marrow fat cells; the M:E ratio seems unaffected. Specifically, in one study, diet restriction sufficient to stop weight gain in young rats caused 50%, 40%, and 20% decreases in erythroid, myeloid, and megakaryocytic precursors, respectively.
Clinical, interpretative, or diagnostic terms (e.g., “atrophy,” “hypoplasia”) should not be used when recording changes in bone marrow cellularity but rather the descriptive term “hypocellularity” as discussed herein. When changes in cellularity warrant further explanation or are treatment related, they should be described and interpreted in the pathology narrative, where interpretive terms or diagnoses, such as aplastic anemia, can be used in context with other histologic findings, available hematologic data, in-life findings, and bone marrow cytologic (e.g., M:E ratio) or flow cytometric findings.
Brown J. 1954. A quantitative study of cellular changes in the bone marrow following protein deficiency in the rat. Ant Rec 120:515-533.
Abstract: http://www.ncbi.nlm.nih.gov/pubmed/13207787Cline MJ, Maronpot RR. 1985. Variations in the histological distributions of rat bone marrow cells with respect to age and anatomic site. Toxicol Pathol 13:349-355.
Abstract: http://www.ncbi.nlm.nih.gov/pubmed/2422724Evans GO. 2009. Animal Hematotoxicology: A Practical Guide for Toxicologists and Biomedical Researchers. Taylor and Francis, Boca Raton, FL, 23-42.
Abstract: http://www.crcpress.com/product/isbn/9781420080094Levin S, Semler D, Ruben Z. 1993. Effects of two weeks of feed restriction on some common toxicologic parameters in Sprague-Dawley rats. Toxicol Pathol 21:1-14.
Abstract: http://www.ncbi.nlm.nih.gov/pubmed/8378702MacKenzie WF, Eustis SL. 1990. Bone marrow. In: Pathology of the Fischer Rat: Reference and Atlas (Boorman GA, Eustis SL, Elwell MR, Montgomery CA, Mackenzie WF, eds). Academic Press, San Diego, 315-337.
Abstract: http://www.ncbi.nlm.nih.gov/nlmcatalog/9002563Martin RA, Brott DA, Zandee JC, McKeel MJ. 1992. Differential analysis of animal bone marrow by flow cytometry. Cytometry 13:638-643.
Abstract: http://www.ncbi.nlm.nih.gov/pubmed/1451595O’Rourke LG. 2010. Preclinical evaluation of compound-related cytopenias. In: Schalm’s Veterinary Hematology, 5th ed (Weiss DJ, Wardrop KJ, eds). Wiley-Blackwell, Ames, IA, 85-91.
Abstract: http://vet.sagepub.com/content/40/2/223.1Provencher-Bolliger A. 2004. Cytological evaluation of bone marrow in rats: Indications, methods and normal morphology. Vet Clin Pathol 33:58-67.
Abstract: http://www.ncbi.nlm.nih.gov/pubmed/15195264Provencher-Bolliger A, Everds NE, Zimmerman KL, Moore DM, Smith SA, Barnhart KF. 2010. Hematology of laboratory animals. In: Schalm’s Veterinary Hematology, 5th ed (Weiss DJ, Wardrop KJ, eds). Wiley-Blackwell, Ames, IA, 852-887.
Abstract: http://vet.sagepub.com/content/40/2/223.1Regan WJ, Irizarry-Rovira A, Poitout-Belissent F, Bollinger AP, Ramaiah SK, Travlos G, Walker D, Bounous D, Walter G. 2011. Best practices for evaluation of bone marrow in nonclinical toxicity studies. Toxicol Pathol 39:435-448.
Abstract: http://www.ncbi.nlm.nih.gov/pubmed/21300792Saad A, Palm M, Widell S, Reiland S. 2000. Differential analysis of rat bone marrow by flow cytometry. Comp Haemat Int 10:97-101.
Abstract: http://link.springer.com/article/10.1007%2Fs005800070016Travlos GS. 2006. Histopathology of the bone marrow. Toxicol Pathol 34:566-598.
Abstract: http://tpx.sagepub.com/content/34/5/566.abstractWeiss DJ. 2010. Drug-induced blood cell disorders. In: Schalm’s Veterinary Hematology, 5th ed (Weiss DJ, Wardrop KJ, eds). Wiley-Blackwell, Ames, IA, 98-105.
Abstract: http://vet.sagepub.com/content/40/2/223.1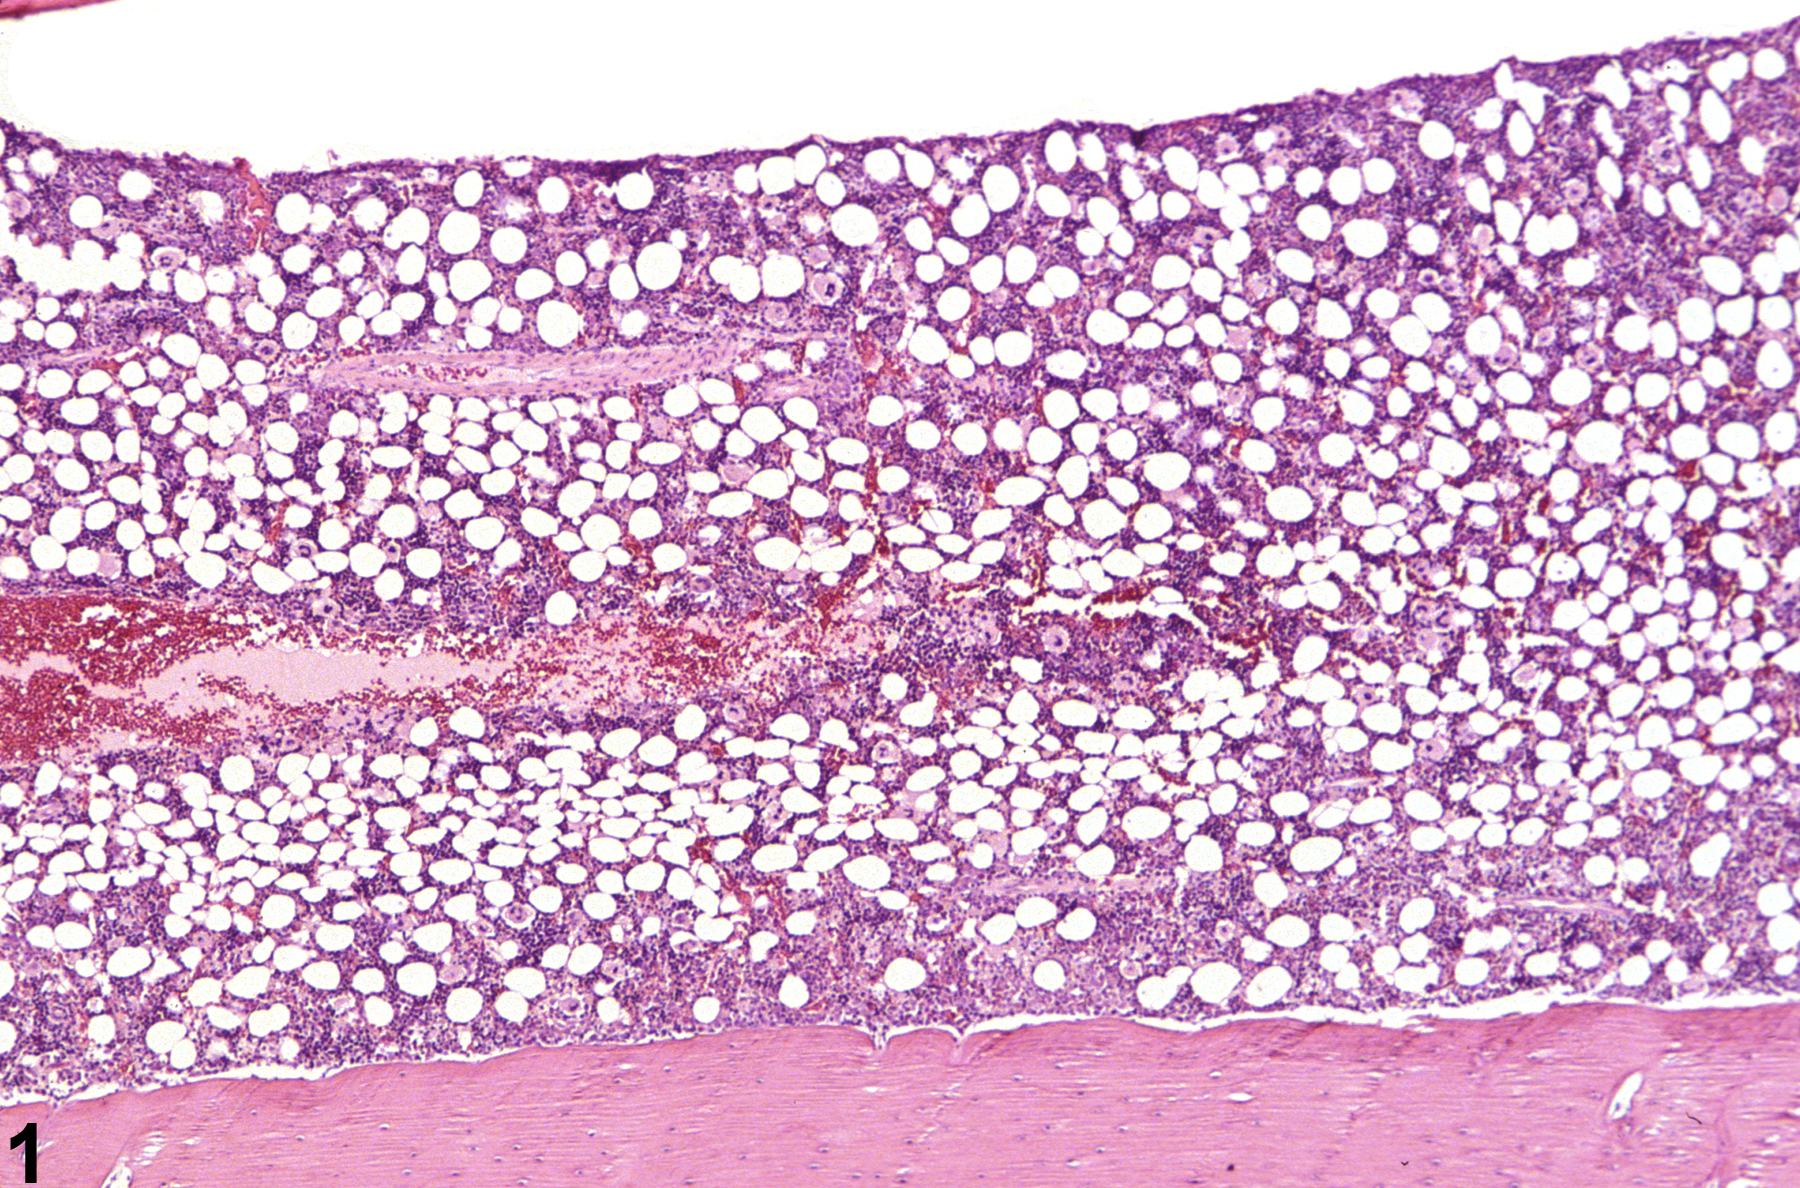
Bone marrow in a control female F344/N rat from a subchronic study.
All Images

Bone marrow in a control female F344/N rat from a subchronic study.

Bone marrow in a treated female F344/N rat from a subchronic study. Compared with concurrent control (Figure 1), there is mild hypocellularity.
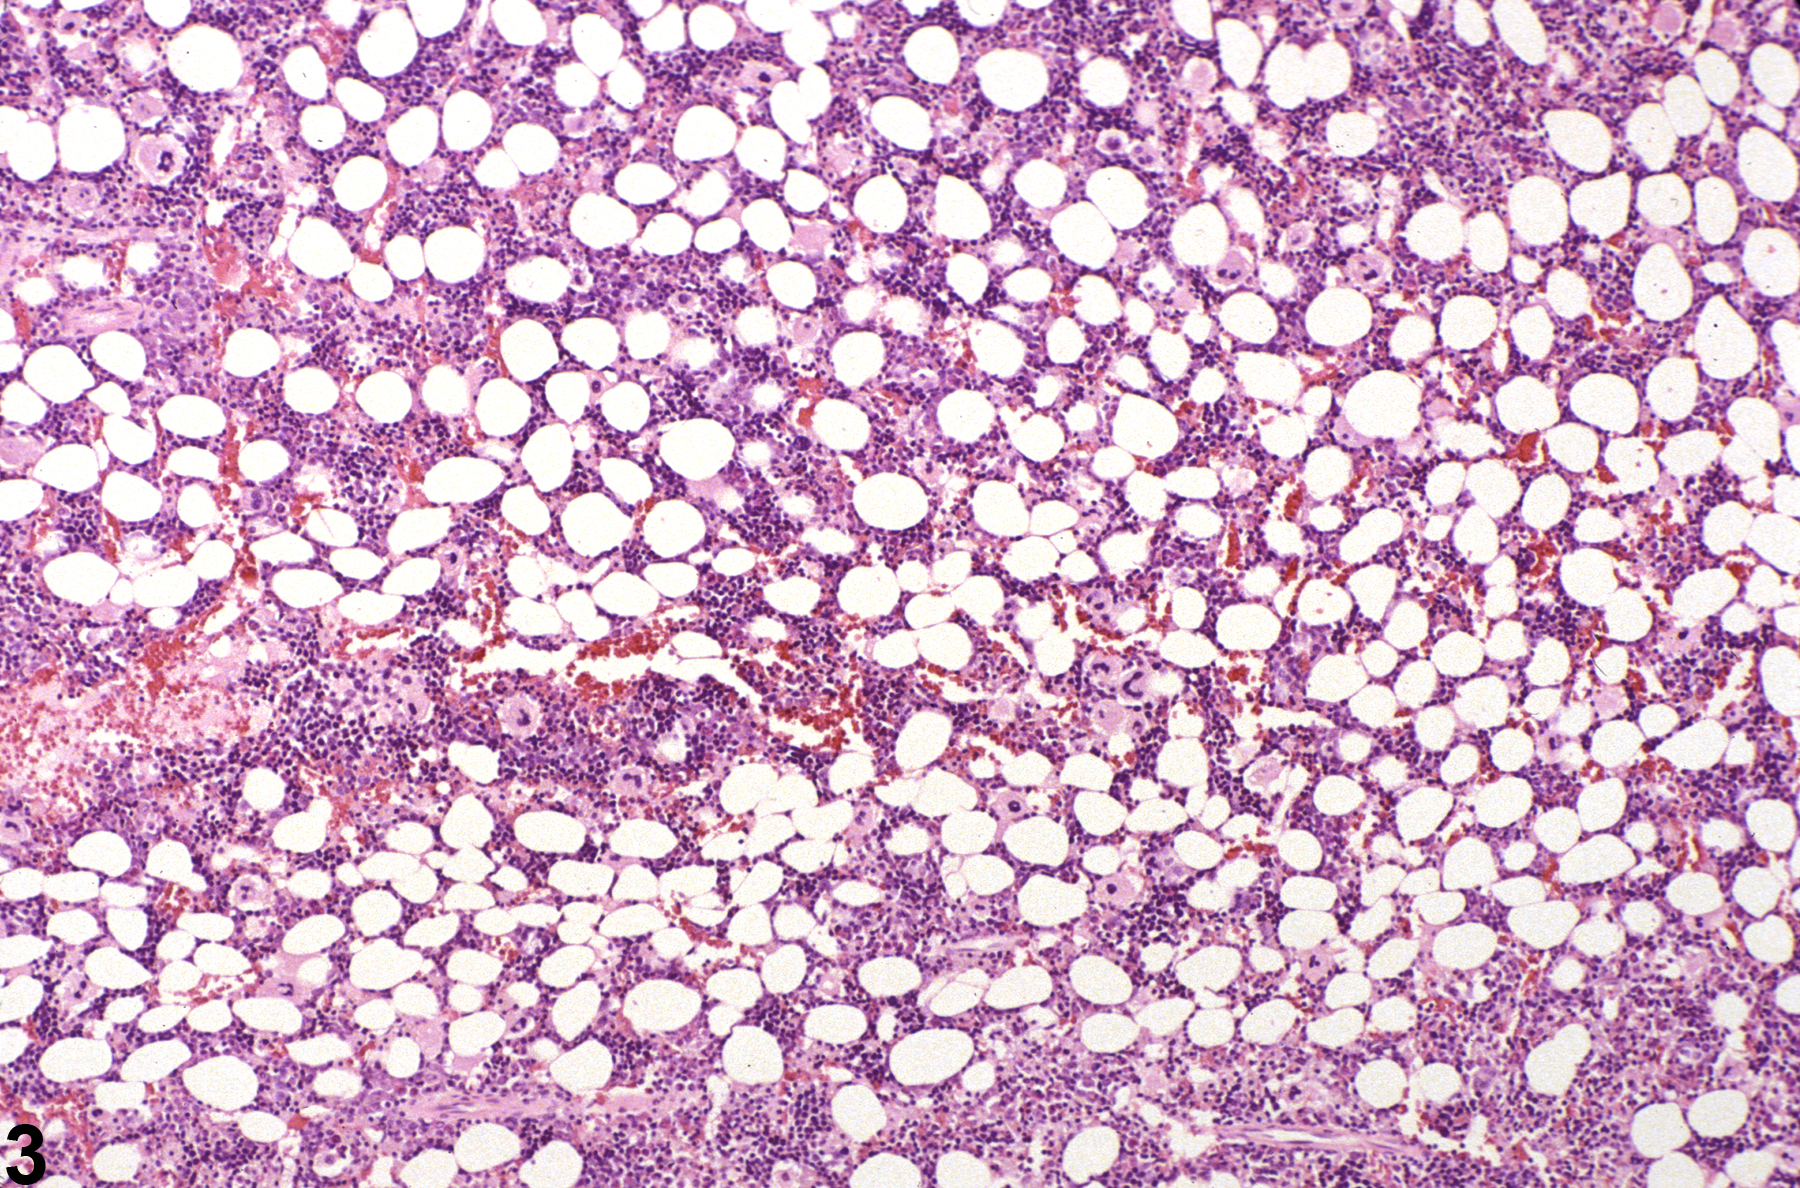
Bone marrow in a control female F344/N rat from a subchronic study (higher magnification of Figure 1).

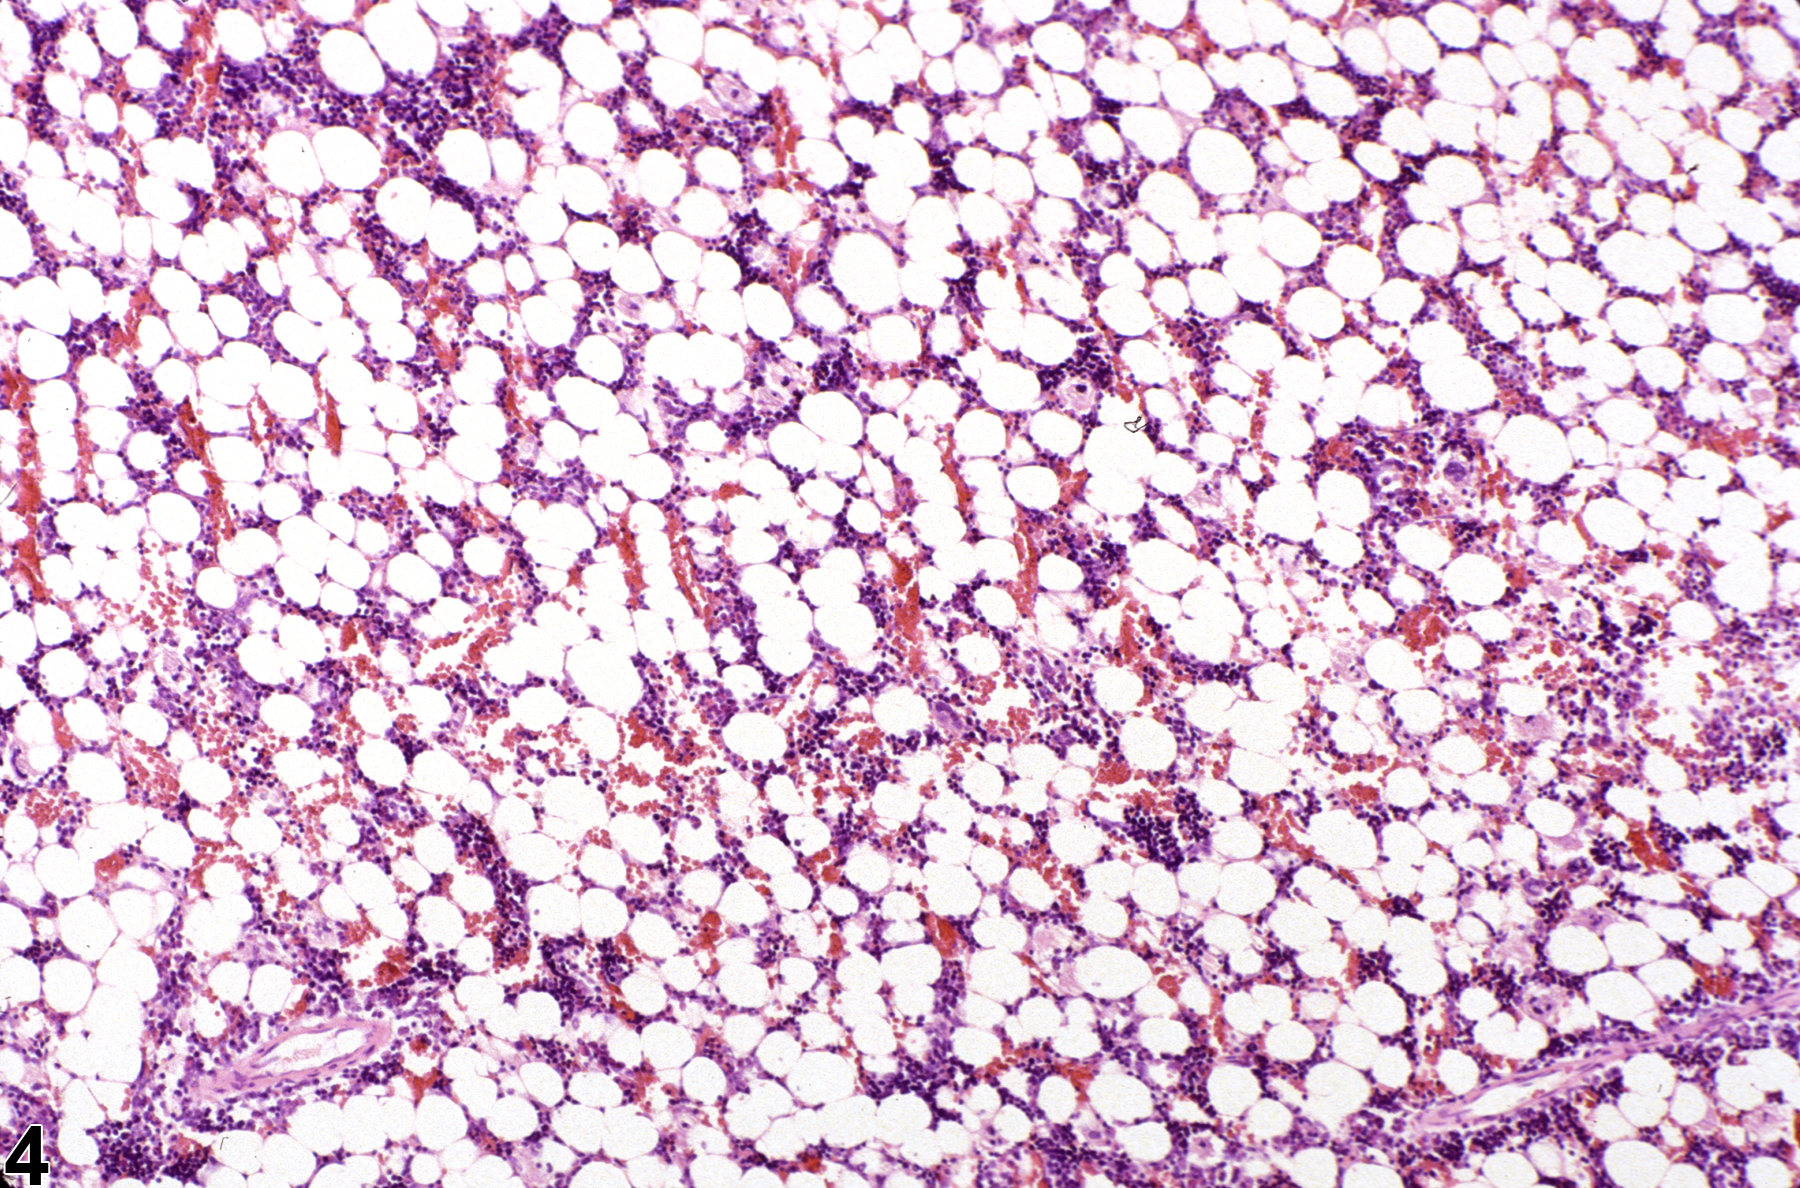
Bone marrow in a treated female F344/N rat from a subchronic study (higher magnification of Figure 2). Compared with concurrent control (Figure 3), there is mild bone marrow hypocellularity.

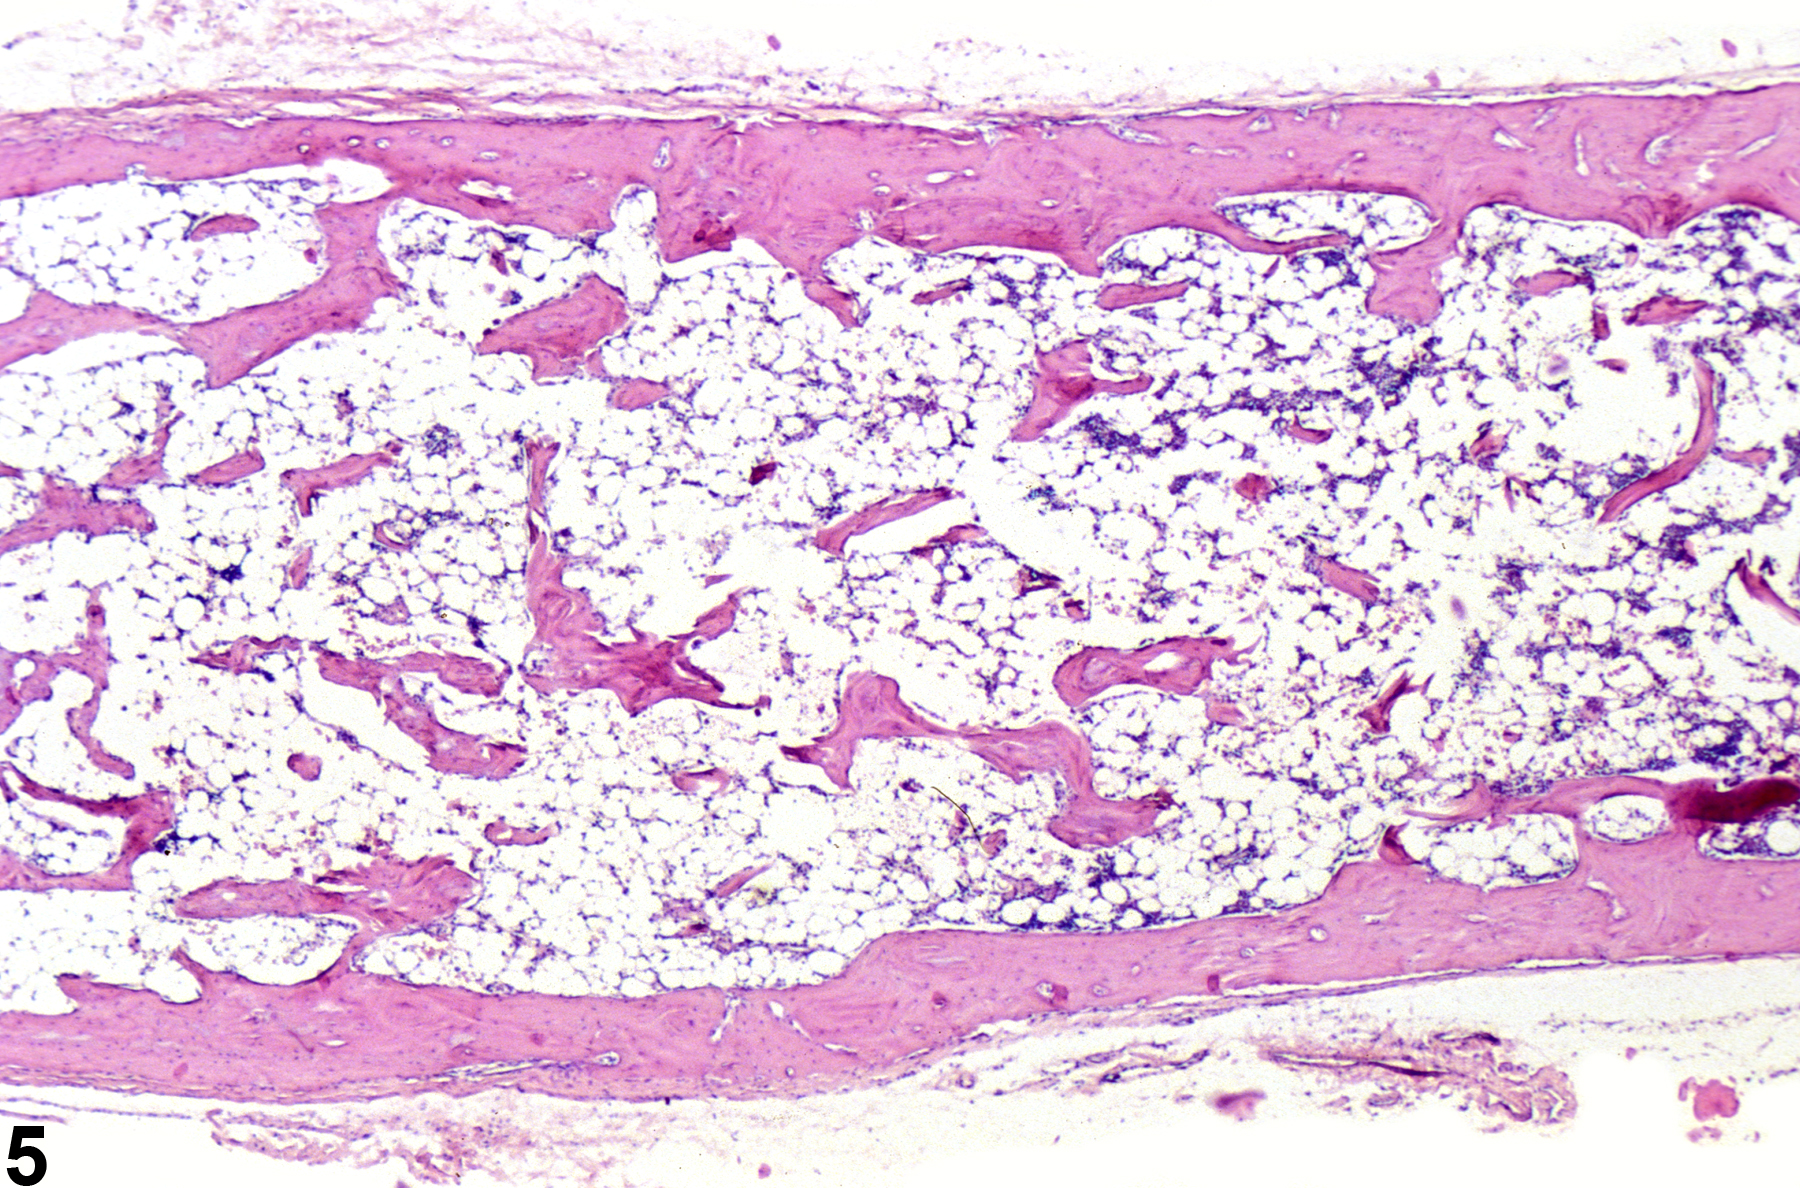
Severely hypocellular bone marrow in a male B6C3F1 mouse from a subchronic study. The marrow space is largely devoid of hematopoietic cells and consists primarily of adipose tissue and vascular sinuses due to treatment-induced aplastic anemia.

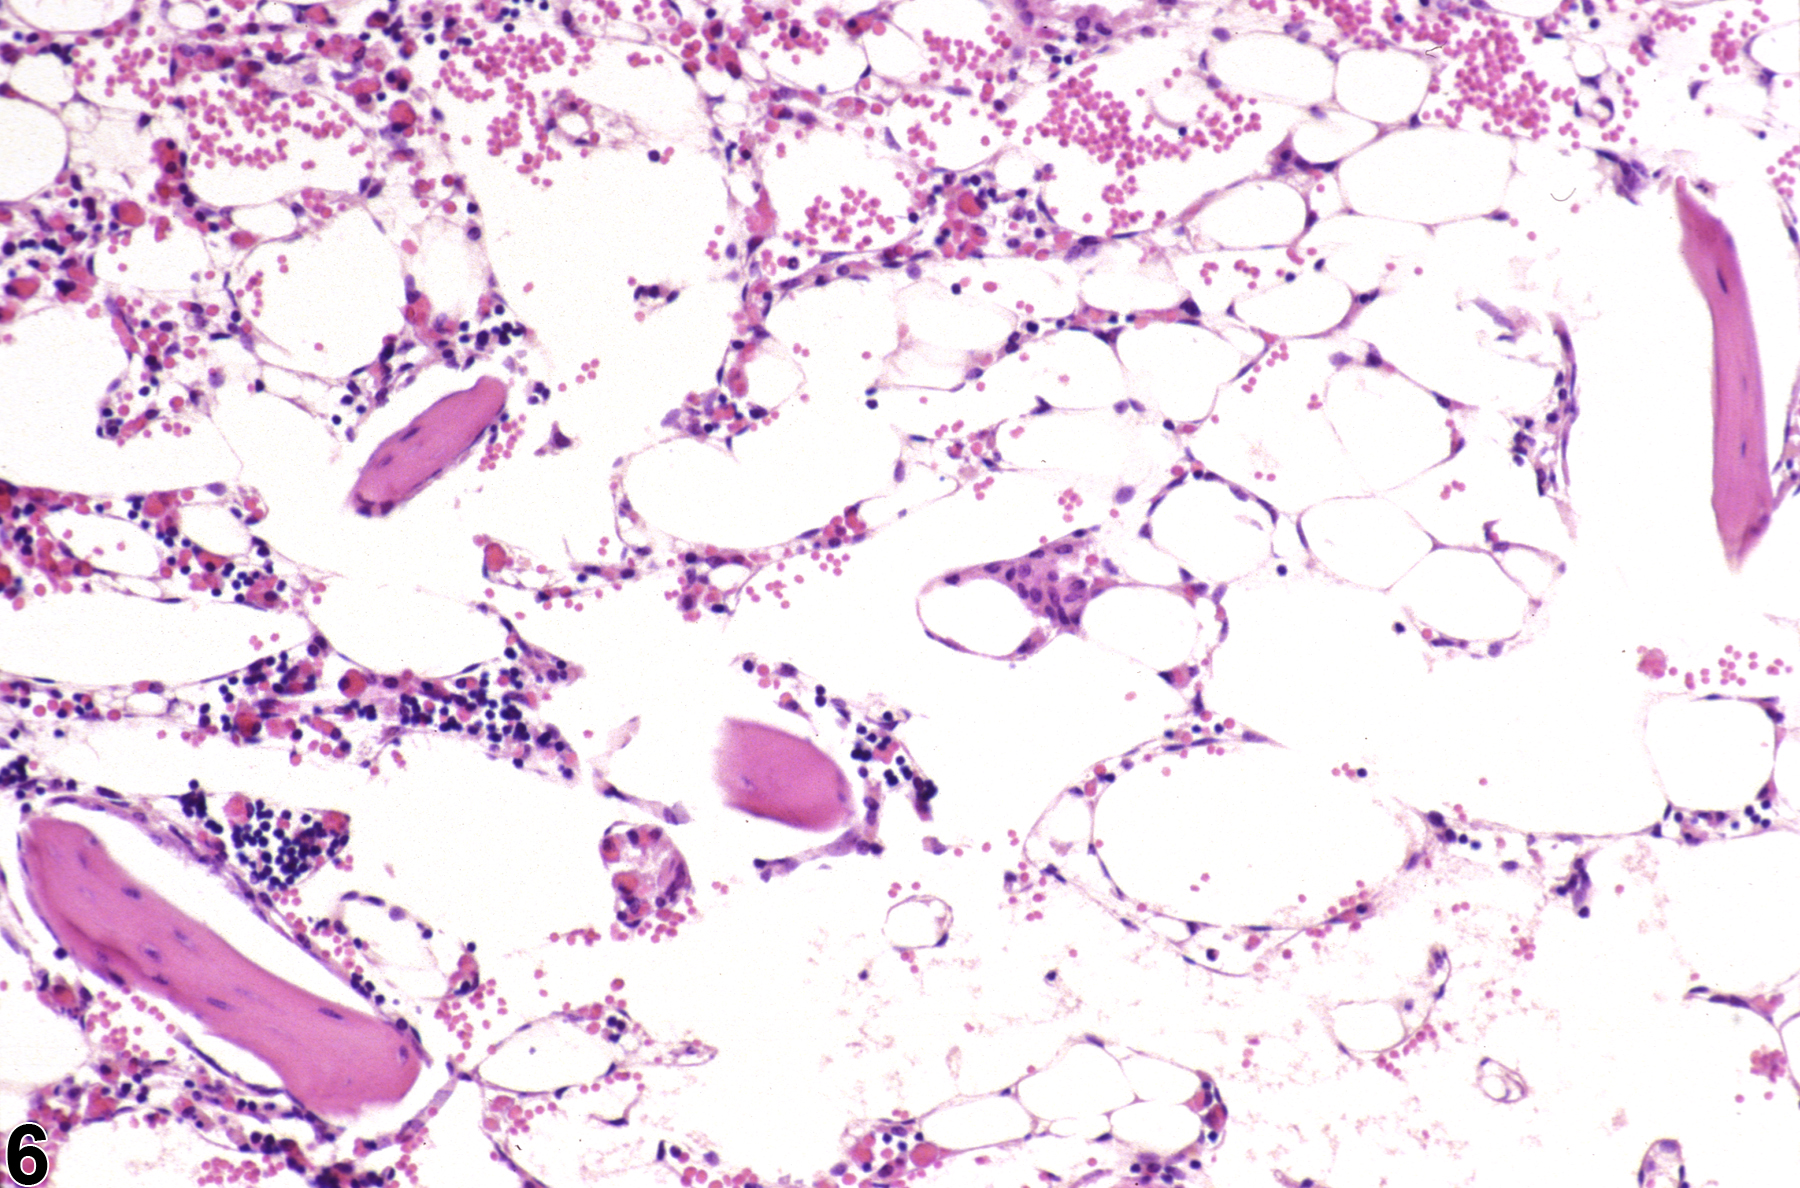
Severely hypocellular bone marrow in a male B6C3F1 mouse from a subchronic study (higher magnification of Figure 5). The marrow space is largely devoid of hematopoietic cells and consists primarily of adipose tissue and vascular sinuses due to treatment-induced aplastic anemia.