

Immune System
Thymus - Atrophy
Narrative
Elmore SA. 2006. Enhanced histopathology of the thymus. Toxicol Pathol 34:656-665.
Full Text: https://www.ncbi.nlm.nih.gov/pmc/articles/PMC1800589/National Toxicology Program. 2006. NTP TR-521. Toxicology and Carcinogenesis Studies of 2,3,7,8-Tetrachlorodibenzo-p-Dioxin (TCDD) (CAS No. 1746-01-6) in Female Harlan Sprague-Dawley Rats (Gavage Studies). NTP, Research Triangle Park, NC.
Abstract: https://ntp.niehs.nih.gov/go/9303National Toxicology Program. 2007. Toxicology Studies of Sodium Bromate (CAS No. 7789-38-0) in Genetically Modified (FVB Tg.AC Hemizygous) Mice (Dermal and Drinking Water Studies) and Carcinogenicity Studies of Sodium Bromate in Genetically Modified [B6.129-Trp53tm1Brd (N5) Haploinsufficient] Mice (Drinking Water Studies). NTP, Research Triangle Park, NC.
Abstract: https://www.ncbi.nlm.nih.gov/pubmed/18784759National Toxicology Program. 2010. NTP TR-557. Toxicology and Carcinogenesis Studies of β-Myrcene (CAS No. 123-35-3) in F344/N Rats and B6C3F1 MICE (Gavage Studies). NTP, Research Triangle Park, NC.
Abstract: https://ntp.niehs.nih.gov/go/33584National Toxicology Program. 2010. NTP TR-558. Toxicology and Carcinogenesis Studies of 3,3’,4,4’-Tetrachloroazobenzene (TCAB) [CAS No. 14047-09-7] in Sprague-Dawley Rats and B6C3F1 Mice (Gavage Studies). NTP, Research Triangle Park, NC.
Abstract: https://ntp.niehs.nih.gov/go/33564Pearse G. 2006. Histopathology of the thymus. Toxicol Pathol 34:515-547.
Full Text: http://tpx.sagepub.com/content/34/5/515.longStefanski SA, Elwell MR, Stromberg PC. 1990. Spleen, lymph nodes, and thymus. In: Pathology of the Fischer Rat: Reference and Atlas (Boorman GA, Eustis SL, Elwell MR, Montgomery CA, MacKenzie WF, eds). Academic Press, San Diego, 369-394.
Ward JM, Mann PC, Morishima H, Frith CH. 1999. Thymus, spleen, and lymph nodes. In: Pathology of the Mouse (Maronpot RR, ed). Cache River Press, Vienna, IL, 333-360.
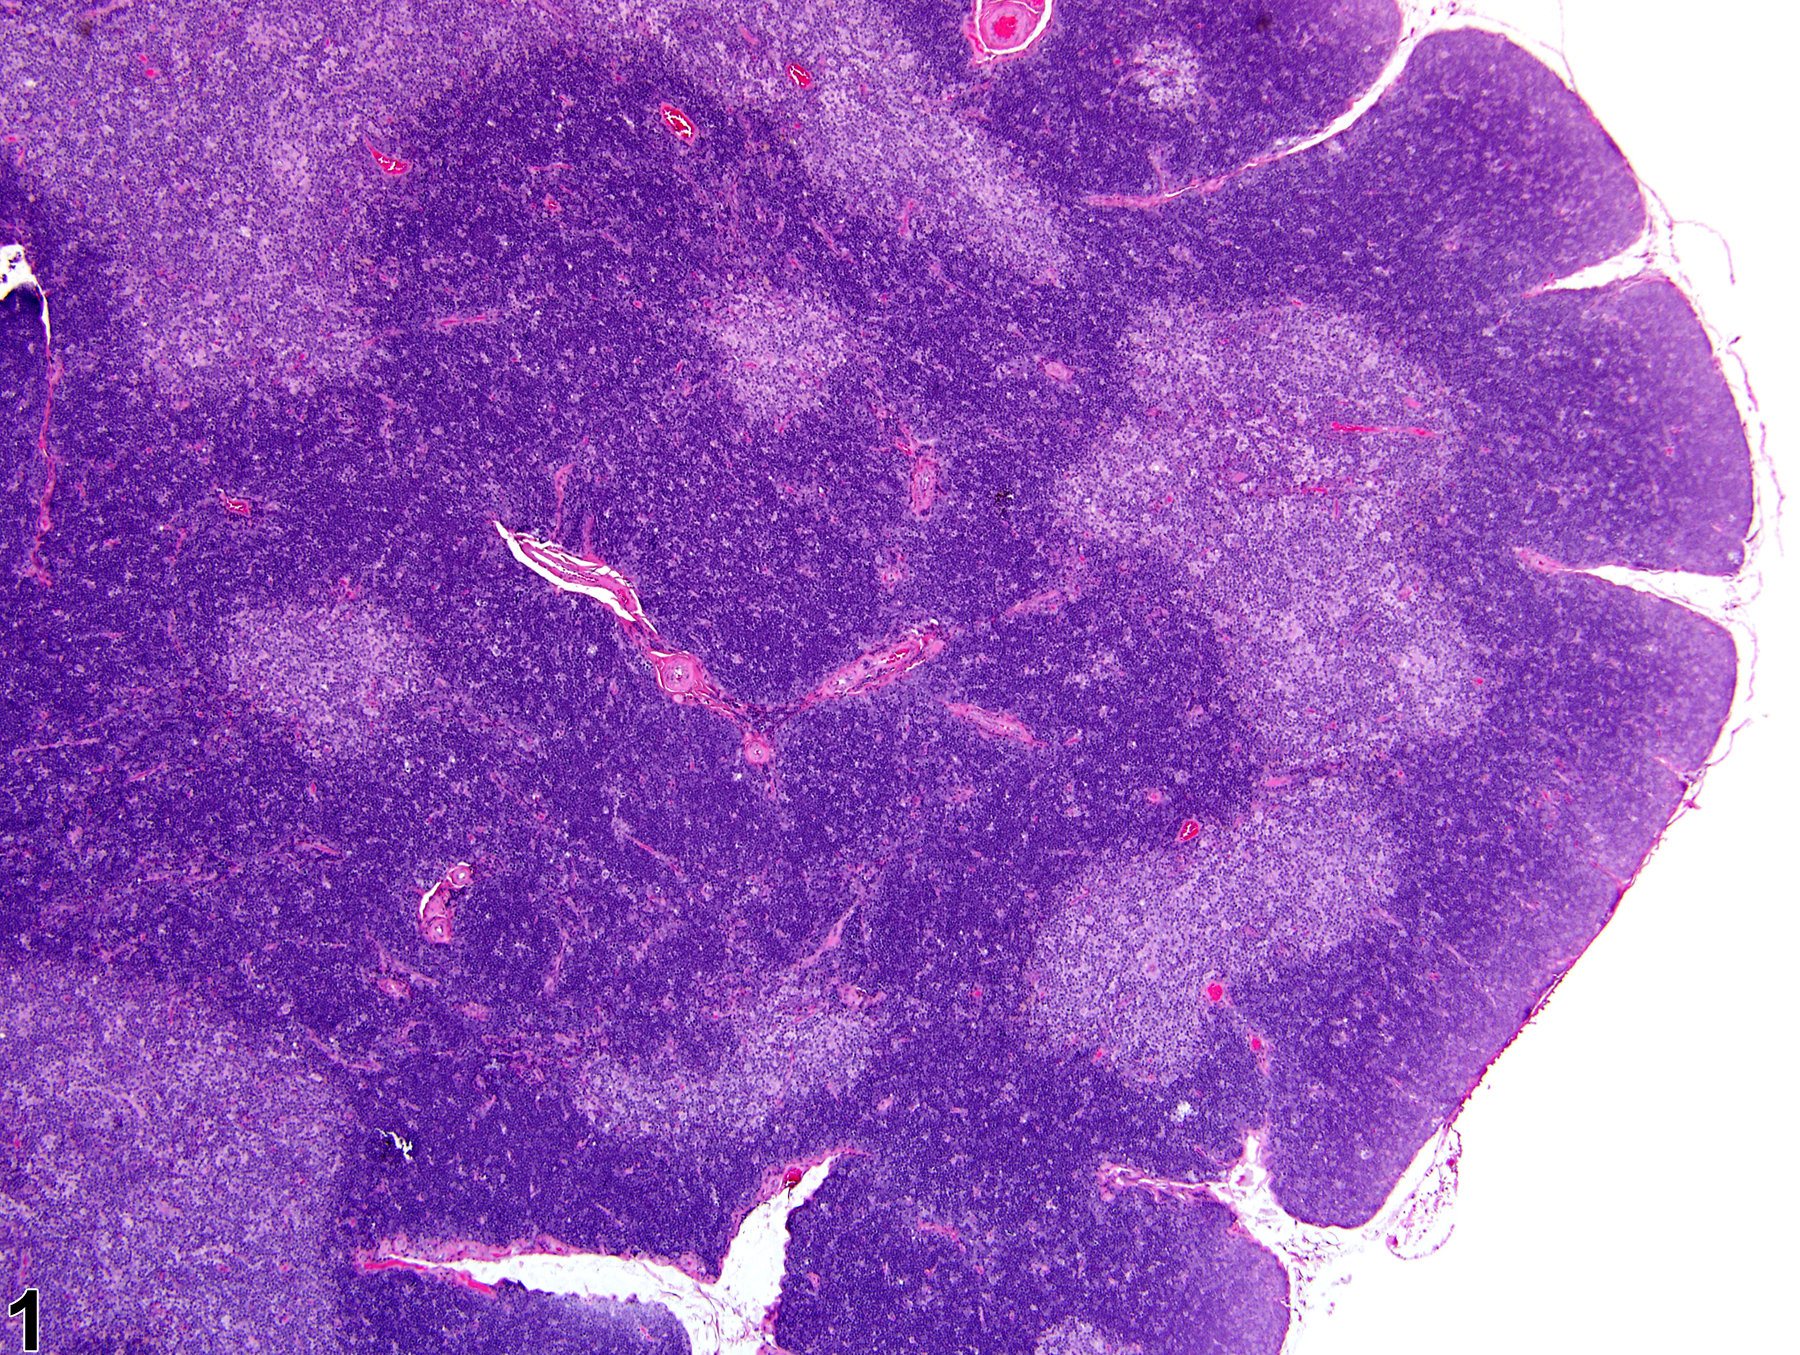
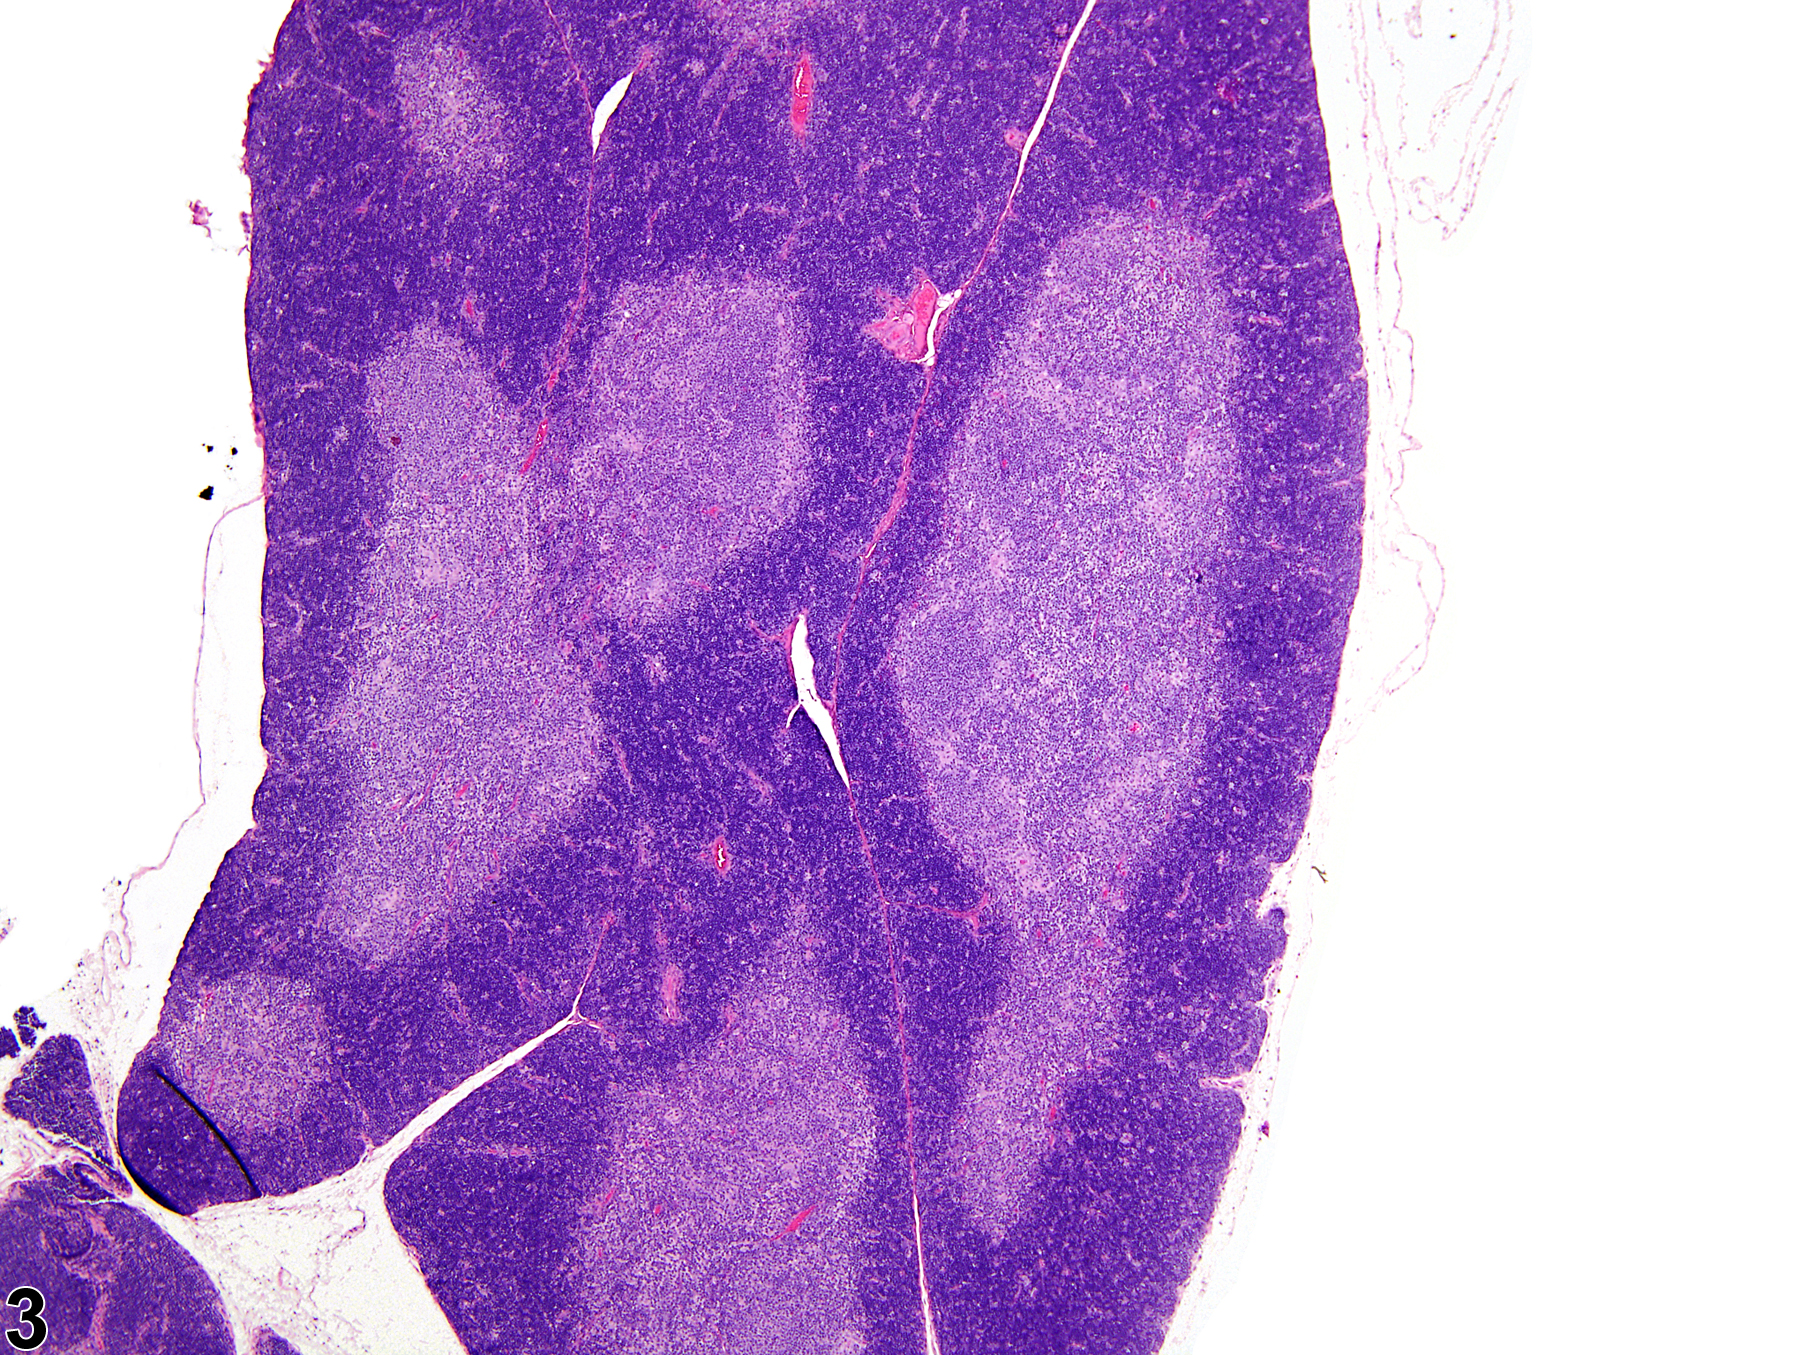
Thymus - Normal in a male Harlan Sprague-Dawley rat from a subchronic study. The ratio of cortex to medulla is approximately 2:1 (1:1:1, two cortices to medulla).
All Images

Thymus - Normal in a male Harlan Sprague-Dawley rat from a subchronic study. The ratio of cortex to medulla is approximately 2:1 (1:1:1, two cortices to medulla).

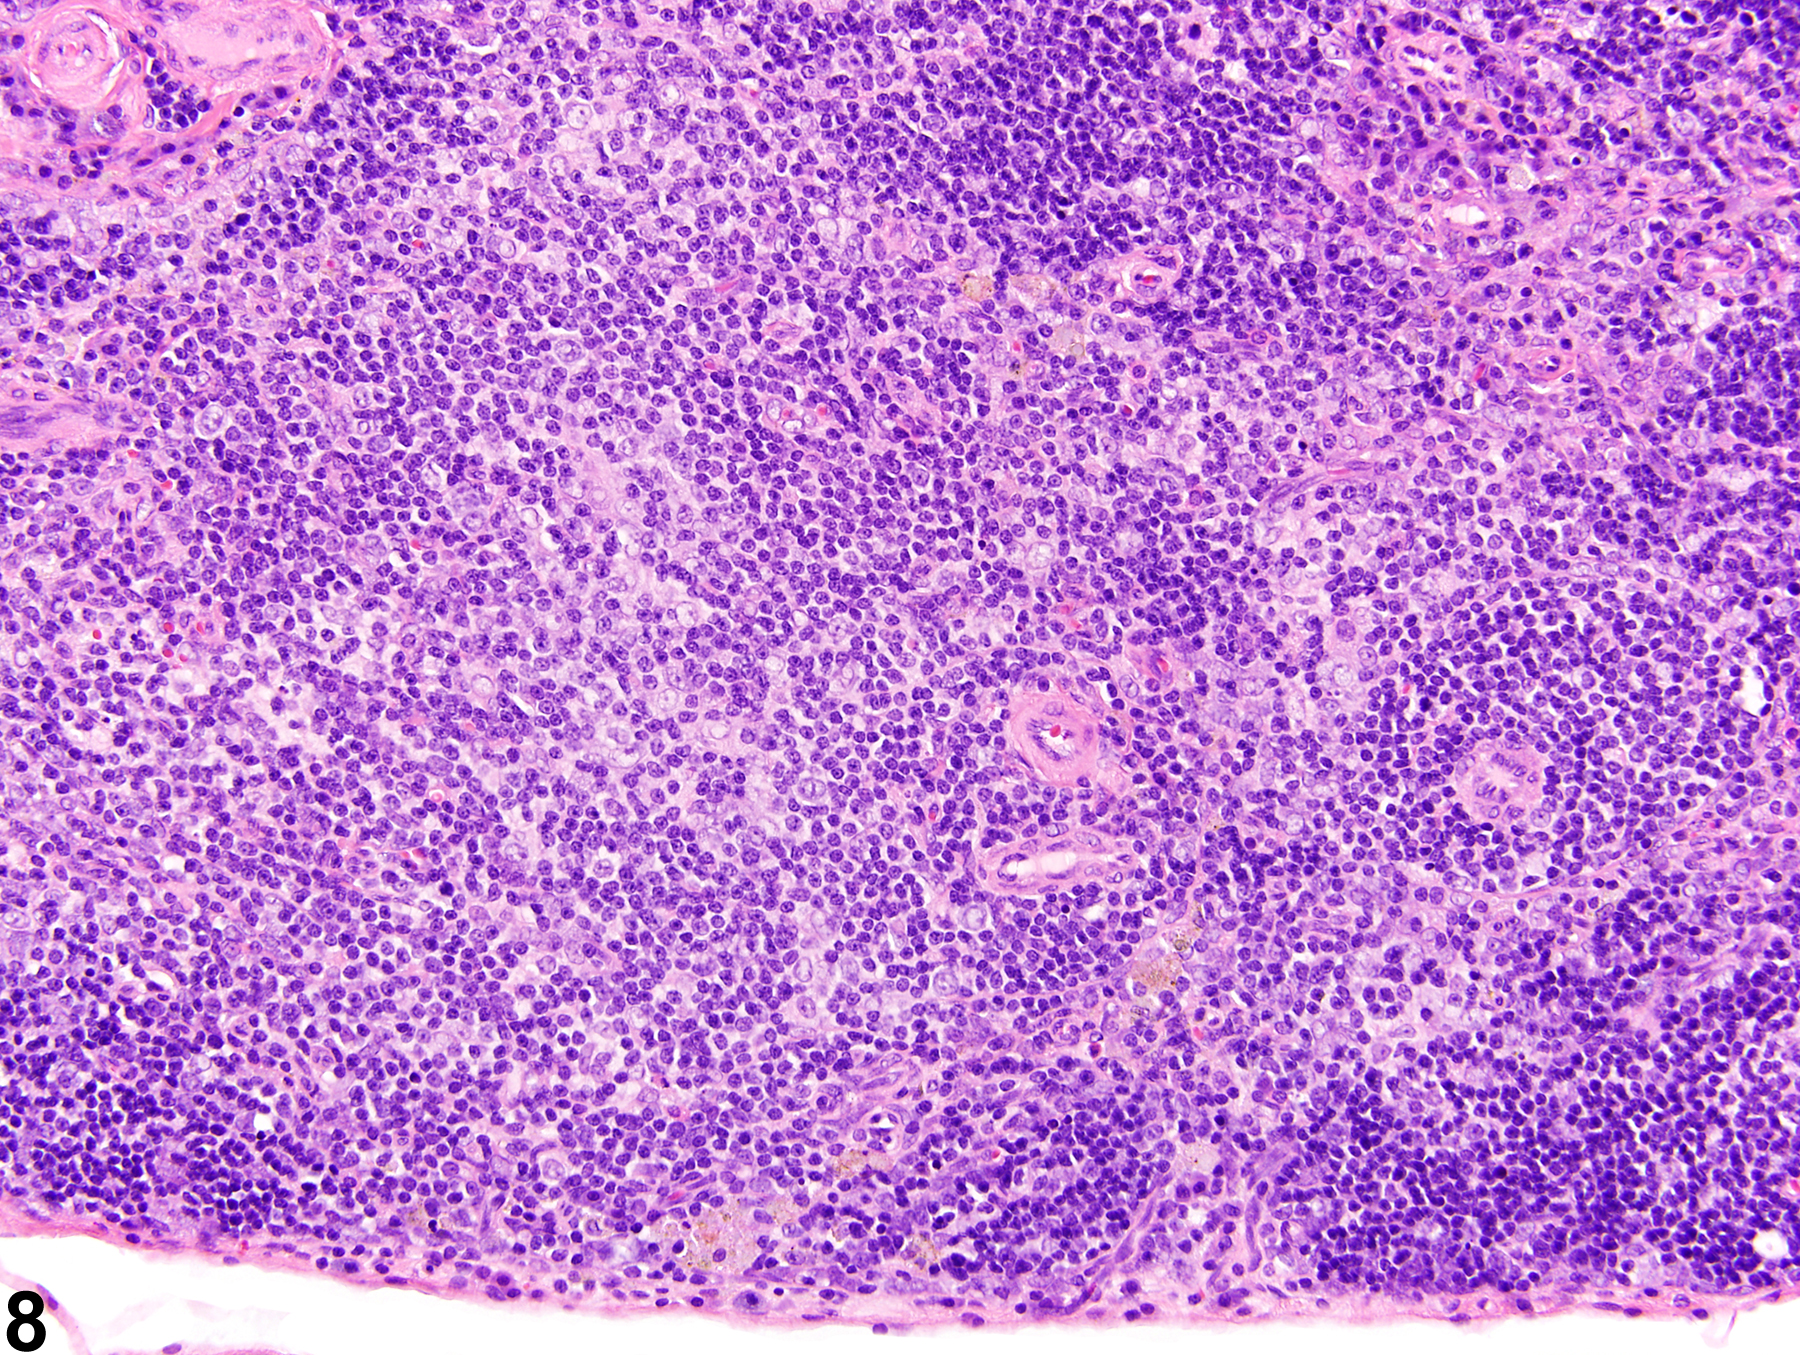
Thymus - Normal in a male Harlan Sprague-Dawley rat from a subchronic study (higher magnification of Figure 1). The lymphocytes are more numerous in the cortex than in the medulla.

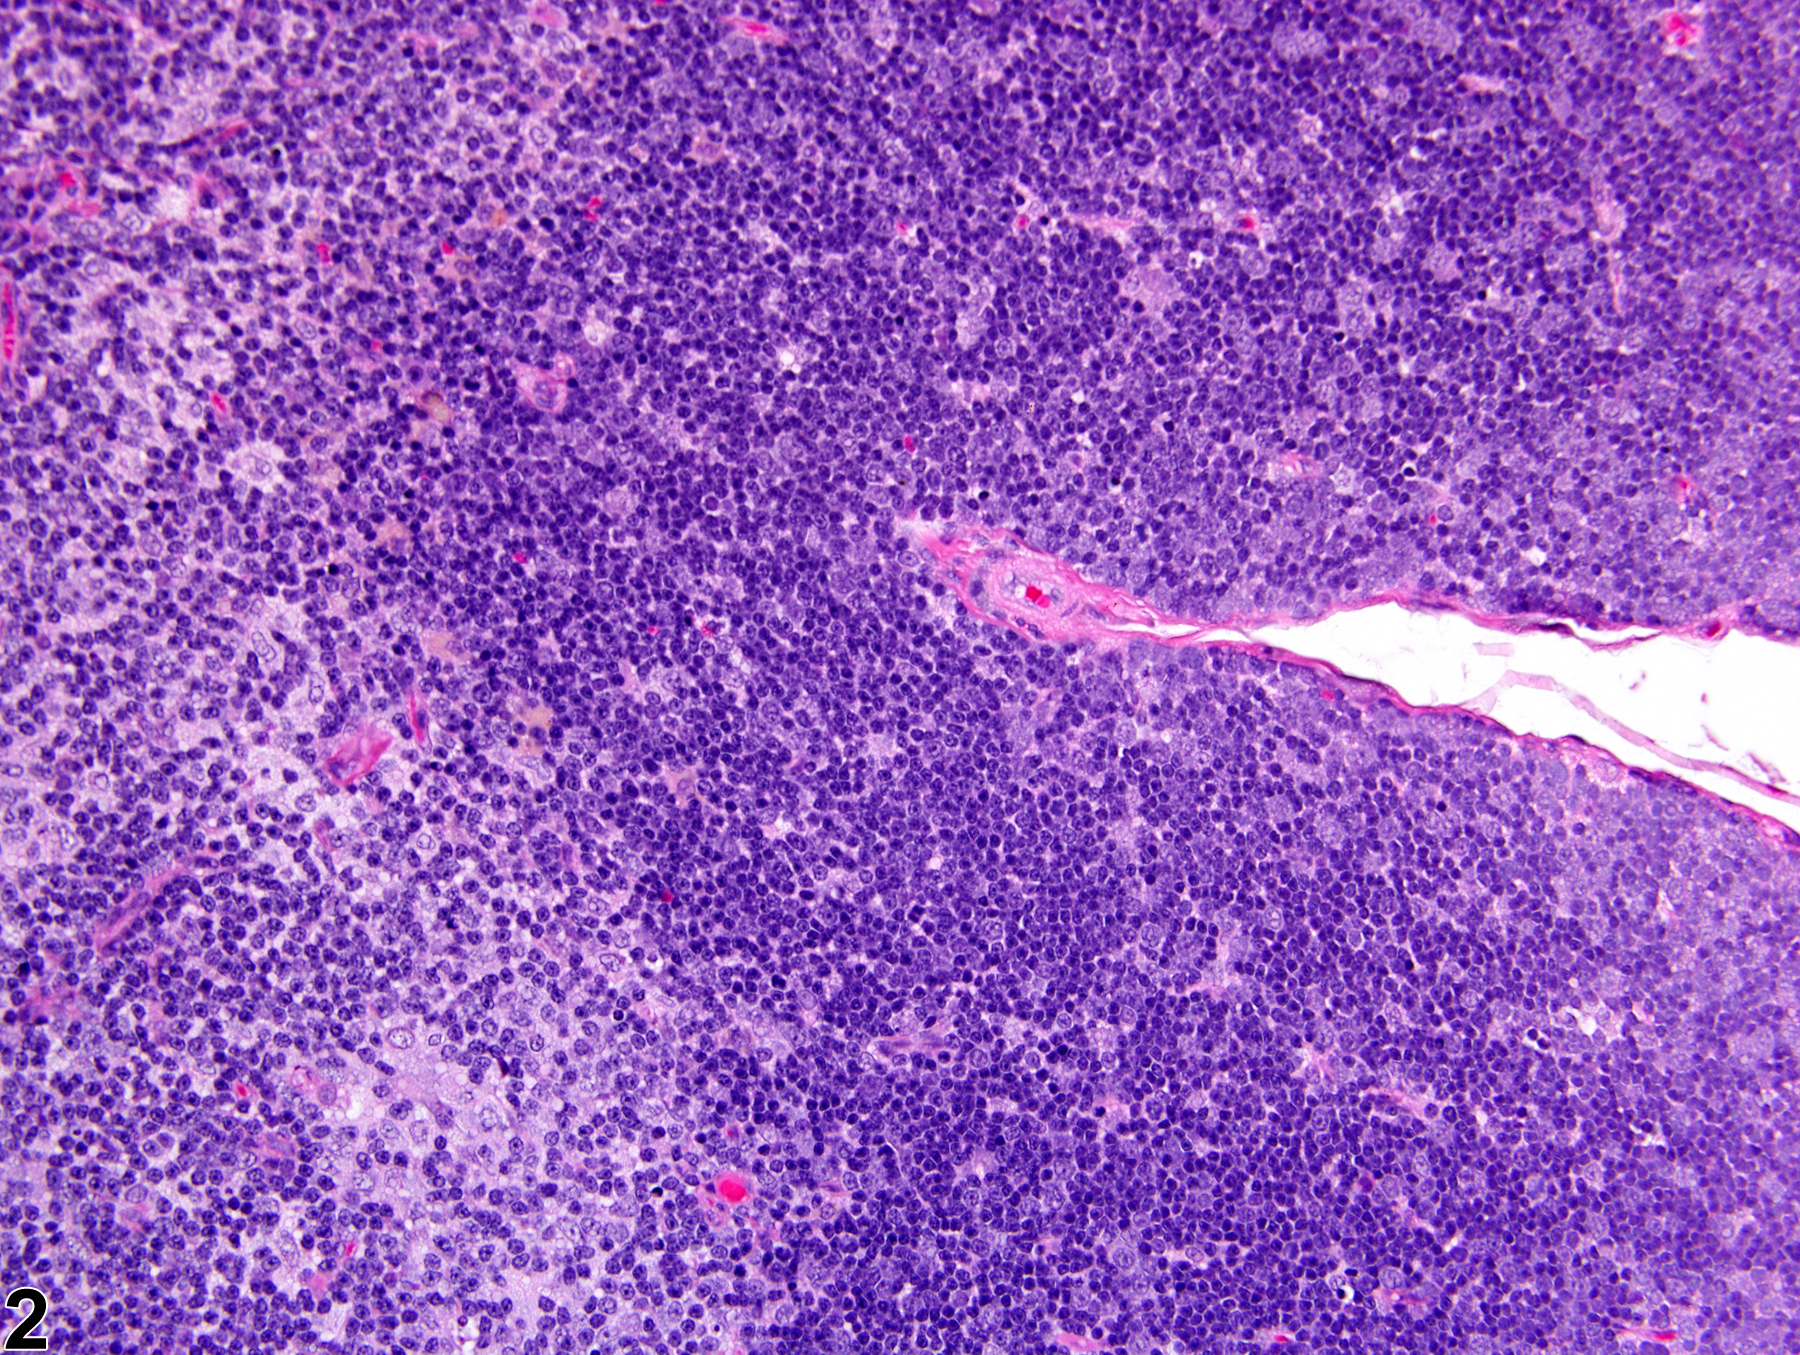
Thymus - Atrophy in a treated female F344/NTac rat from a subchronic study. The cortex, showing minimal atrophy, is thinner and more irregular compared with normal (Figure 1).

Thymus - Atrophy in a treated female F344/NTac rat from a subchronic study (higher magnification of Figure 3). The cortex, showing minimal atrophy, is thinner and more irregular compared with normal (Figure 2).

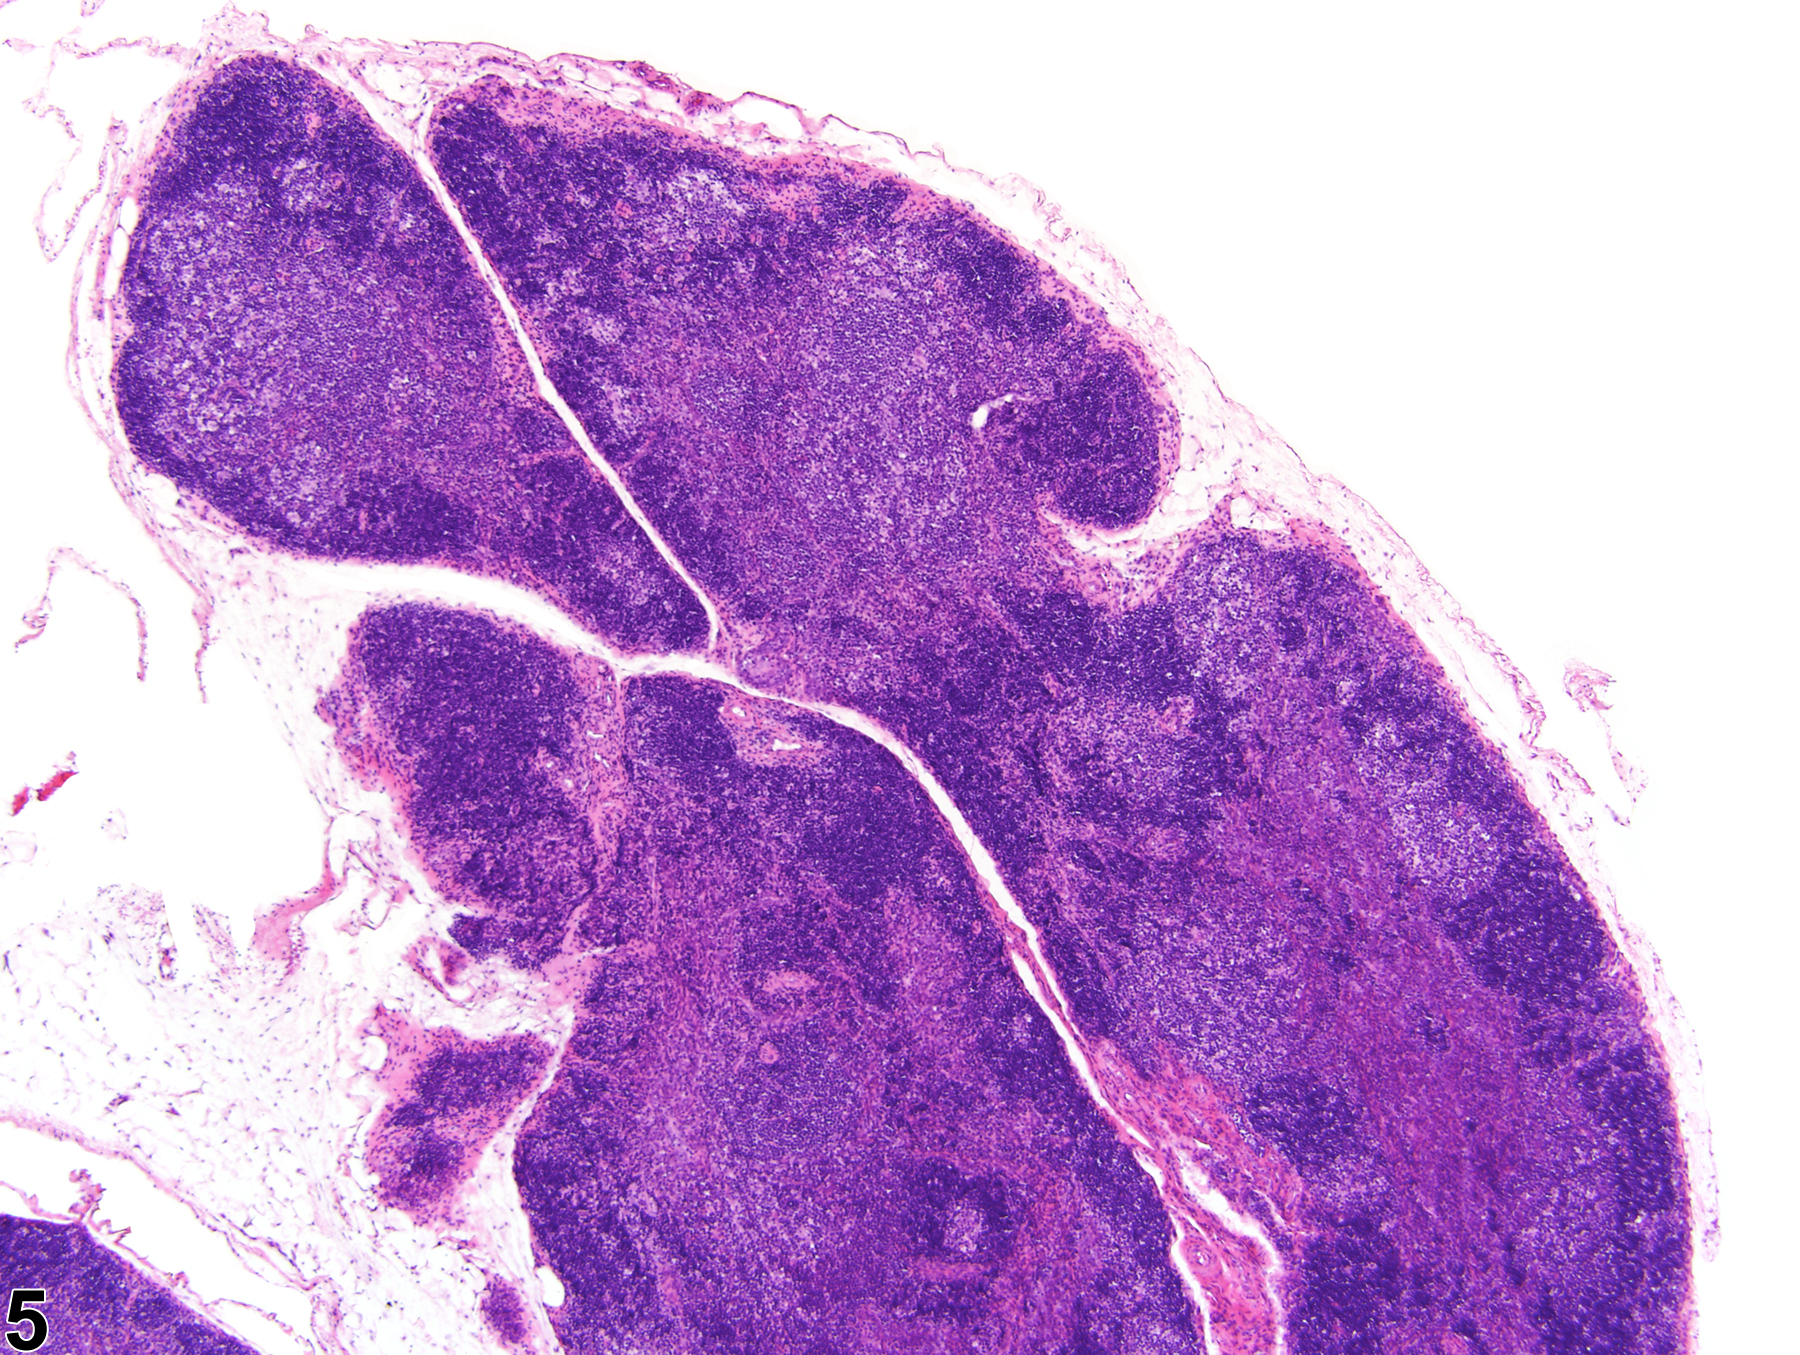
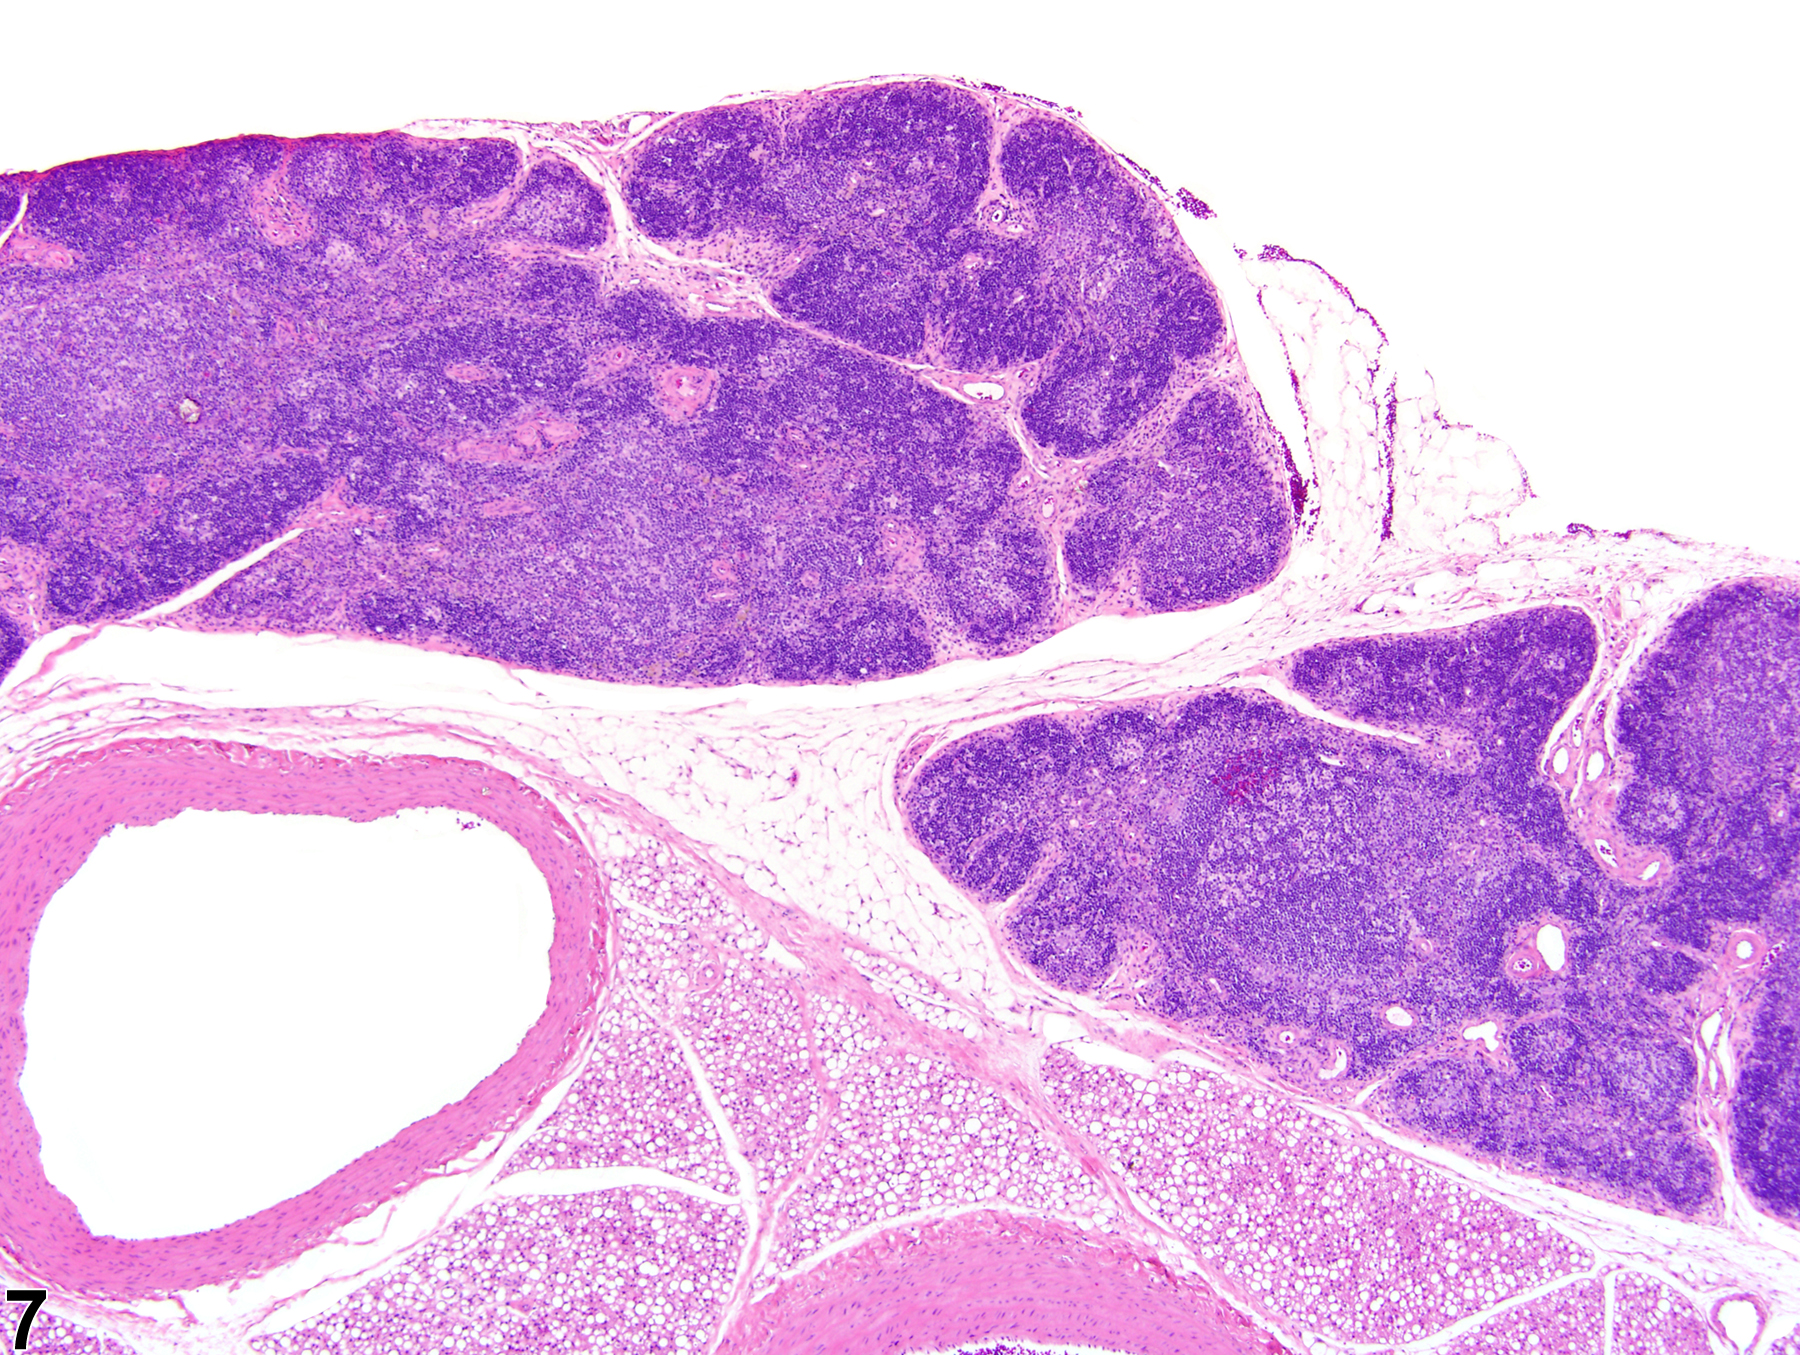
Thymus - Atrophy in a treated female Harlan Sprague-Dawley rat from a chronic study. With mild atrophy, the cortex becomes progressively thinner and the cortical-medullary junction becomes less distinct.

Thymus - Atrophy in a treated female Harlan Sprague-Dawley rat from a chronic study (higher magnification of Figure 5). The cortex is thinner, and the cortical-medullary junction is less distinct compared with Figure 4.

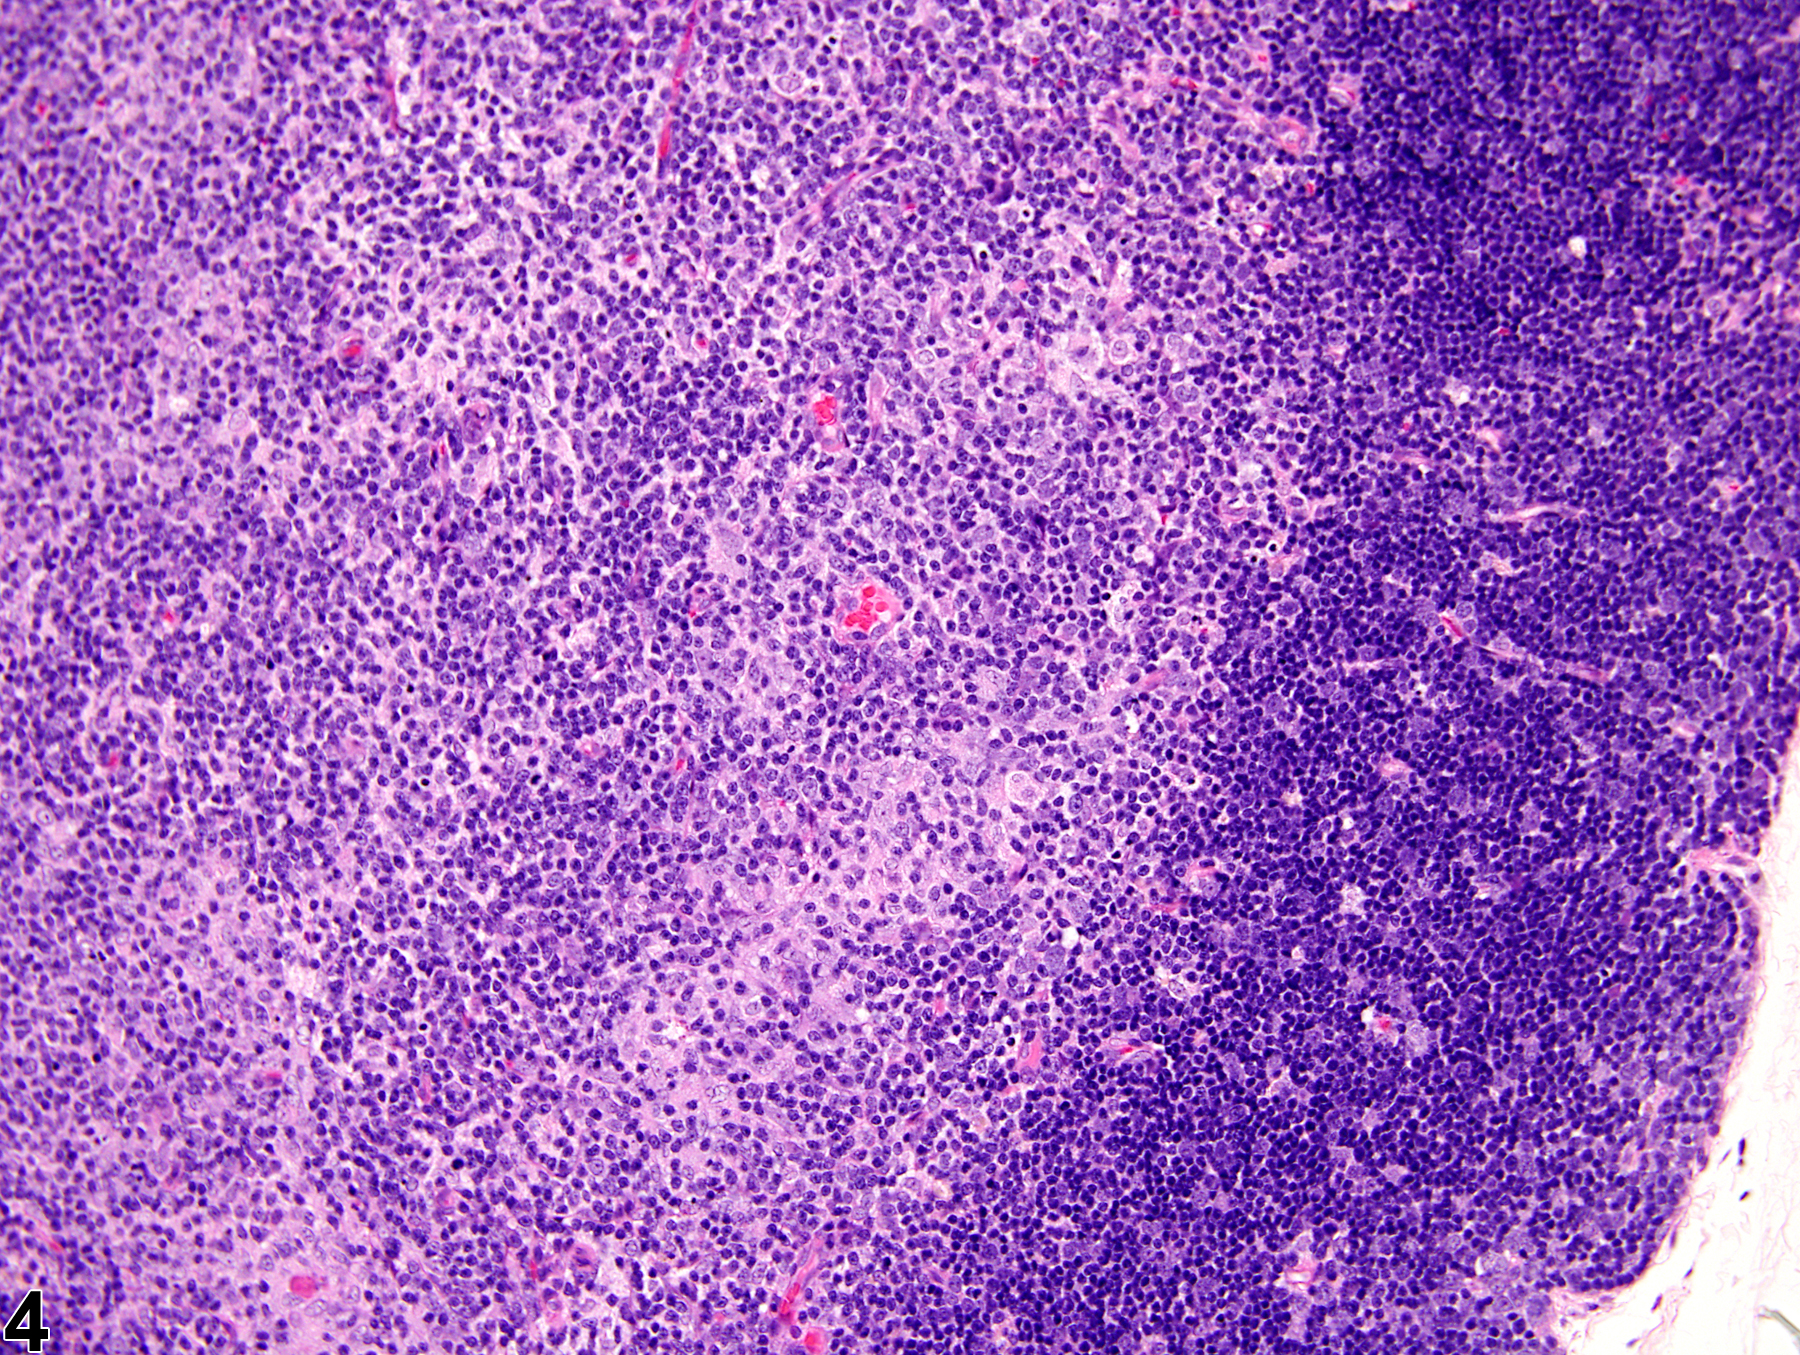
Thymus - Atrophy in a treated female Harlan Sprague Dawley from a chronic study. With moderate atrophy, delineation of the cortex and medulla is multifocally indistinct.

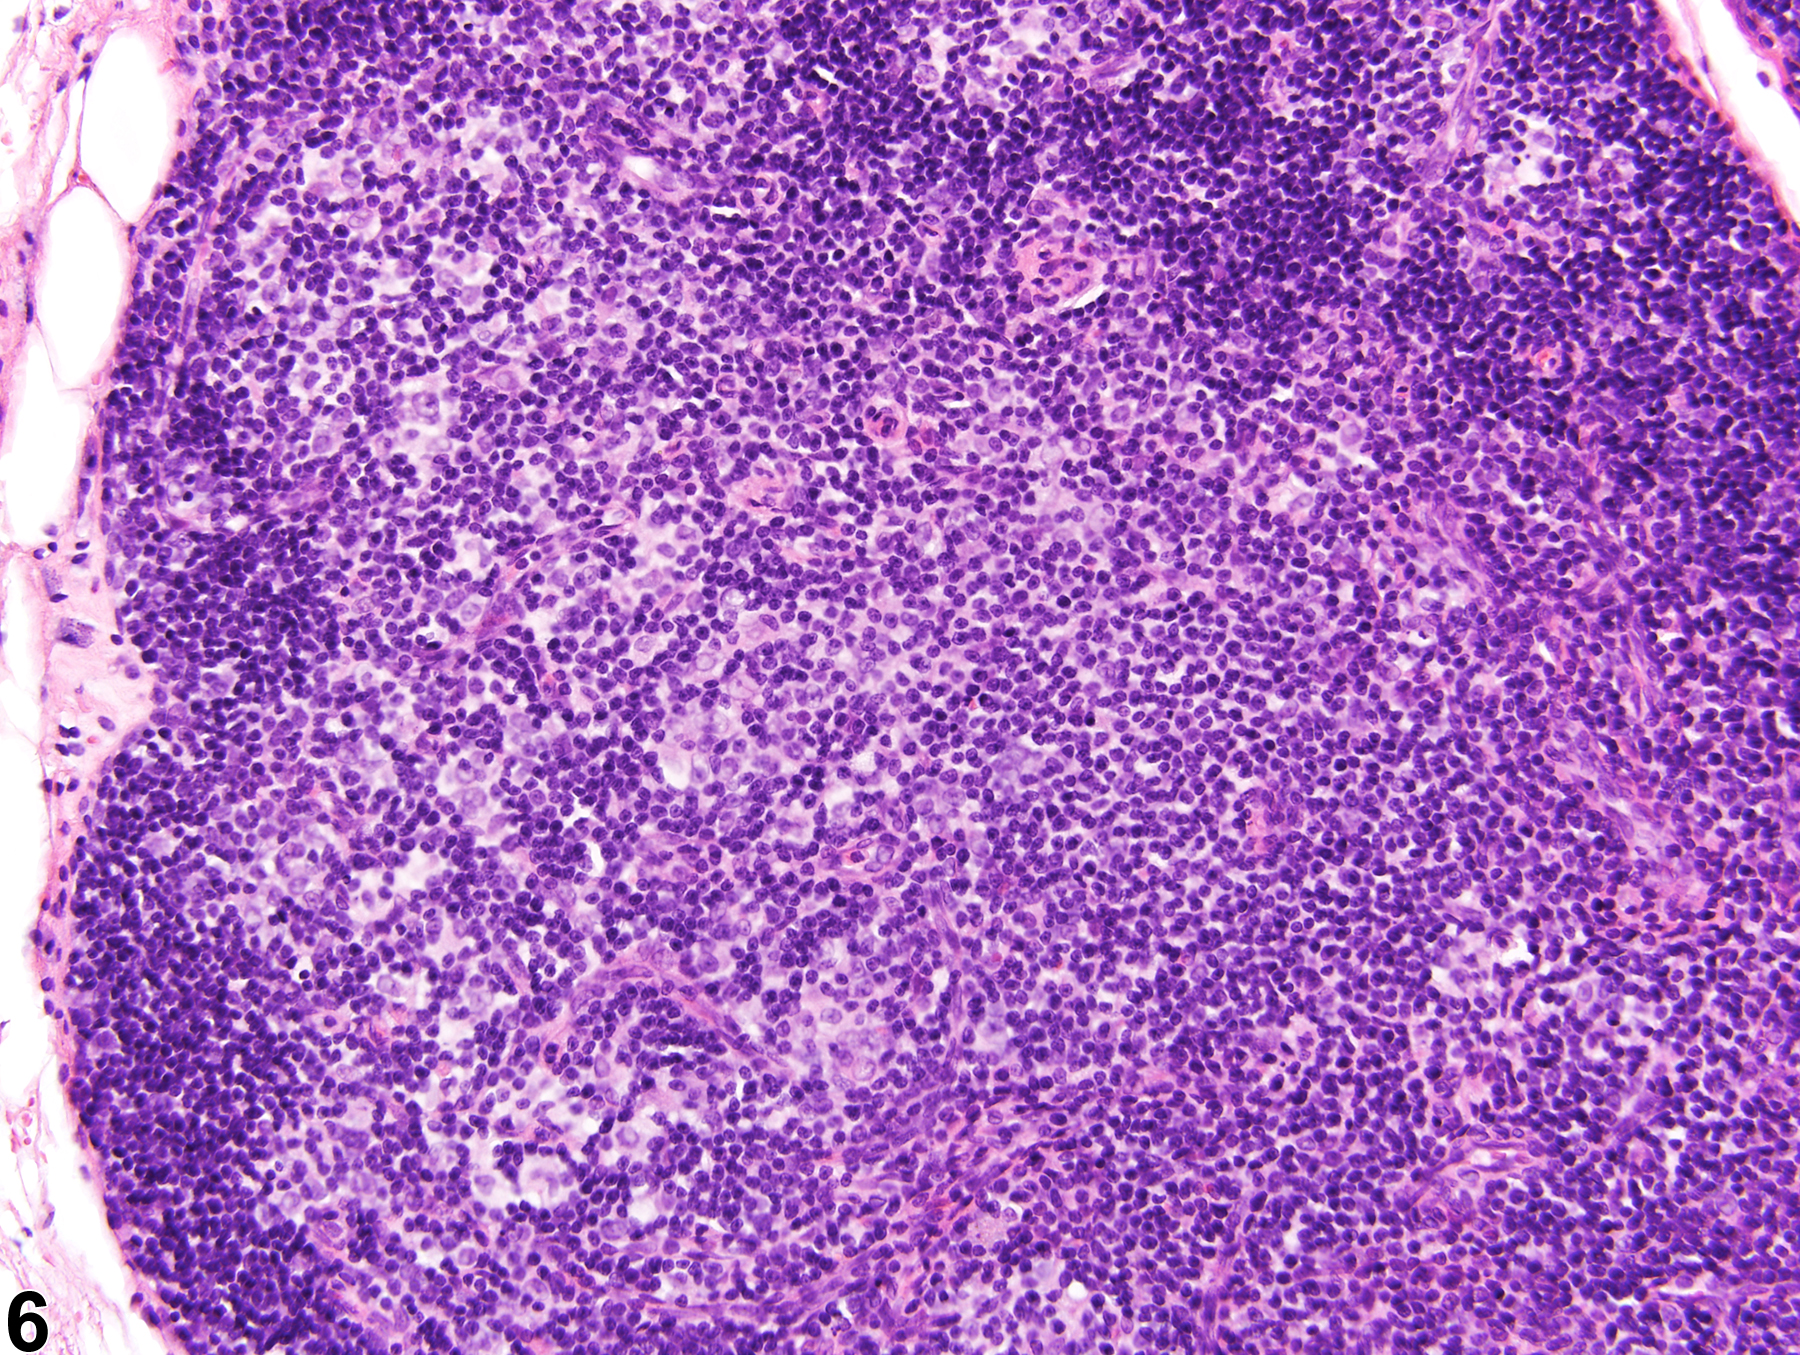
Thymus - Atrophy in a treated female Harlan Sprague Dawley from a chronic study (higher magnification of Figure 7). With moderate atrophy, delineation of the cortex and medulla is multifocally indistinct.

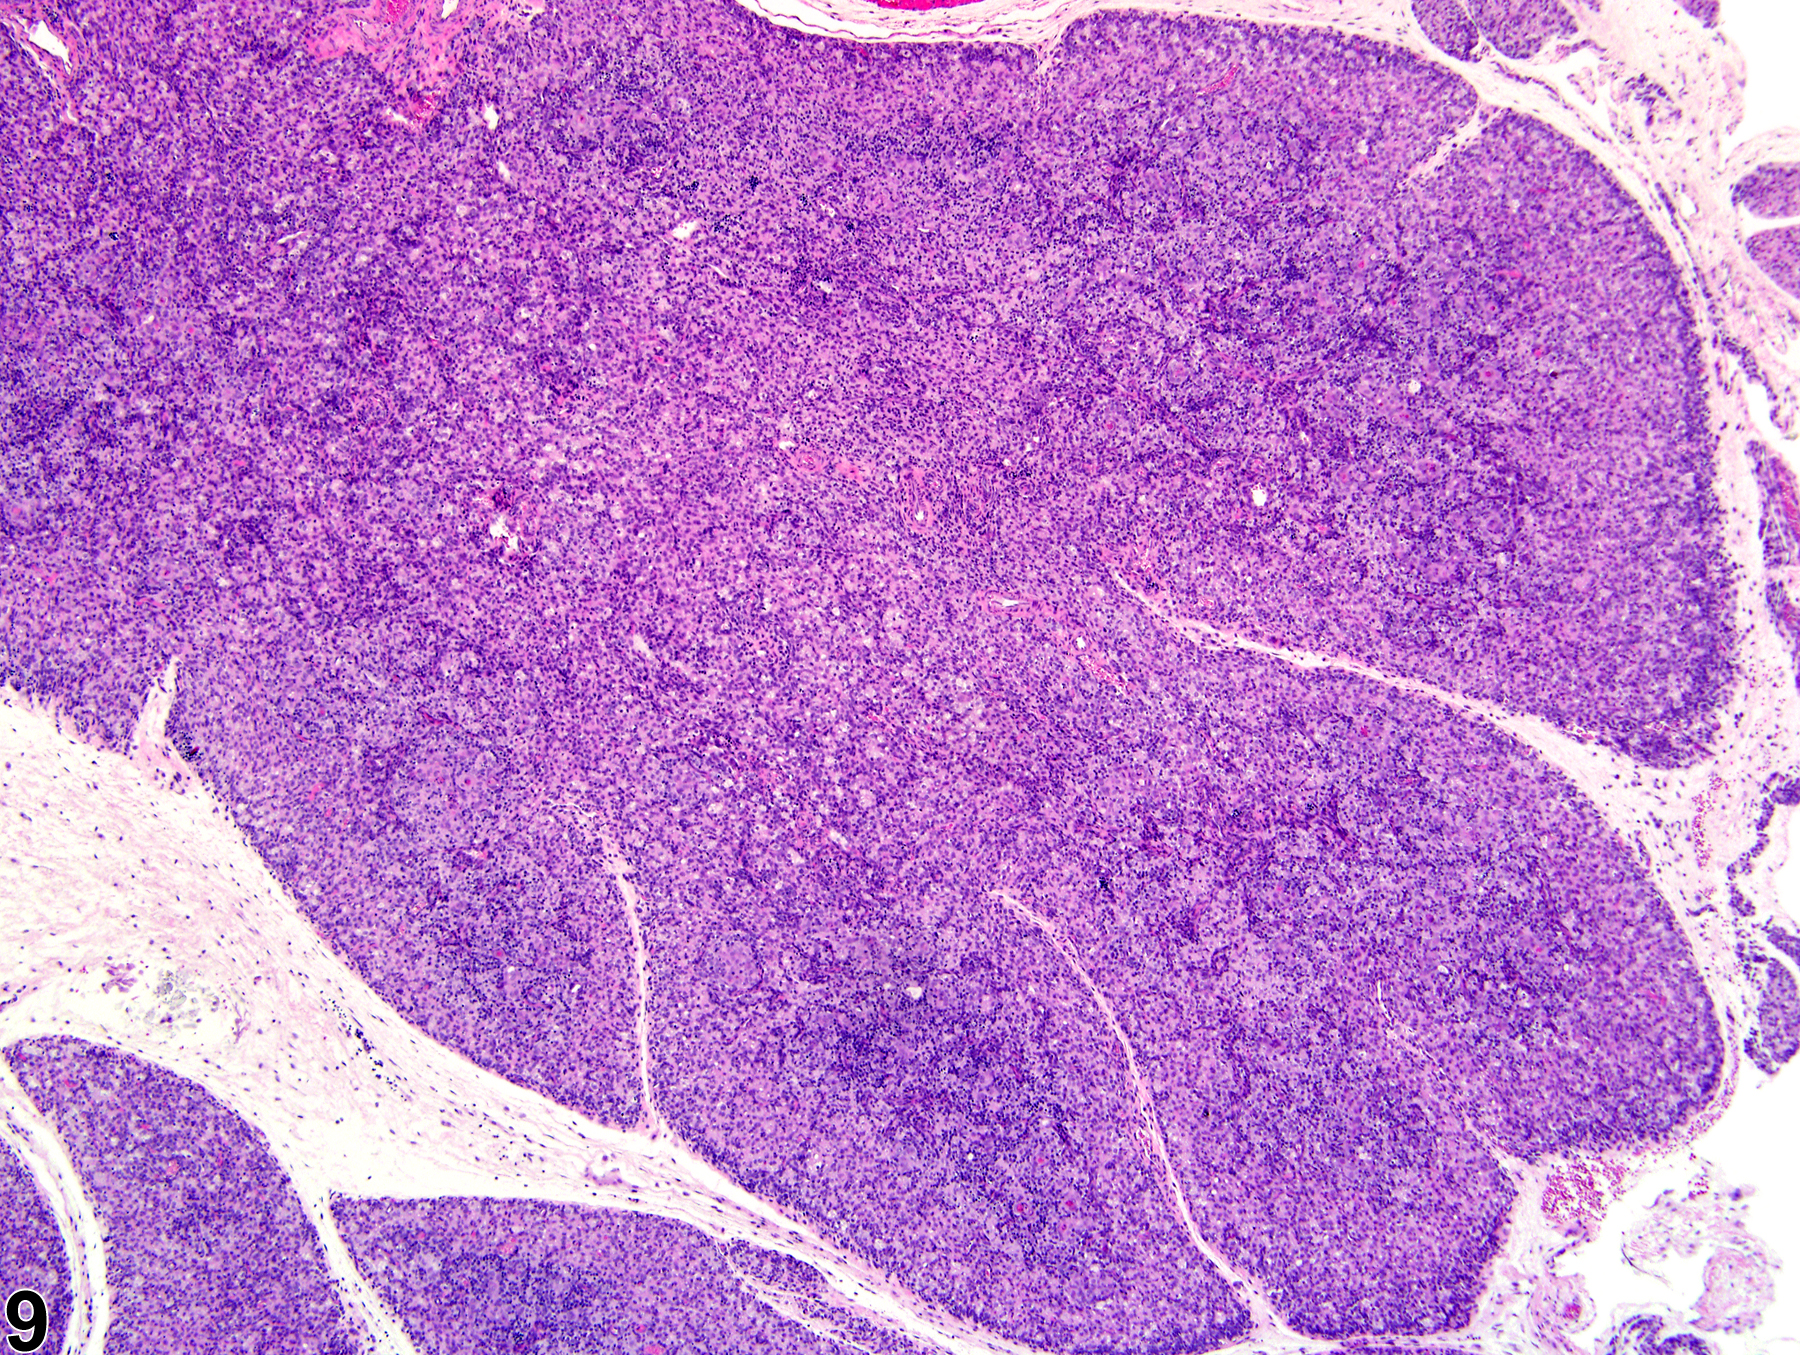
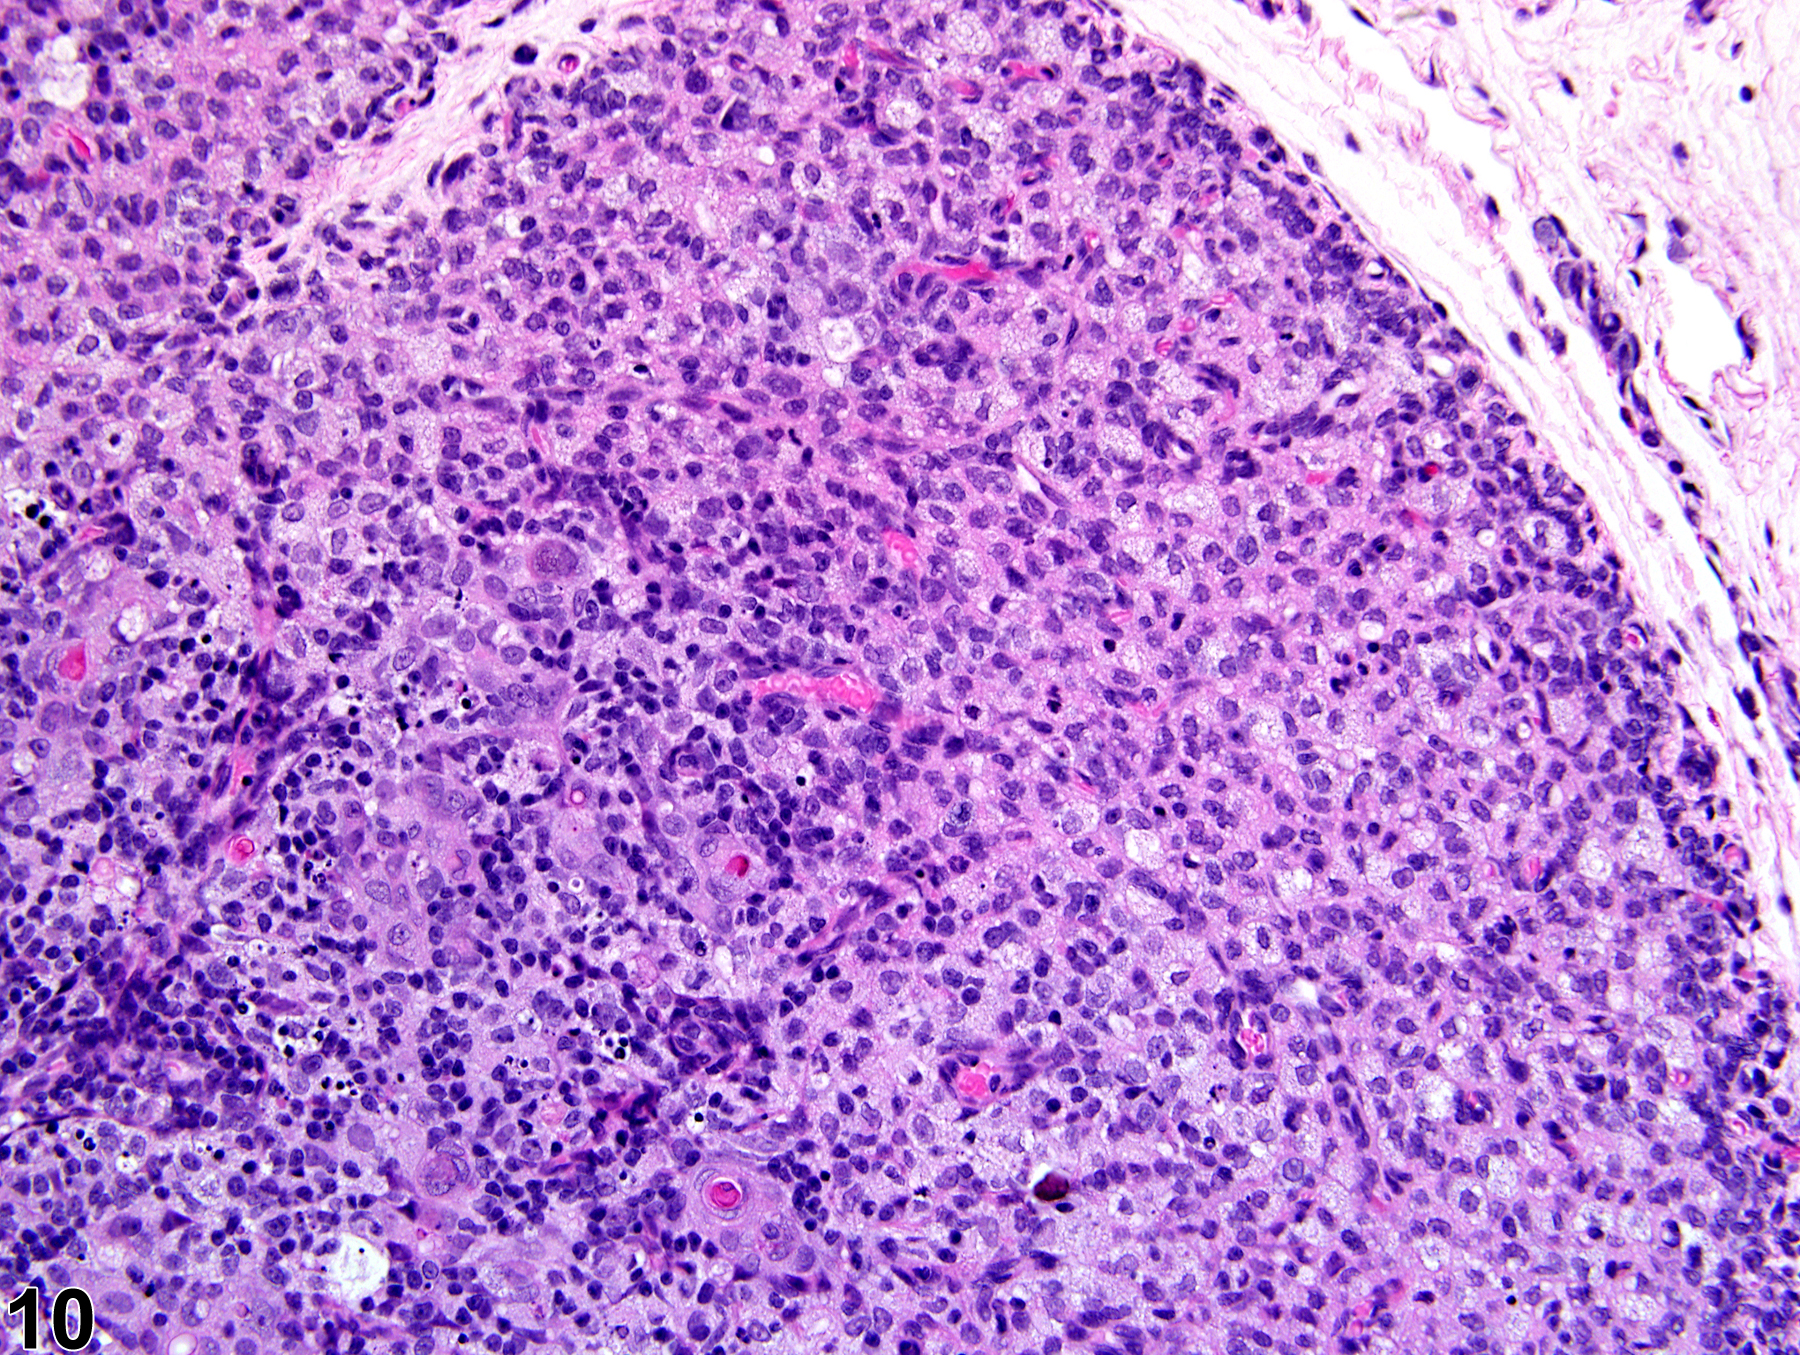
Thymus - Atrophy in a treated female Harlan Sprague-Dawley from a chronic study. With marked atrophy, the lack of distinction between the cortex and medulla due to lymphocyte depletion gives the thymus a more uniform appearance.

Thymus - Atrophy in a treated female Harlan Sprague-Dawley from a chronic study (higher magnification of Figure 9). With marked atrophy, the distinction between the thymic cortex and medulla is no longer visible due to lymphocyte depletion.