

Nervous System
Brain, Neuron - Necrosis
Narrative
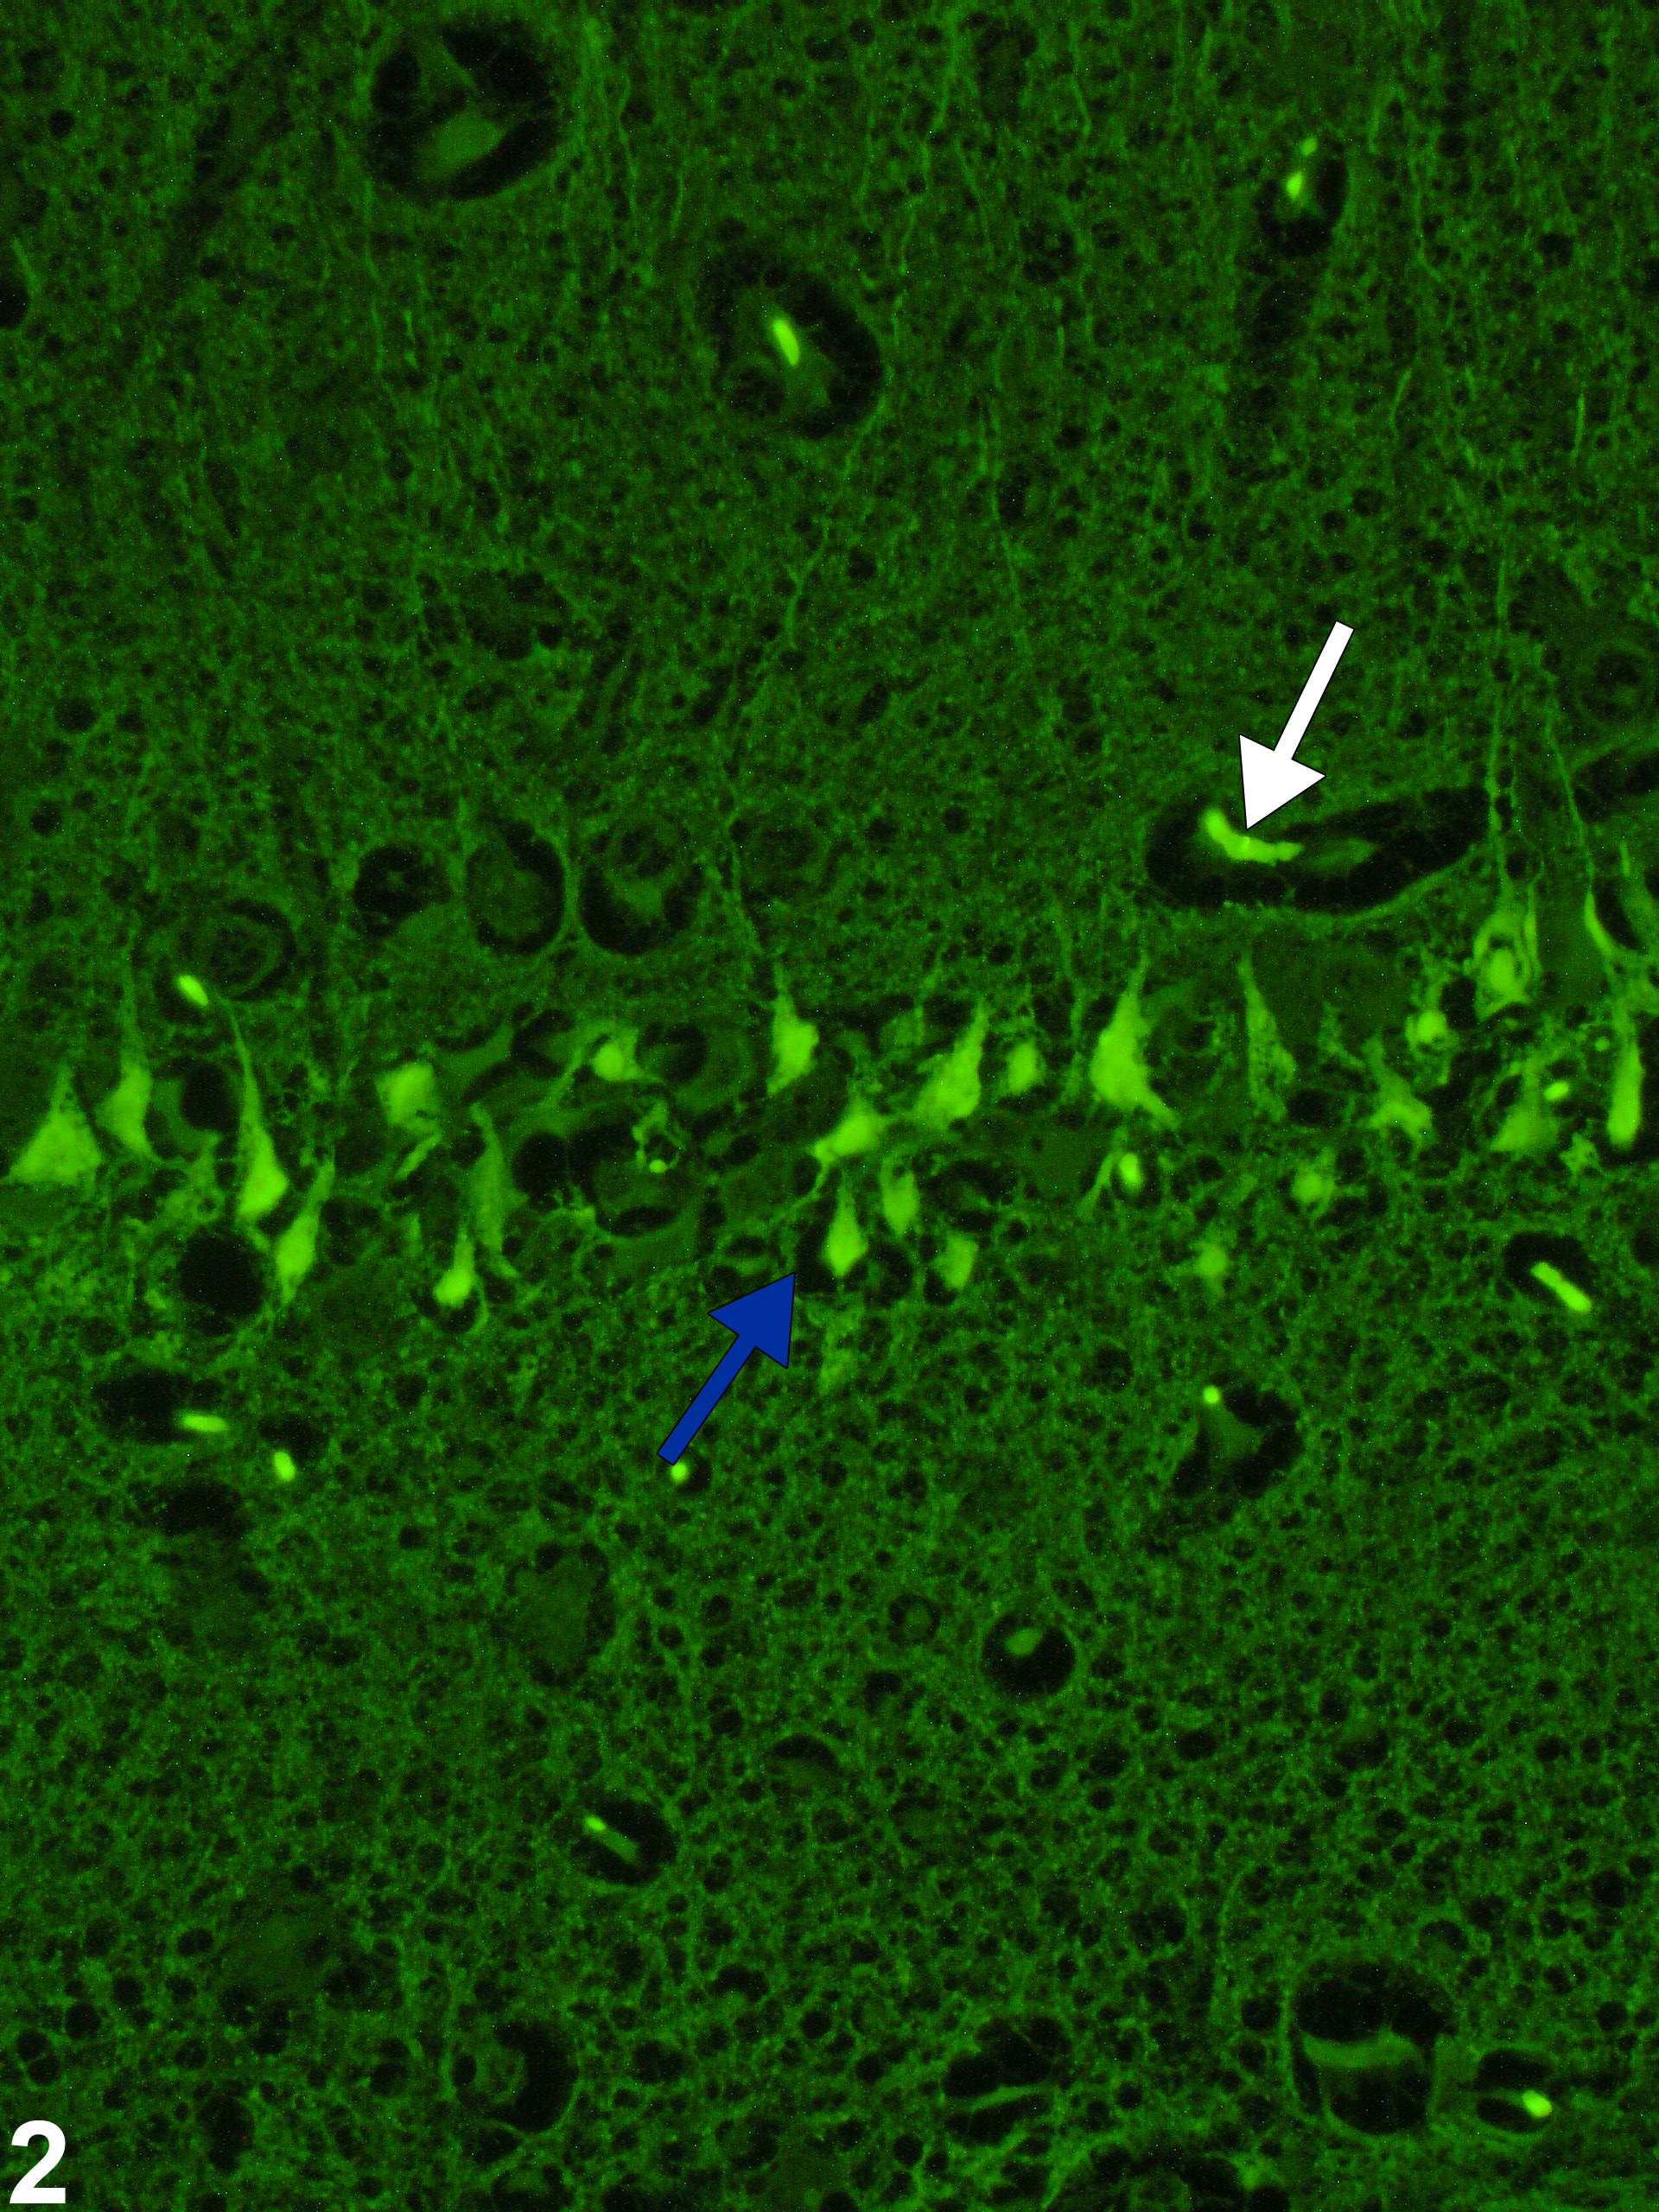
Figure 2 depicts an ultraviolet microscopy image showing the positive green fluorescent, empiric staining by Fluoro-Jade B of necrotic hippocampal pyramidal cells (blue arrow). Use of the Fluoro-Jade family of empiric neurodegenerative stains is extremely valuable in quickly identifying even small numbers of degenerative neurons, even at low magnification. Although given much investigation, the actual mechanism whereby the stain has this affinity for necrotic neurons is still poorly understood. Fluorescence of affected cells highlights the injured neurons, but the use of hematoxylin and eosin is also important to identify associated neural changes corroborating the fluorescent findings and defining the chronology of the lesions. Fluoro-Jade C is the most recent of the Fluoro-Jade stains and has been found to stain all degenerating neurons, regardless of specific insult or mechanism of cell death. Fluoro-Jade C exhibits the greatest signal-to-background ratio, as well as the highest resolution, therefore giving maximal contrast and affinity for degenerating neurons. The stain also identifies degenerated distal dendrites, axons, and terminals. The dye is resistant to fading and is compatible with most histologic methods. Activated astrocytes, degenerating neurons, and cell nuclei can be labeled together using glial fibrillary acidic protein immunofluorescence, Fluoro-Jade C, and 4'',6-diamidino-2-phenylindole (DAPI), respectively. Some care needs to be taken in interpretation, since Fluoro-Jade also lightly stains artifactual basophilic neurons (PB Little, personal observations). Note that normal red blood cells (Figure 2, white arrow) also stain positive in the blood vessels.
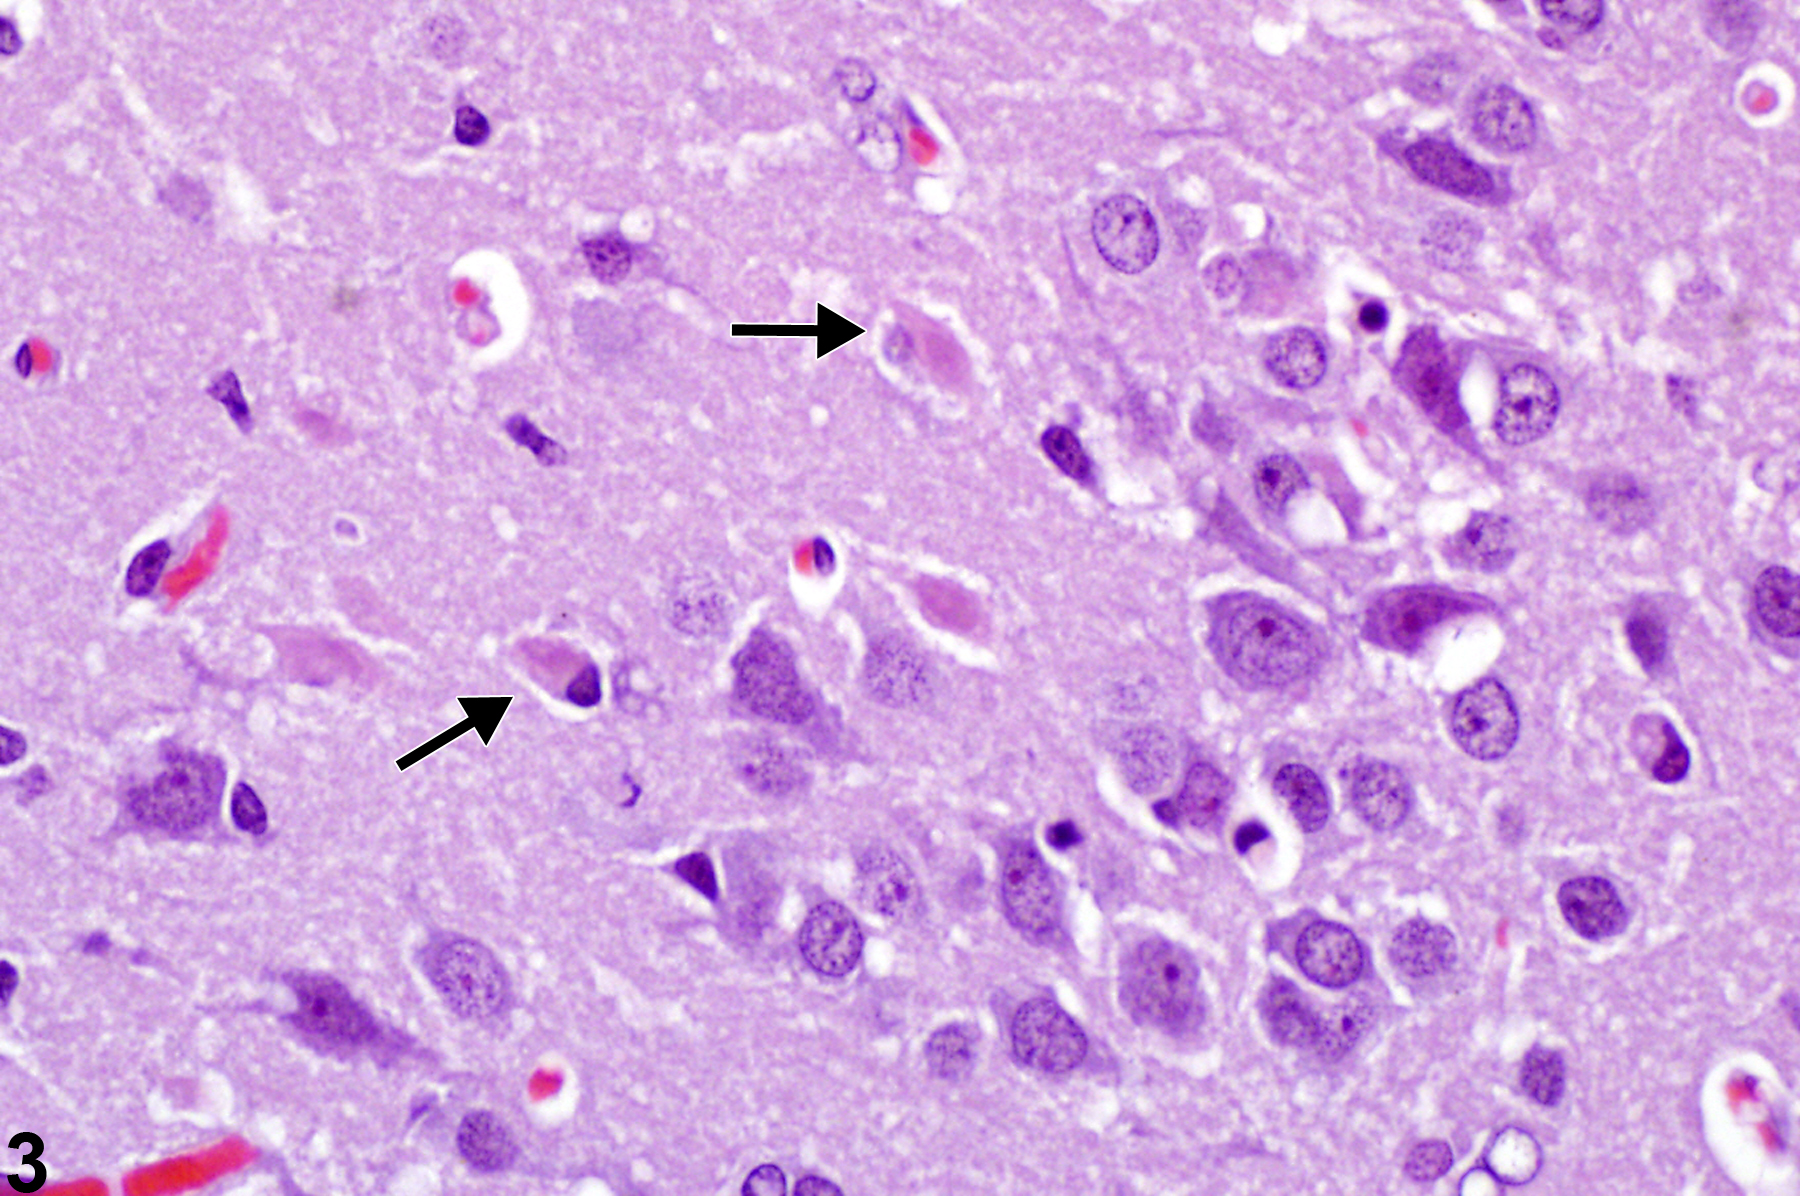
In Figure 3, necrotic neurons (arrows) are evident adjacent to more normal neurons in the piriform cortex. Note that some are particularly faded and almost invisible. This image depicts neuronal necrosis at a later stage, evolving from that seen with acute eosinophilic neuronal necrosis (see Figure 1). With chronologic progressive degenerative change, there is noticeable fading of the eosinophilia of the cytoplasm and basophilia of the nucleus. The fading is followed by vague outlines of the former neurons, referred to as “ghost forms,” followed by the loss of any observable degenerate structure. The presence of more normal neurons in adjacent areas assists with the recognition of these forms of degenerate cells differentiating the changes from that of autolysis. Depending on the time of observation after neurotoxic effects, a chronologic continuum of degenerative neuronal morphologic changes may be apparent. Some, such as acute eosinophilic necrosis, are readily apparent; however, the pathologist must be aware of the more subtle, often overlooked, changes shown in Figure 3 consisting of faded “ghost” profiles of neurons.
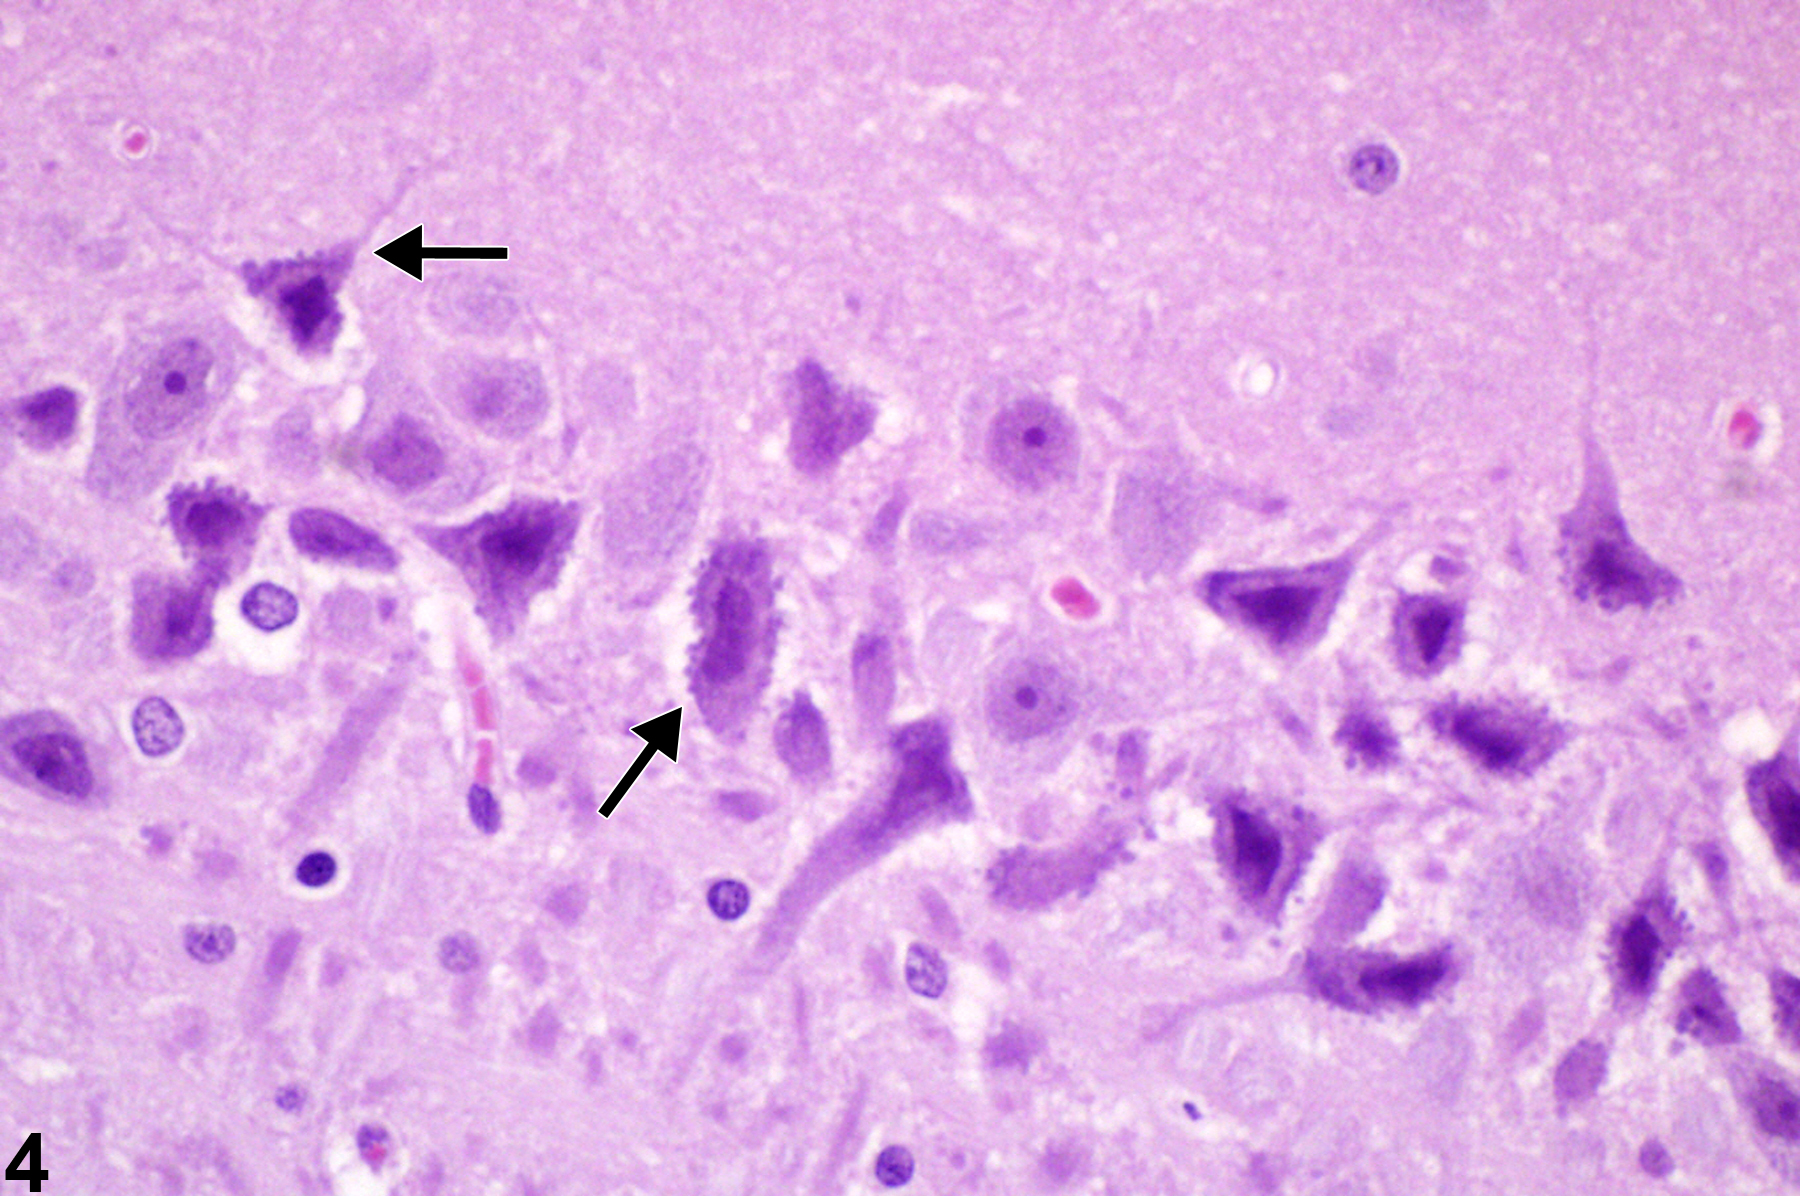
In Figure 4, basophilic necrotic neurons have escaped the more rapid process of dissolution shown in Figure 3. Note the subtle punctate ferrugination (dystrophic mineralization) of neuronal membrane (arrows). The degenerate neurons remain in situ and have early accumulation of mineral (ferrugination) at their surfaces. The image depicts multiple small punctate aggregations of mineral, some of which may represent mineralization of dendritic terminal boutons.
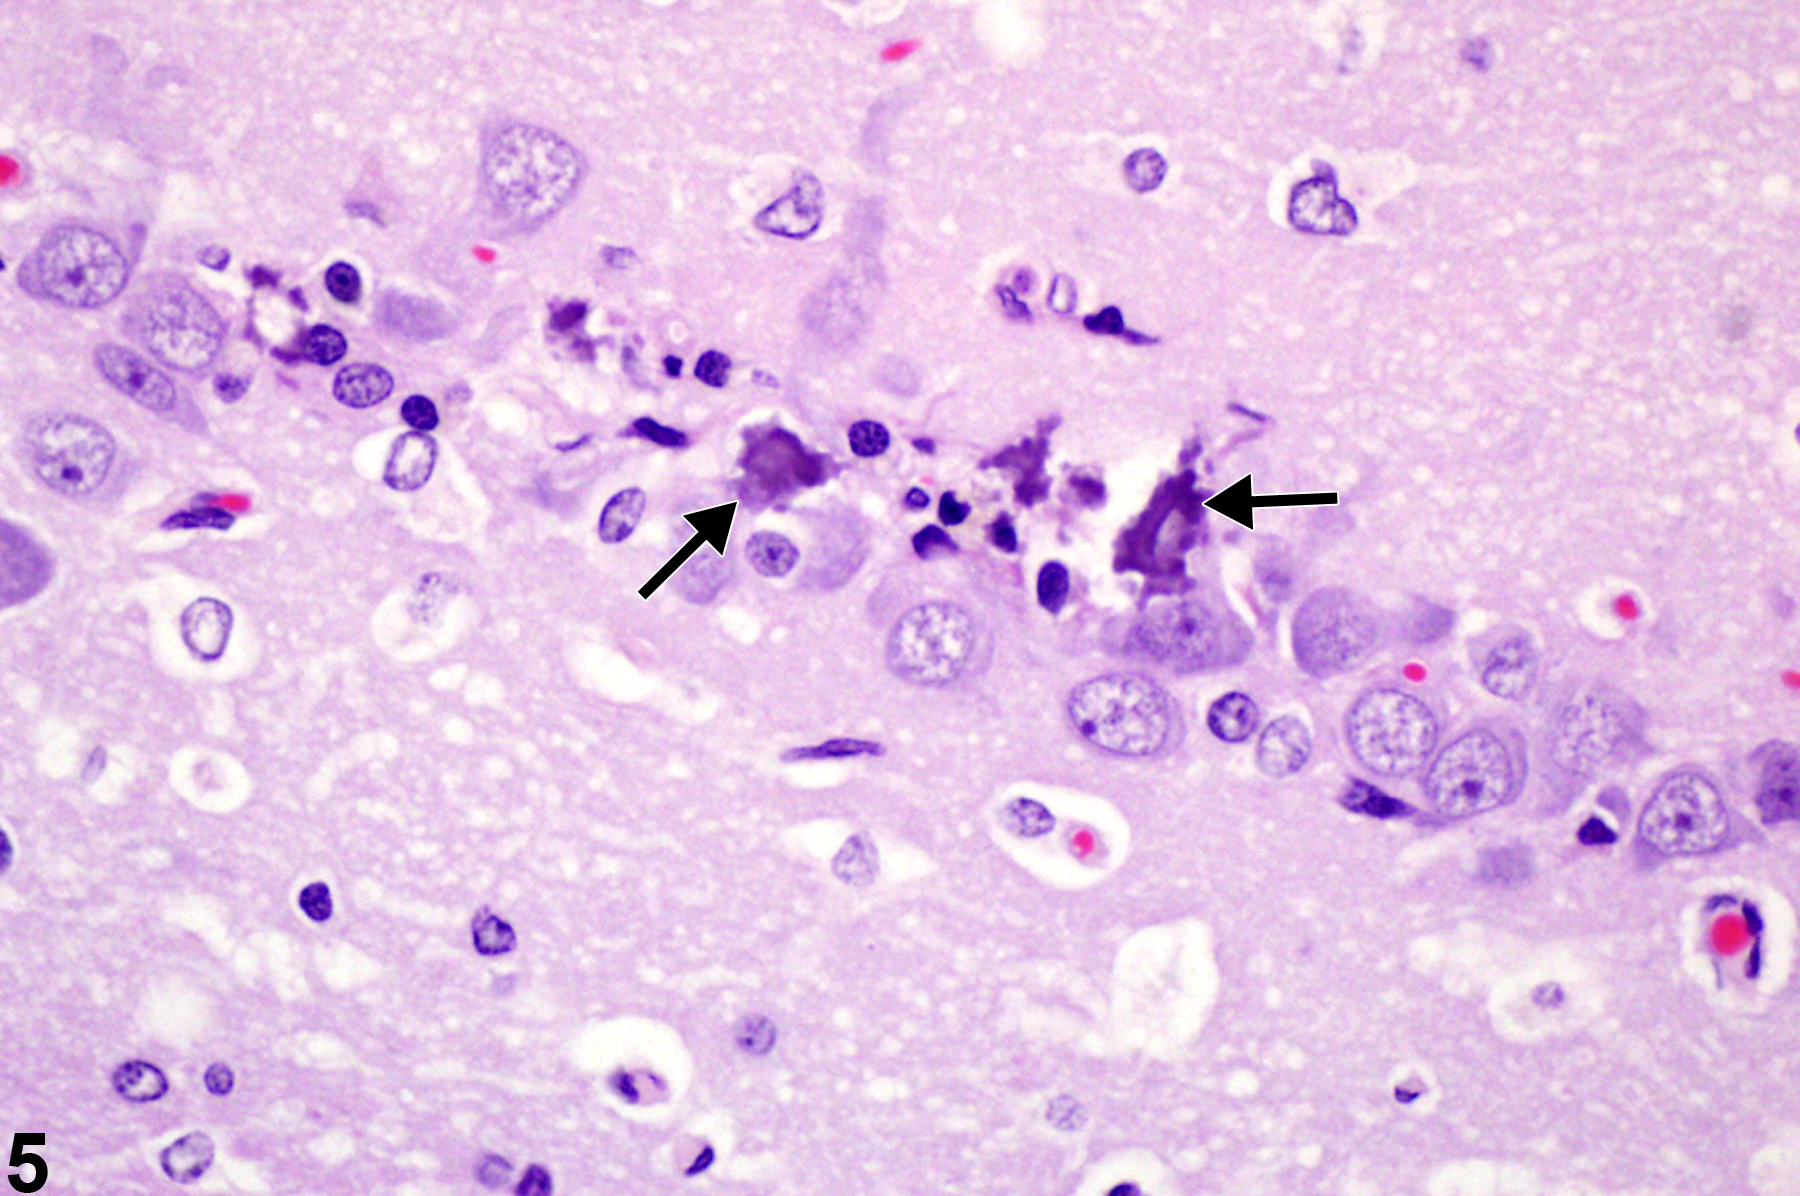
Figure 5 depicts neuronal necrosis of hippocampal pyramidal cells in the CA2 region. Note that there is more prominent, advanced ferrugination (dystrophic mineralization) of neurons (arrows) than shown in Figure 4. Some aspects of neuronal morphology are still apparent, but the perikaryon is more completely infused with mineral as the dystrophic mineralization process proceeds.
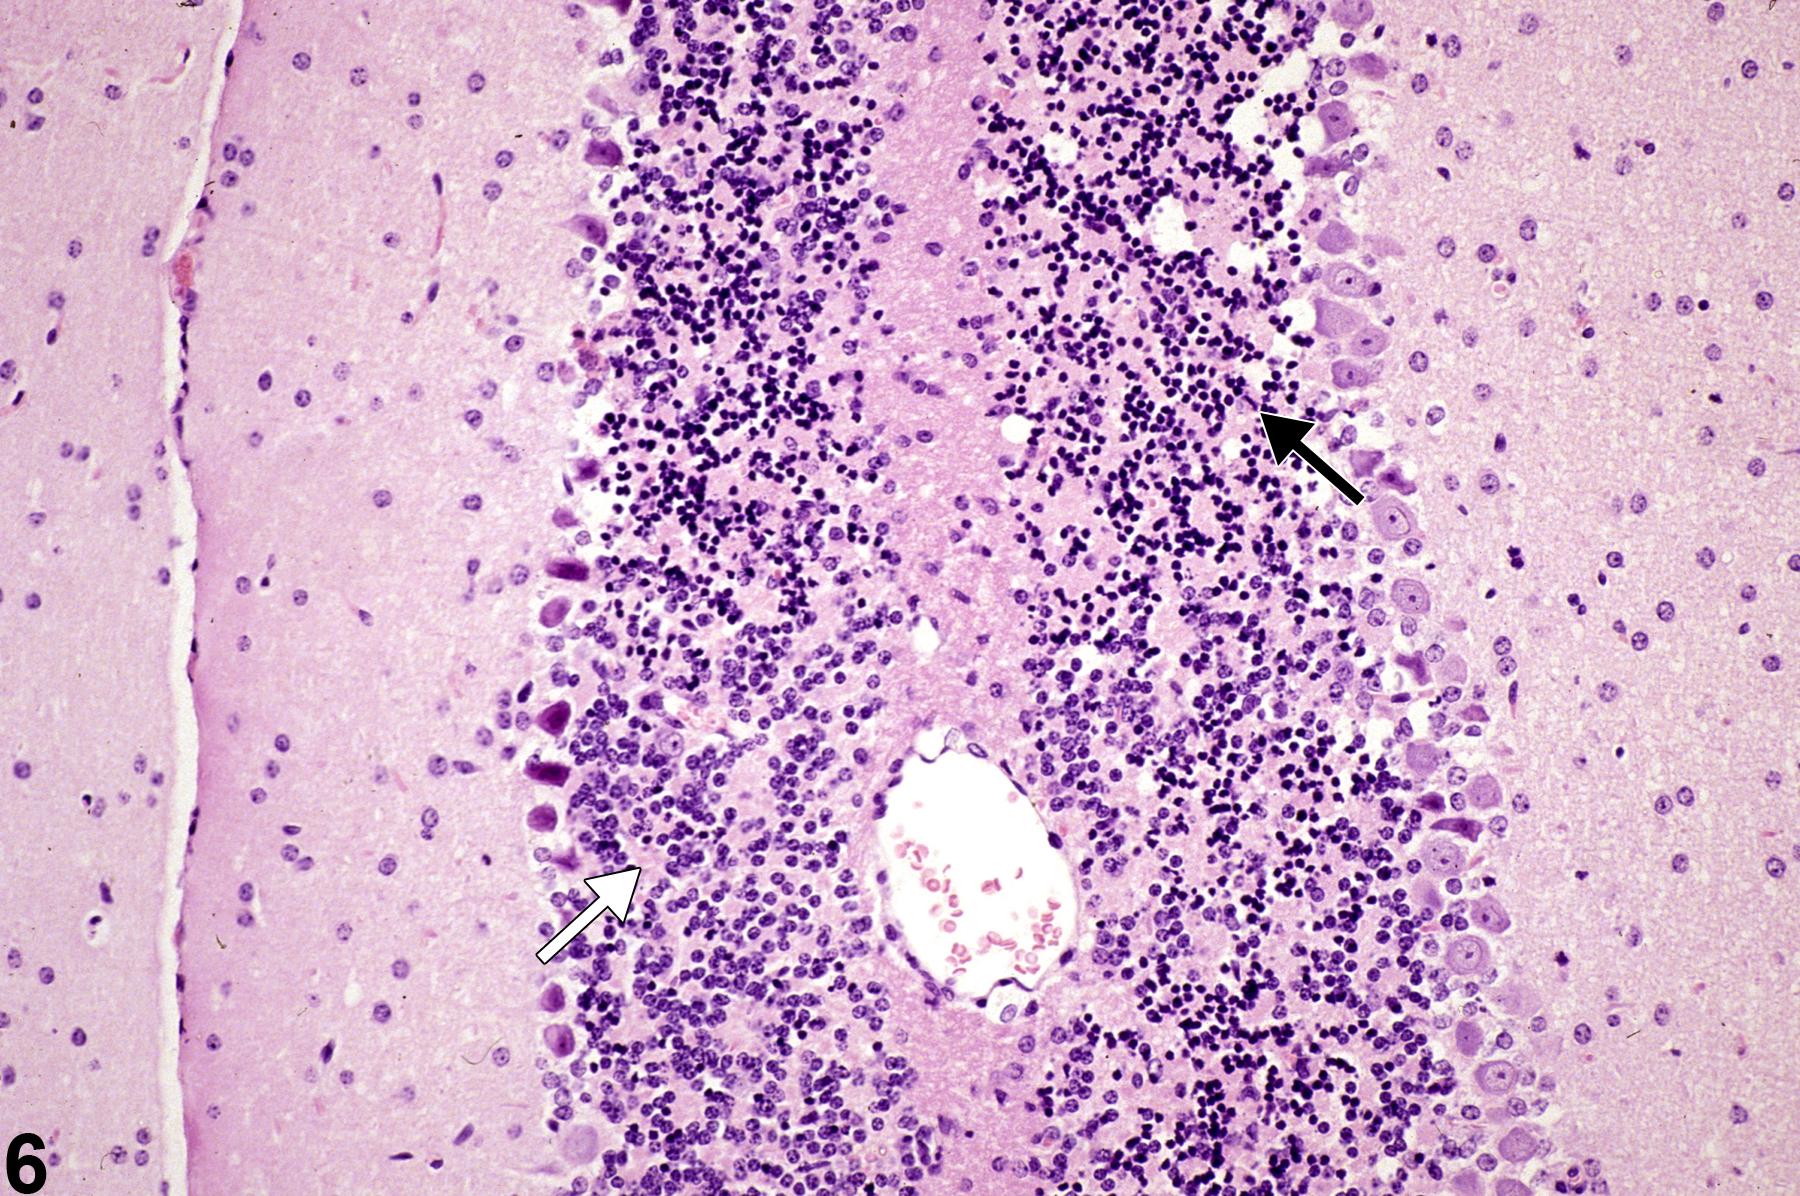
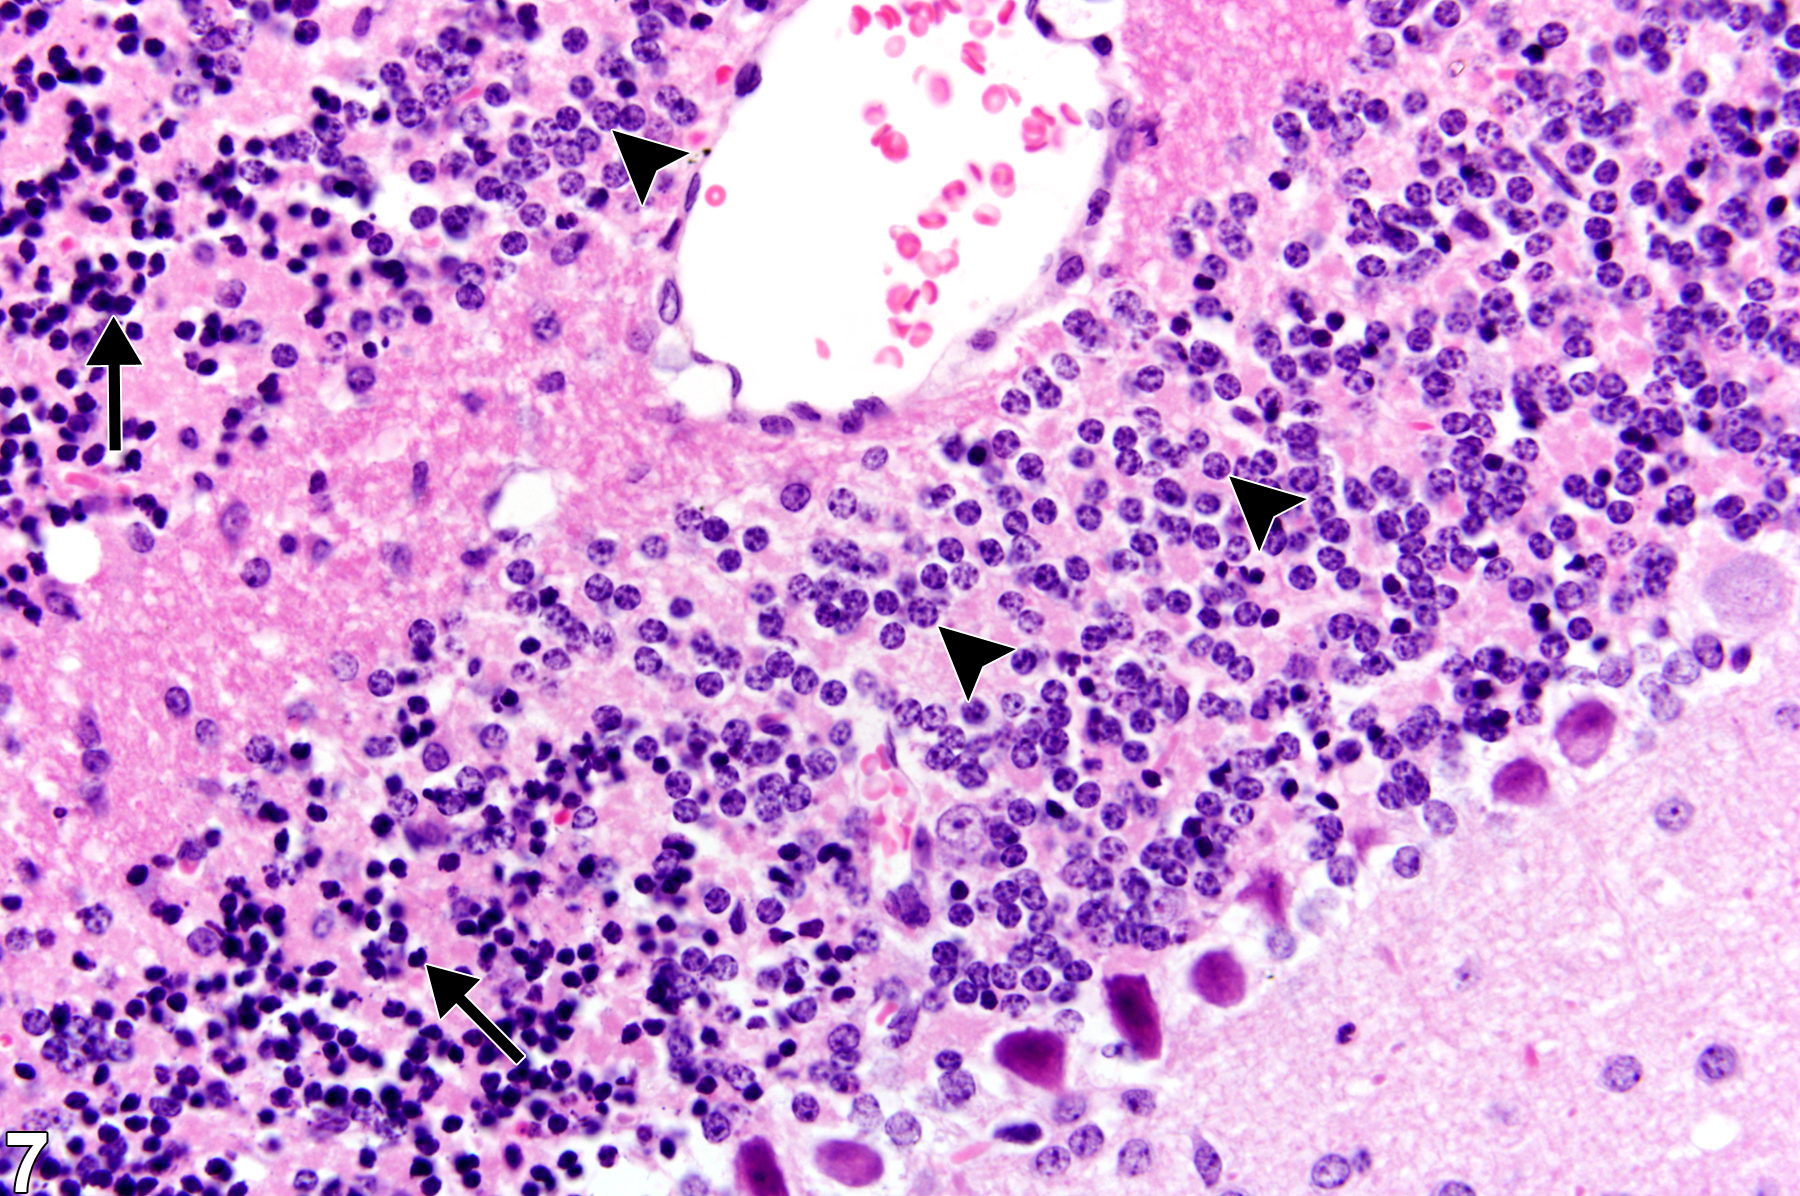
Necrosis of small neurons, such as the granule cells of the olfactory bulb and dentate gyrus and the internal granule cell layer of the cerebellum, is characterized by basophilic nuclear pyknosis with hematoxylin and eosin staining. In Figure 6, granule cells of the cerebellar internal granule cell layer have this pyknotic basophilic appearance typical of acute necrosis for this type of neuron (arrow). Many Purkinje cells retain a normal appearance in spite of the regional granule cell necrosis. For comparison, Figure 7 is a higher magnification of the cerebellar granule necrosis. Note the pyknotic nuclei (arrows) and adjacent normal nuclei (arrowheads). It is important to differentiate granule cell necrosis shown in Figure 6 and Figure 7 from the morphologic change seen in autolysis. In autolysis, while granule cell nuclei shrink, there are other indicators of autolysis in the tissue, such as widespread tissue fading and neuropil vacuolation. The marked contrast between adjacent normal and necrotic cells is helpful in differentiation of autolysis from genuine lesions of nervous tissue.
Mineralization of necrotic tissue, including brain cells, occurs over time. Where mineral deposits encrust a recognizable cell or its dendritic terminal boutons, it is important for the pathologist to recognize this chronologic feature of degenerated cells in brain and to differentiate it from yeast or mycotic hyphae with which it may be confused.
Mena H, Cadavid D, Rushing EJ. 2004. Human cerebral infarct: A proposed histopathologic classification based on 137 cases. Acta Neuropathol 108:524-530.
Abstract: http://www.ncbi.nlm.nih.gov/pubmed/15517310Schmued LC, Hopkins KJ, Fluoro-Jade B. 2000. A high affinity fluorescent marker for the localization of neuronal degeneration. Brain Res 874:123-130.
Abstract: http://www.ncbi.nlm.nih.gov/pubmed/10960596Schmued LC, Stowers CC, Scallet AC, Xu L. 2005. Fluoro-Jade C results in ultra high resolution and contrast labeling of degenerating neurons. Brain Res 1035:24-31.
Abstract: http://www.ncbi.nlm.nih.gov/pubmed/15713273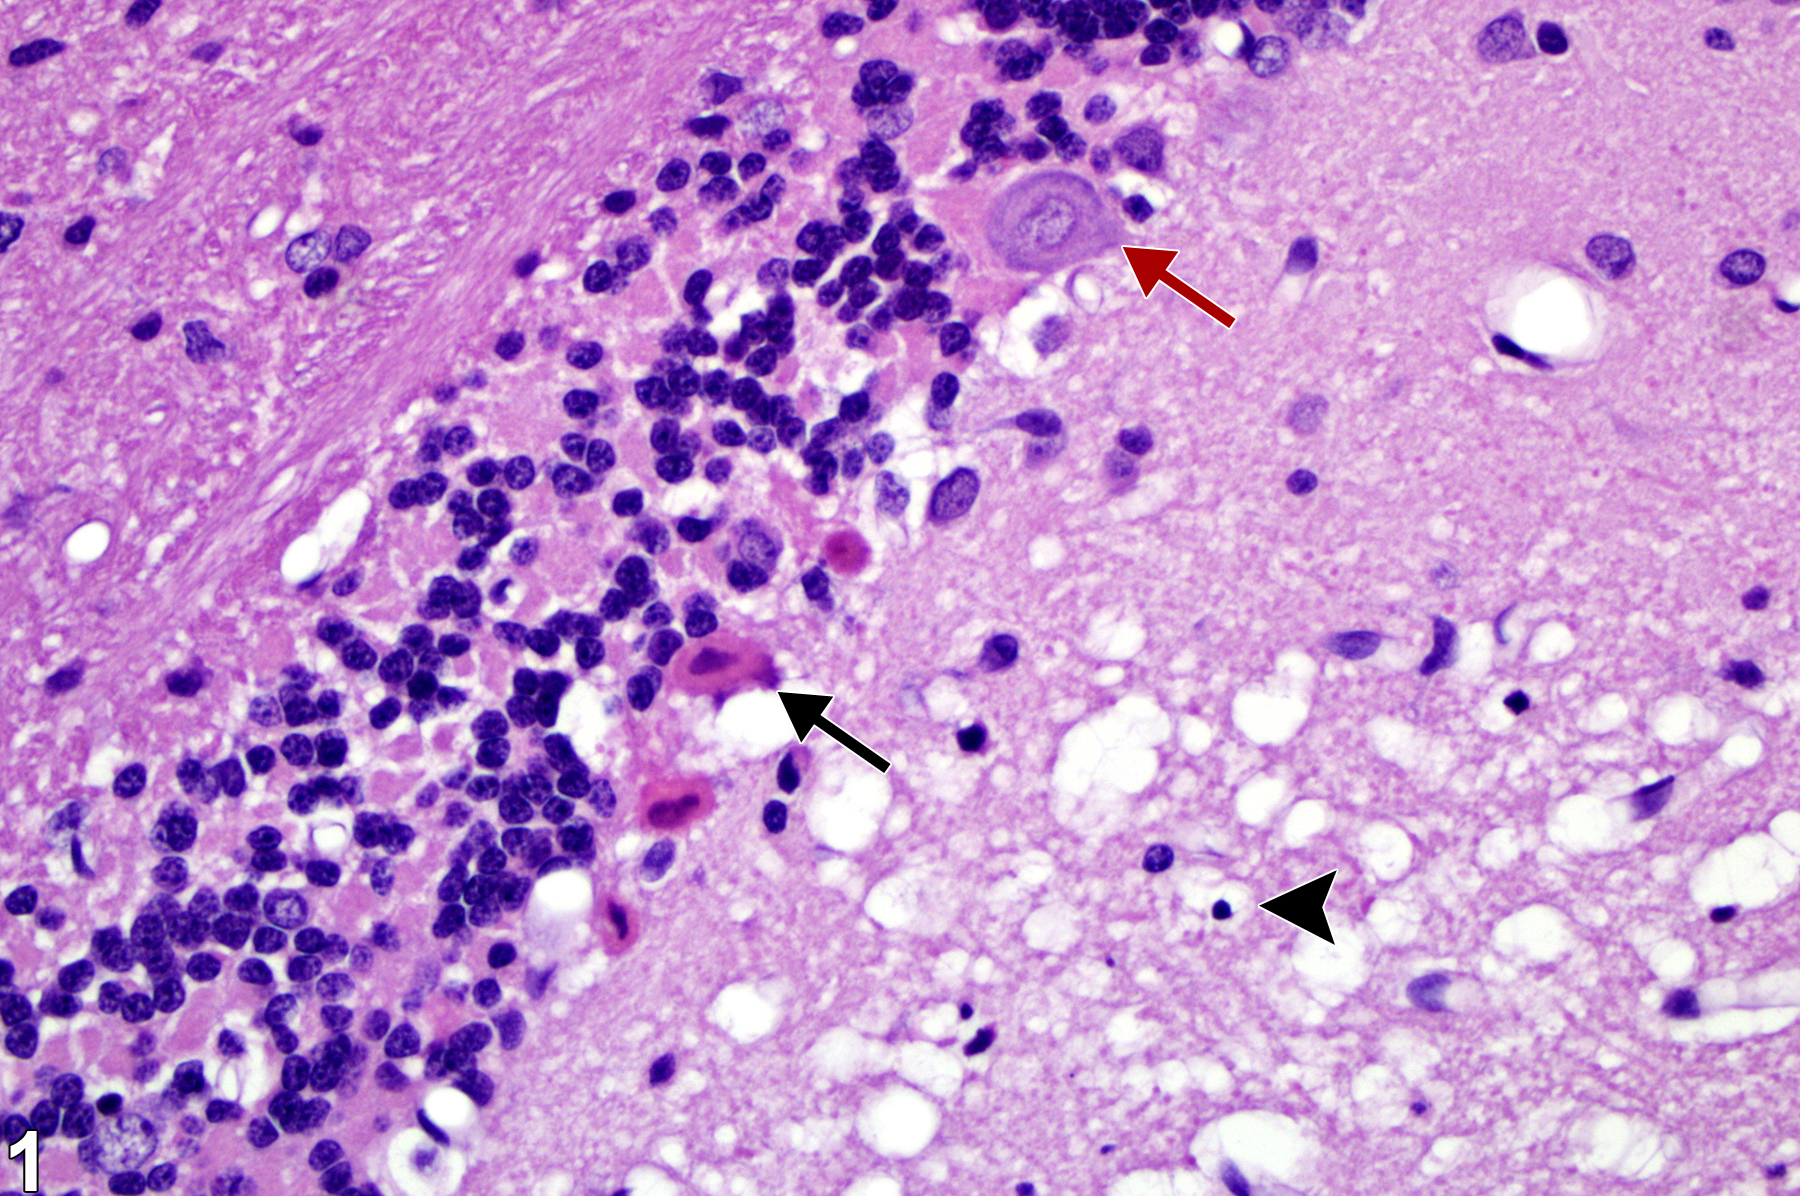
Neuronal necrosis in a male F344 rat from an acute inhalation study. The black arrow identifies acute eosinophilic necrosis. By contrast, the red arrow identifies a relatively normal neuron, and the arrowhead identifies a pyknotic nucleus amid associated vacuolation of the neuropil.
All Images

Neuronal necrosis in a male F344 rat from an acute inhalation study. The black arrow identifies acute eosinophilic necrosis. By contrast, the red arrow identifies a relatively normal neuron, and the arrowhead identifies a pyknotic nucleus amid associated vacuolation of the neuropil.

Necrotic neurons as depicted by the Fluoro-Jade technique, in a Wistar rat from a subchronic study. The blue arrow identifies a necrotic neuron, and the white arrow locates the autofluorescence of normal red blood cells in a capillary. Image kindly provided by Dr. G. Krinke. Fluoro-Jade technique.

Necrotic piriform cortical neurons in a treated male F344/N rat from a chronic study. The arrows identify necrotic and partially lytic forms of neuronal necrosis.

Basophilic neuronal necrosis (arrows) with associated punctate deposits of mineral at the surface from a female F344/N rat in a chronic study.

Hippocampal neuronal necrosis (arrows) with more advanced mineralization of the cell bodies, so-called ferrugination of neurons, in a male F344/N rat from a chronic study.

Necrosis of internal granule cells at low magnification, in a female B6C3F1 mouse from a 6-week study. Note the shrunken basophilic neurons in contrast to adjacent more normal neurons. The black arrow identifies regions with many necrotic basophilic internal granule cells, whereas the white arrow identifies a region of relative normality.

Higher magnification of necrosis of internal granule cells in a female B6C3F1 mouse from a subchronic study. Arrows identify necrotic internal granule cells, whereas arrowheads identify normal internal granule cells.